| Param | Original file | Final file |
|---|---|---|
| Filename | modeM0/AS1A12_018T01_9000005488_39566cztM0_level2.fits | modeM0/AS1A12_018T01_9000005488_39566cztM0_level2_quad_clean.evt |
| Size (bytes) | 584,441,280 | 83,269,440 |
| Size | 557.4 MB | 79.4 MB |
| Events in quadrant A | 3,750,025 | 605,026 |
| Events in quadrant B | 2,439,699 | 625,988 |
| Events in quadrant C | 5,593,965 | 555,208 |
| Events in quadrant D | 9,415,511 | 342,371 |
| Mode SS | |||
|---|---|---|---|
| Quadrant | BADHDUFLAG | Total packets | Discarded packets |
| A | 0 | 116 | 0 |
| B | 0 | 116 | 0 |
| C | 0 | 116 | 0 |
| D | 0 | 116 | 0 |
| Mode M0 | |||
|---|---|---|---|
| Quadrant | BADHDUFLAG | Total packets | Discarded packets |
| A | 0 | 15043 | 3 |
| B | 0 | 11574 | 2 |
| C | 0 | 20468 | 2 |
| D | 0 | 31872 | 2 |
| Mode M9 | |||
|---|---|---|---|
| Quadrant | BADHDUFLAG | Total packets | Discarded packets |
| A | 0 | 29 | 0 |
| B | 0 | 29 | 0 |
| C | 0 | 29 | 0 |
| D | 0 | 30 | 0 |
| Quadrant | Total seconds | Saturated seconds | Saturation percentage |
|---|---|---|---|
| A | 5607 | 88 | 1.569467% |
| B | 5607 | 25 | 0.445871% |
| C | 5607 | 567 | 10.112360% |
| D | 5607 | 2443 | 43.570537% |
Noise dominated data is calculated using 1-second bins in cleaned event files. If a bin has >2000 counts, and if more than 50% of those come from <1% of pixels, then it is considered to be noise-dominated and hence unusable.
| Quadrant | # 1 sec bins | Bins with >0 counts | Bins with >2000 counts | High rate bins dominated by noise | Noise dominated (total time) | Noise dominated (detector-on time) | Marked lightcurve |
|---|---|---|---|---|---|---|---|
| A | 7250 | 5608 | 62 | 62 | 0.86% | 1.11% | 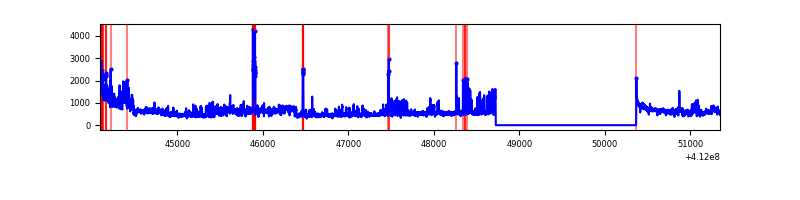 |
| B | 7250 | 5608 | 10 | 10 | 0.14% | 0.18% | 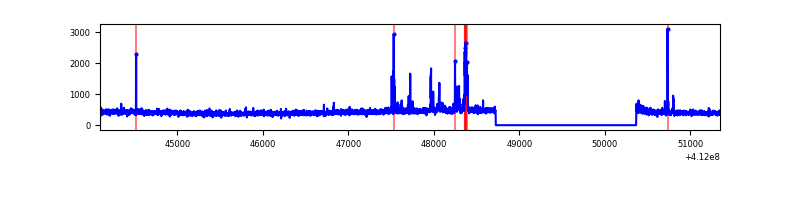 |
| C | 7250 | 5608 | 584 | 584 | 8.06% | 10.41% | 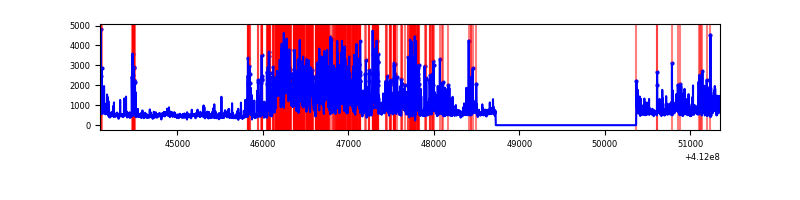 |
| D | 7250 | 5608 | 2316 | 2316 | 31.94% | 41.30% | 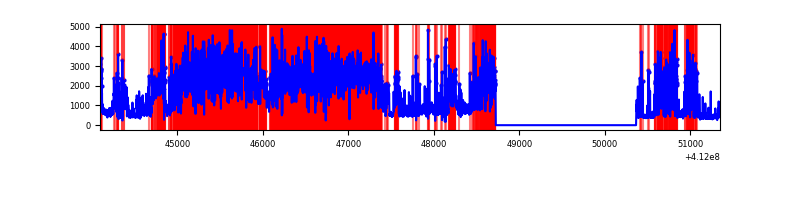 |
Top three noisy pixels from each quadrant. If the there are fewer than three noisy pixels in the level2.evt file, extra rows are filled as -1
| Pixel properties | Quadrant properties | ||||||
|---|---|---|---|---|---|---|---|
| Quadrant | DetID | PixID | Counts | Sigma | Mean | Median | Sigma |
| A | 15 | 222 | 993319 | 8414.69 | 582 | 570 | 118.0 |
| A | 10 | 83 | 437715 | 3705.31 | 582 | 570 | 118.0 |
| A | 6 | 10 | 33640 | 280.31 | 582 | 570 | 118.0 |
| B | 5 | 255 | 121882 | 1072.87 | 582 | 565 | 113.1 |
| B | 0 | 230 | 18918 | 162.31 | 582 | 565 | 113.1 |
| B | 12 | 111 | 14299 | 121.46 | 582 | 565 | 113.1 |
| C | 15 | 208 | 2654321 | 20663.57 | 551 | 554 | 128.4 |
| C | 9 | 187 | 540377 | 4203.33 | 551 | 554 | 128.4 |
| C | 15 | 214 | 227678 | 1768.5 | 551 | 554 | 128.4 |
| D | 7 | 38 | 5690887 | 50073.06 | 468 | 454 | 113.6 |
| D | 12 | 227 | 924567 | 8131.75 | 468 | 454 | 113.6 |
| D | 1 | 47 | 600922 | 5283.83 | 468 | 454 | 113.6 |
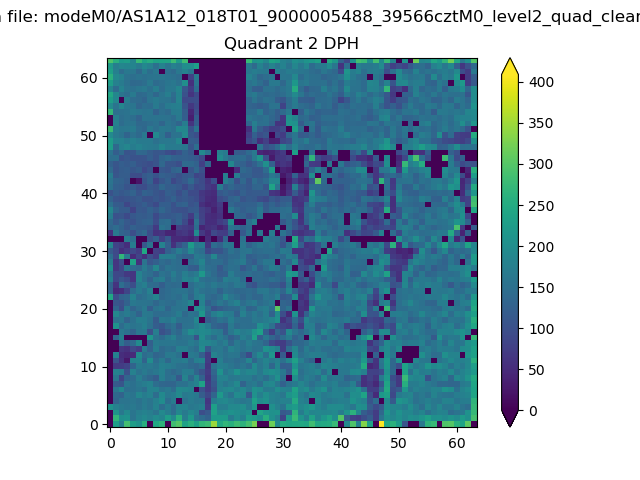
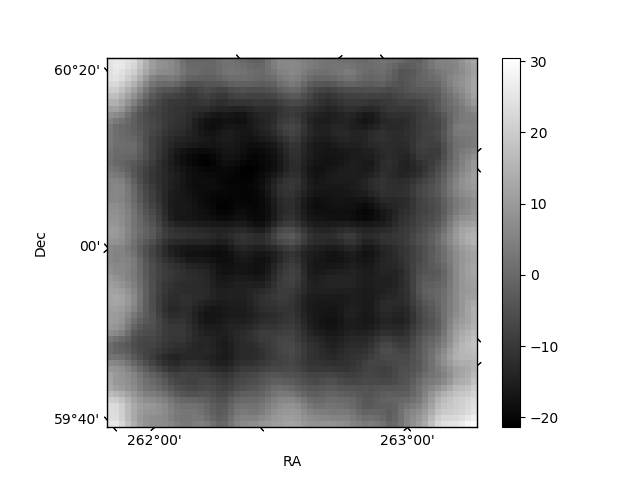
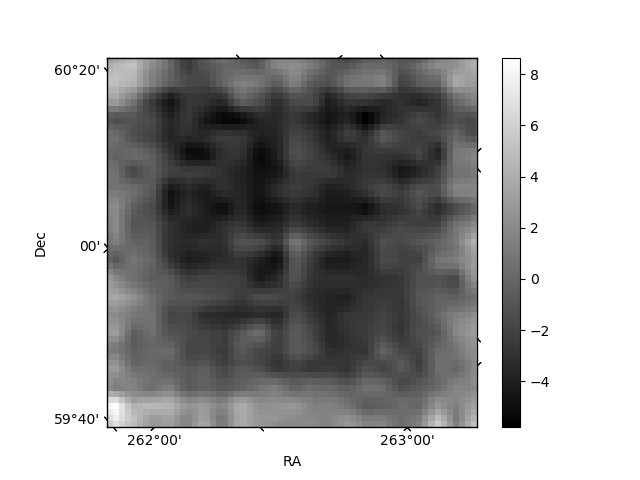
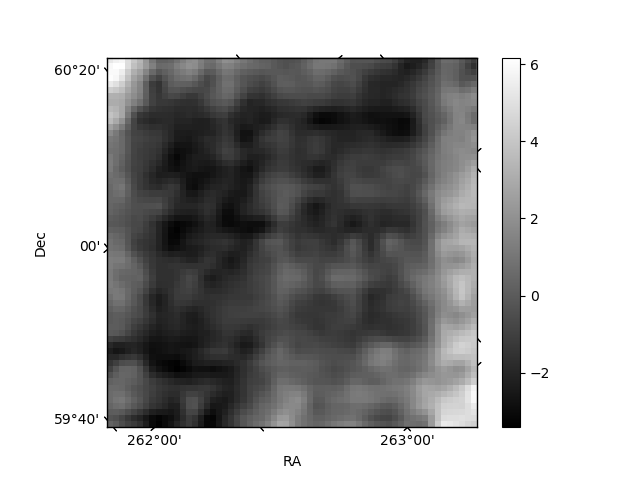
Histogram calculated using DETX and DETY for each event in the final _common_clean file
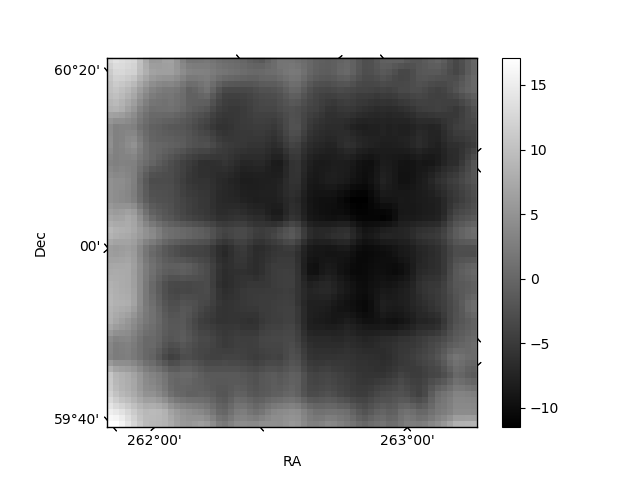
| Quadrant A | 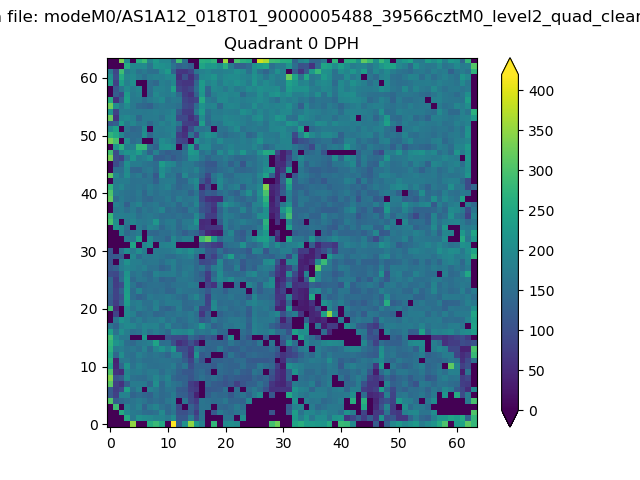 |
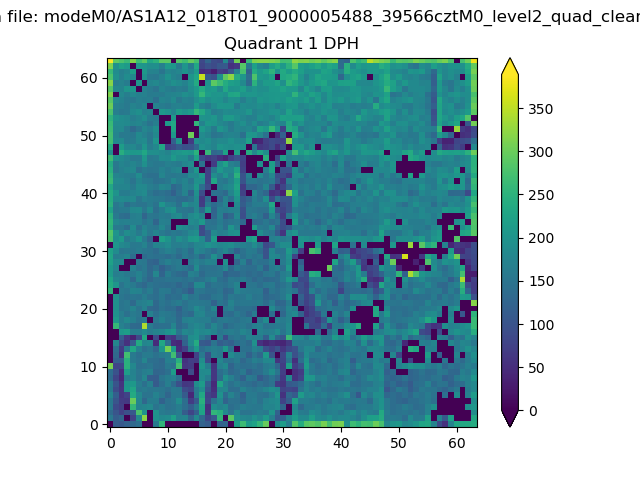 |
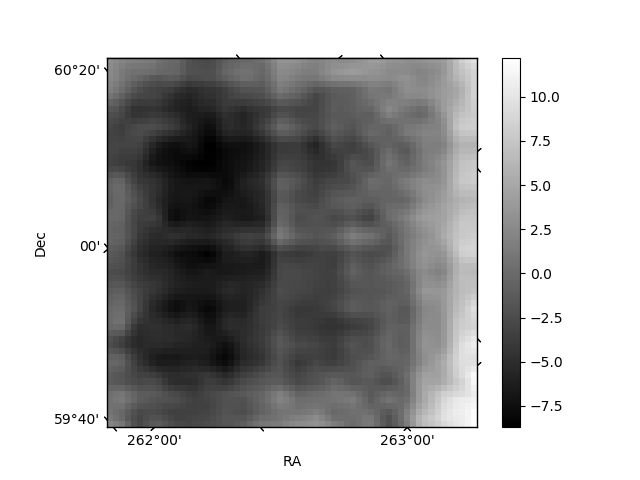
Quadrant B |
|---|---|---|---|
| Quadrant D | 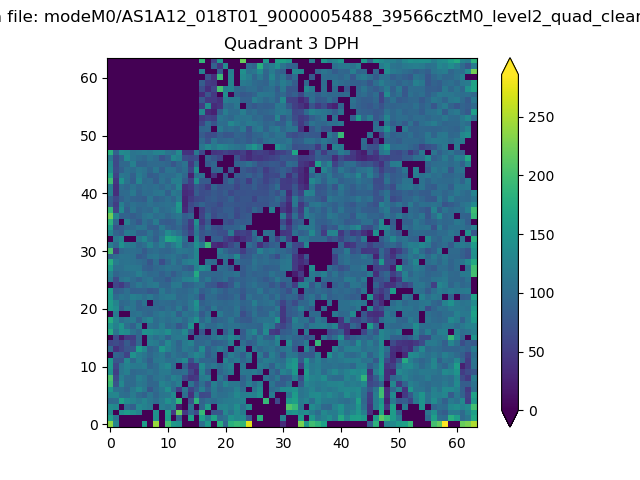 |
 |
Quadrant C |
| Plot type | Count rate plots | Images |
|---|---|---|
| Comparison with Poisson distribution Blue bars denote a histogram of data divided into 1 sec bins. Red curve is a Poisson curve with rate = median count rate of data. |
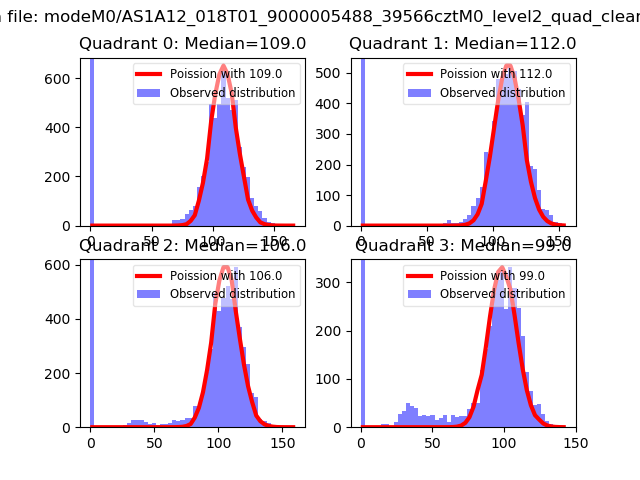 |
 |
| Quadrant-wise count rates Data is divided into 100 sec bins |
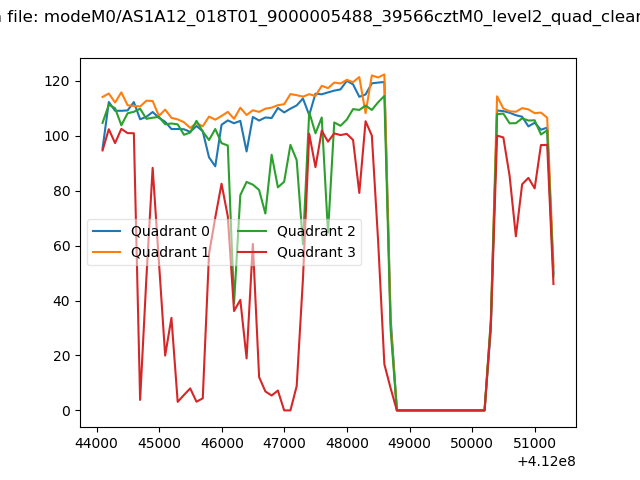 |
|
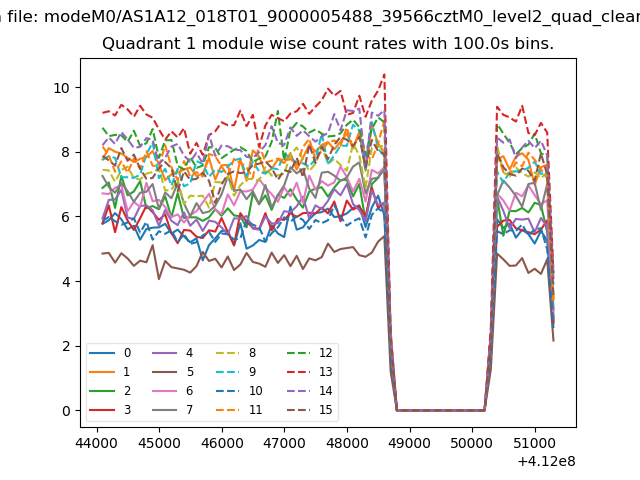
| Module-wise count rates for Quadrant A Data is divided into 100 sec bins |
 |
 |
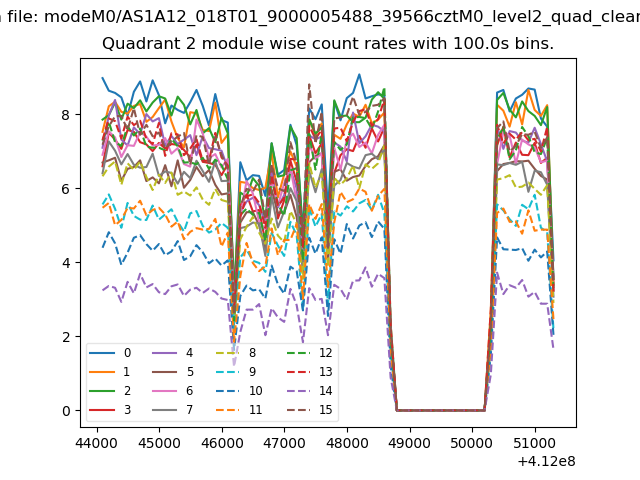
| Module-wise count rates for Quadrant B Data is divided into 100 sec bins |
 |
 |
| Module-wise count rates for Quadrant C Data is divided into 100 sec bins |
 |
 |
| Module-wise count rates for Quadrant D Data is divided into 100 sec bins |
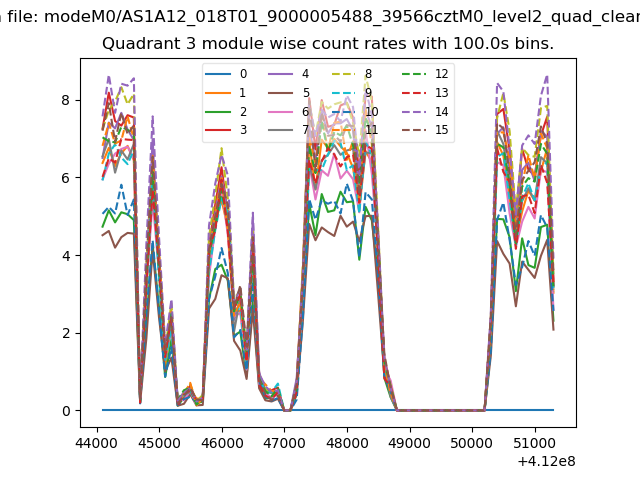 |
 |
| Parameter | Plot |
|---|---|
| CZT HV Monitor | 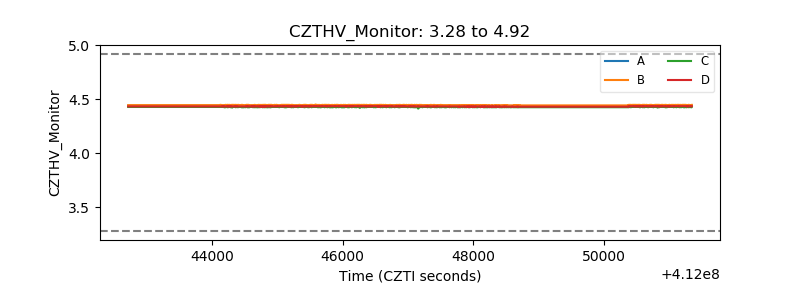 |
| D_VDD | 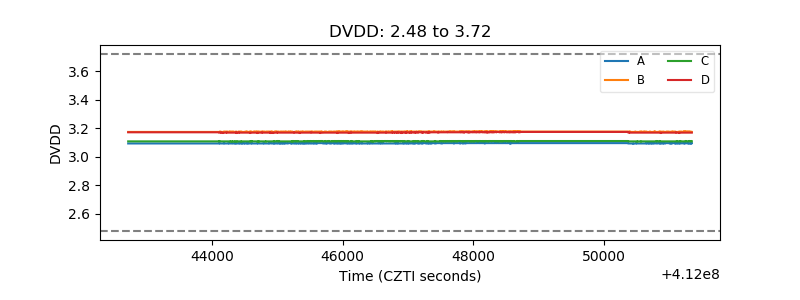 |
| Temperature 1 | 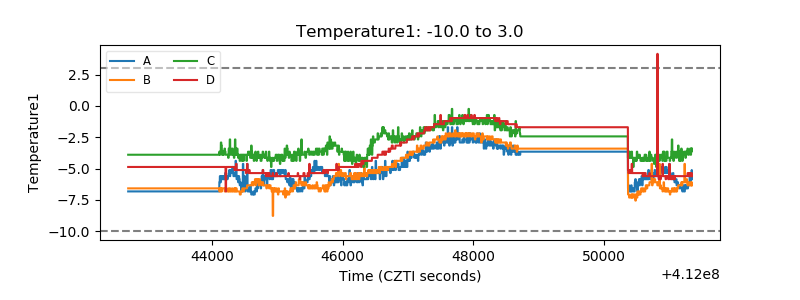 |
| Veto HV Monitor | 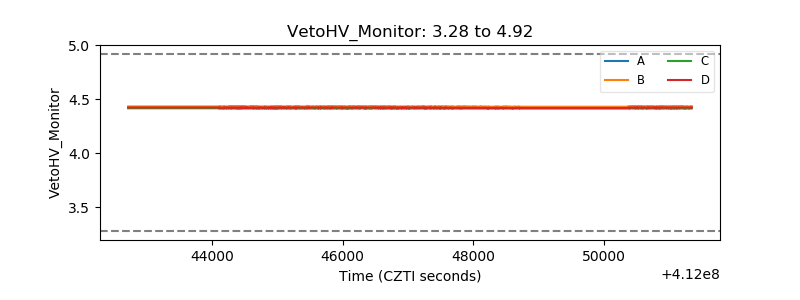 |
| Veto LLD | 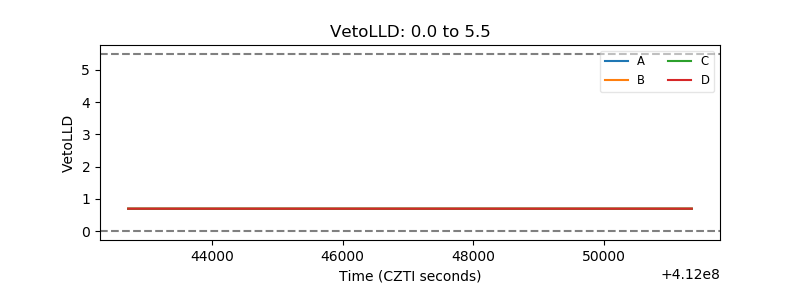 |
| Alpha Counter | 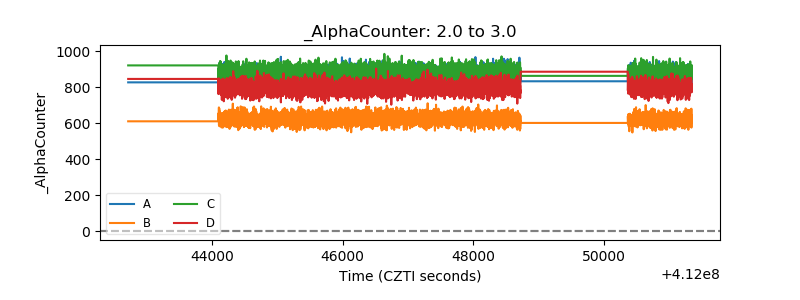 |
| _CPM_Rate |  |
| CZT Counter | 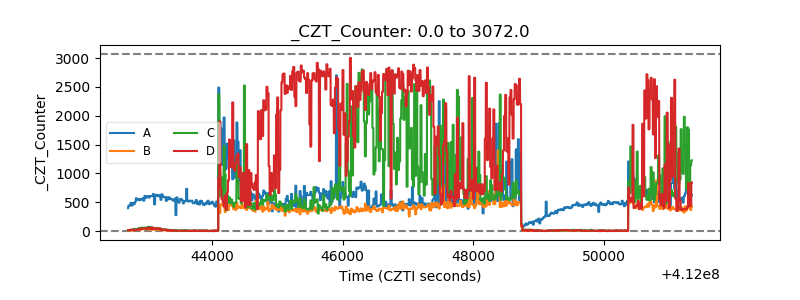 |
| +2.5 Volts monitor |  |
| +5 Volts monitor | 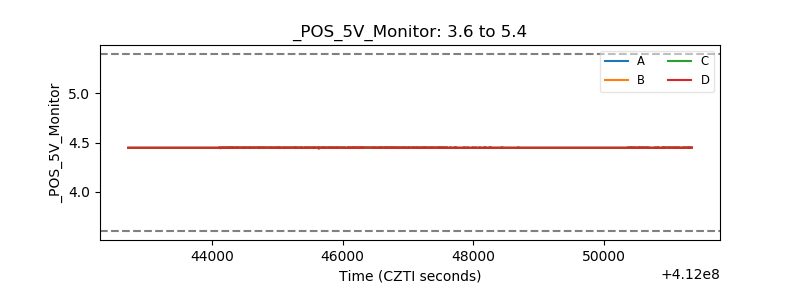 |
| _ROLL_ROT | 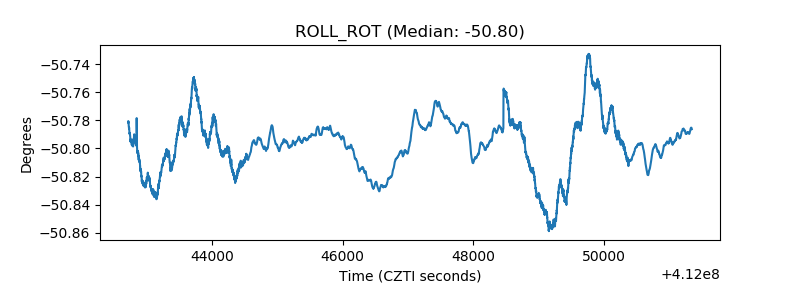 |
| _Roll_DEC | 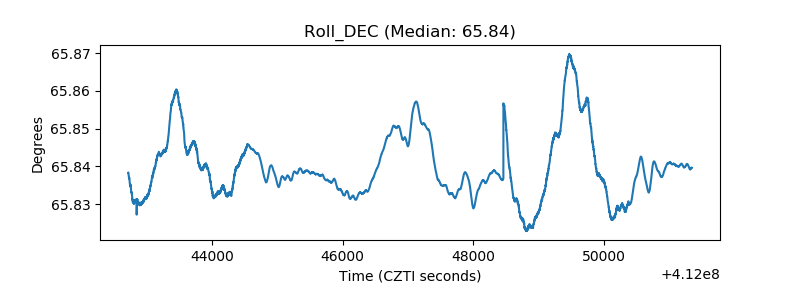 |
| _Roll_RA | 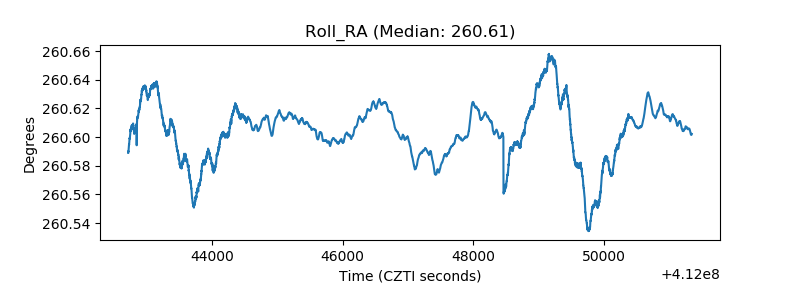 |
| Veto Counter | 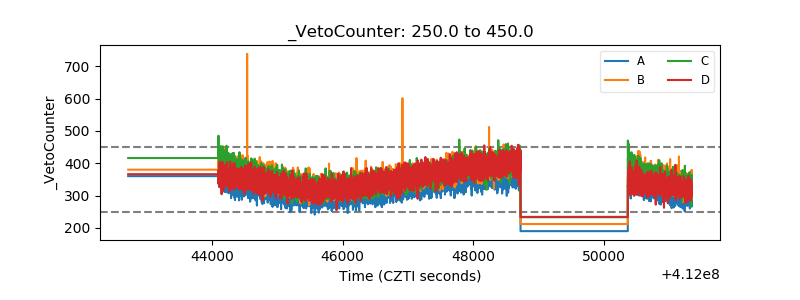 |