| Param | Original file | Final file |
|---|---|---|
| Filename | modeM0/AS1A12_018T01_9000005488_39567cztM0_level2.fits | modeM0/AS1A12_018T01_9000005488_39567cztM0_level2_quad_clean.evt |
| Size (bytes) | 506,727,360 | 92,041,920 |
| Size | 483.3 MB | 87.8 MB |
| Events in quadrant A | 4,670,182 | 626,242 |
| Events in quadrant B | 2,456,365 | 647,897 |
| Events in quadrant C | 6,988,665 | 561,612 |
| Events in quadrant D | 4,190,405 | 543,865 |
| Mode SS | |||
|---|---|---|---|
| Quadrant | BADHDUFLAG | Total packets | Discarded packets |
| A | 0 | 118 | 0 |
| B | 0 | 118 | 0 |
| C | 0 | 118 | 0 |
| D | 0 | 118 | 0 |
| Mode M0 | |||
|---|---|---|---|
| Quadrant | BADHDUFLAG | Total packets | Discarded packets |
| A | 0 | 17970 | 3 |
| B | 0 | 11776 | 2 |
| C | 0 | 24908 | 2 |
| D | 0 | 16601 | 2 |
| Mode M9 | |||
|---|---|---|---|
| Quadrant | BADHDUFLAG | Total packets | Discarded packets |
| A | 0 | 28 | 0 |
| B | 0 | 28 | 0 |
| C | 0 | 28 | 0 |
| D | 0 | 29 | 0 |
| Quadrant | Total seconds | Saturated seconds | Saturation percentage |
|---|---|---|---|
| A | 5829 | 39 | 0.669068% |
| B | 5829 | 8 | 0.137245% |
| C | 5829 | 739 | 12.677989% |
| D | 5829 | 384 | 6.587751% |
Noise dominated data is calculated using 1-second bins in cleaned event files. If a bin has >2000 counts, and if more than 50% of those come from <1% of pixels, then it is considered to be noise-dominated and hence unusable.
| Quadrant | # 1 sec bins | Bins with >0 counts | Bins with >2000 counts | High rate bins dominated by noise | Noise dominated (total time) | Noise dominated (detector-on time) | Marked lightcurve |
|---|---|---|---|---|---|---|---|
| A | 7202 | 5830 | 16 | 16 | 0.22% | 0.27% | 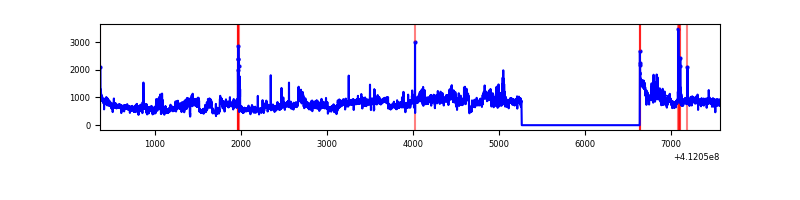 |
| B | 7202 | 5830 | 1 | 1 | 0.01% | 0.02% | 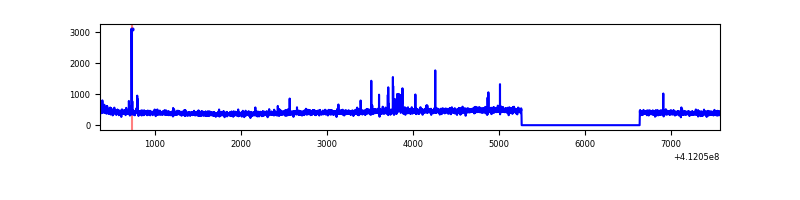 |
| C | 7202 | 5830 | 712 | 712 | 9.89% | 12.21% | 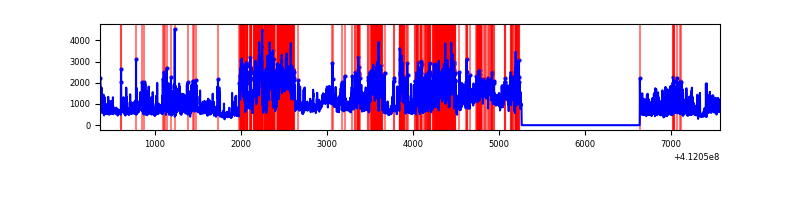 |
| D | 7202 | 5830 | 362 | 362 | 5.03% | 6.21% | 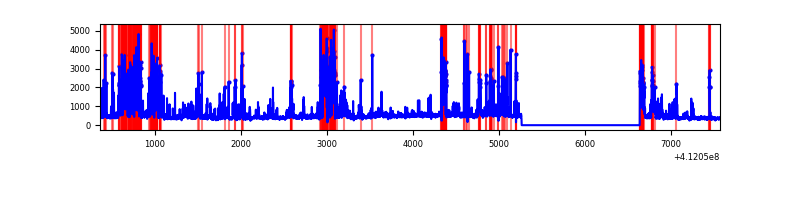 |
Top three noisy pixels from each quadrant. If the there are fewer than three noisy pixels in the level2.evt file, extra rows are filled as -1
| Pixel properties | Quadrant properties | ||||||
|---|---|---|---|---|---|---|---|
| Quadrant | DetID | PixID | Counts | Sigma | Mean | Median | Sigma |
| A | 15 | 222 | 1728161 | 13820.64 | 607 | 595 | 125.0 |
| A | 10 | 83 | 460930 | 3682.71 | 607 | 595 | 125.0 |
| A | 13 | 248 | 44871 | 354.21 | 607 | 595 | 125.0 |
| B | 5 | 255 | 46735 | 390.15 | 609 | 591 | 118.3 |
| B | 12 | 111 | 14935 | 121.28 | 609 | 591 | 118.3 |
| B | 11 | 111 | 13718 | 110.99 | 609 | 591 | 118.3 |
| C | 9 | 187 | 2635482 | 19705.56 | 574 | 576 | 133.7 |
| C | 15 | 208 | 1817182 | 13585.77 | 574 | 576 | 133.7 |
| C | 15 | 214 | 236797 | 1766.62 | 574 | 576 | 133.7 |
| D | 12 | 227 | 931728 | 6555.48 | 580 | 564 | 142.0 |
| D | 1 | 47 | 716984 | 5043.67 | 580 | 564 | 142.0 |
| D | 13 | 249 | 153435 | 1076.23 | 580 | 564 | 142.0 |
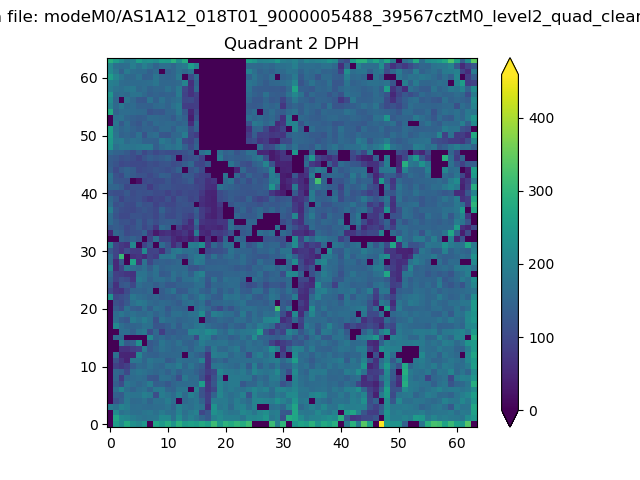
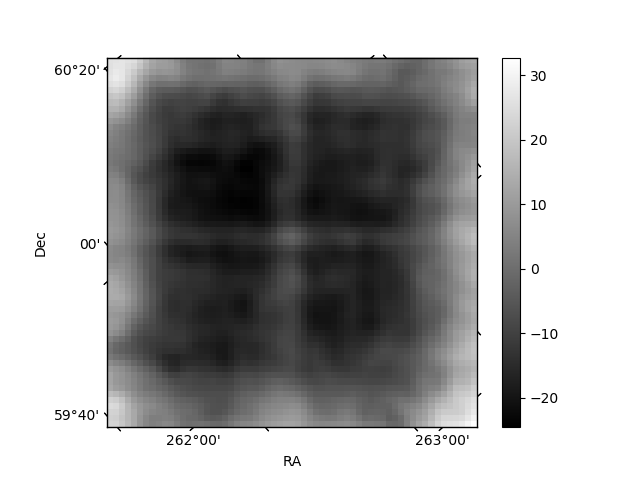
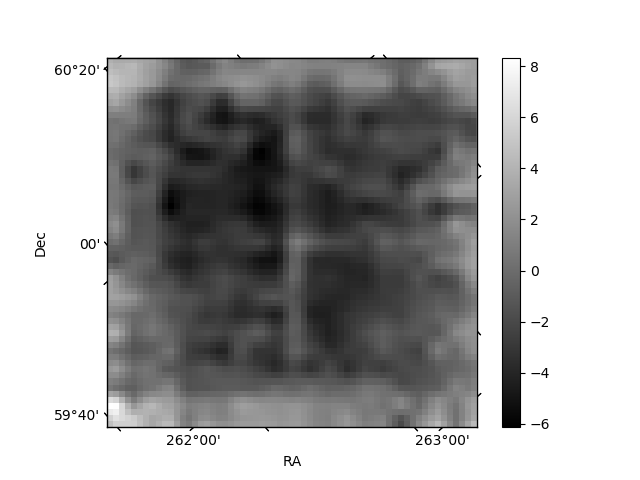
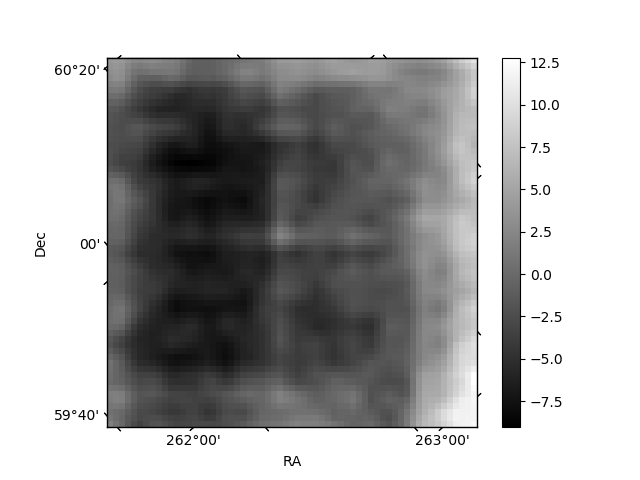
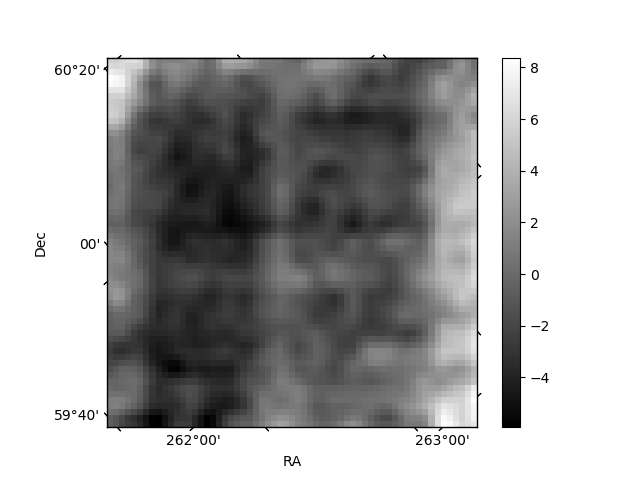
Histogram calculated using DETX and DETY for each event in the final _common_clean file
| Quadrant A | 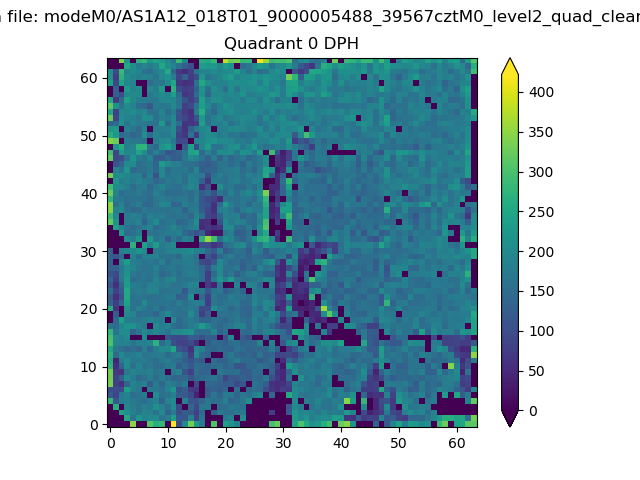 |
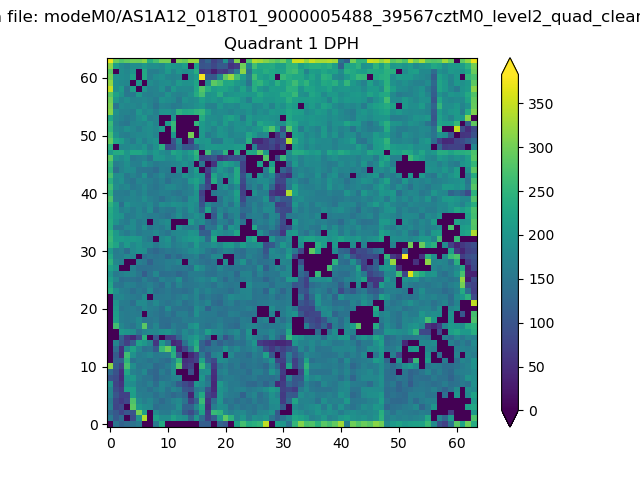 |
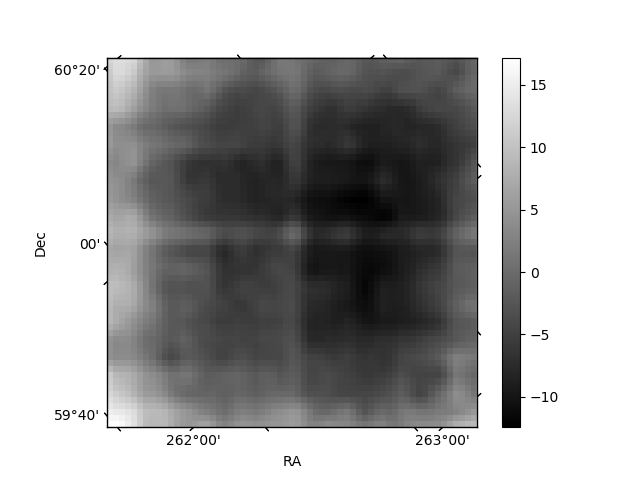
Quadrant B |
|---|---|---|---|
| Quadrant D | 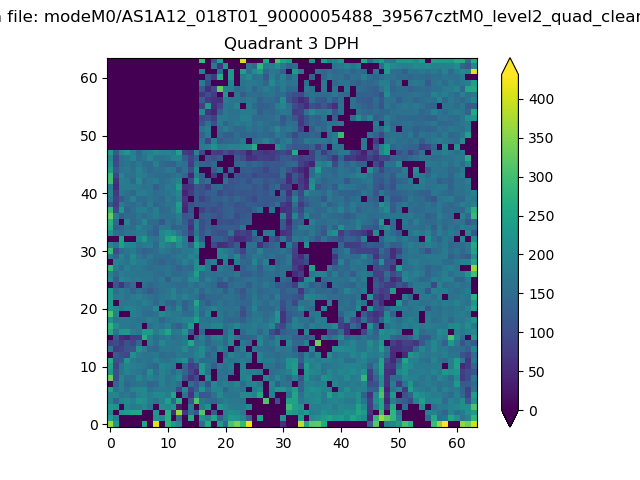 |
 |
Quadrant C |
| Plot type | Count rate plots | Images |
|---|---|---|
| Comparison with Poisson distribution Blue bars denote a histogram of data divided into 1 sec bins. Red curve is a Poisson curve with rate = median count rate of data. |
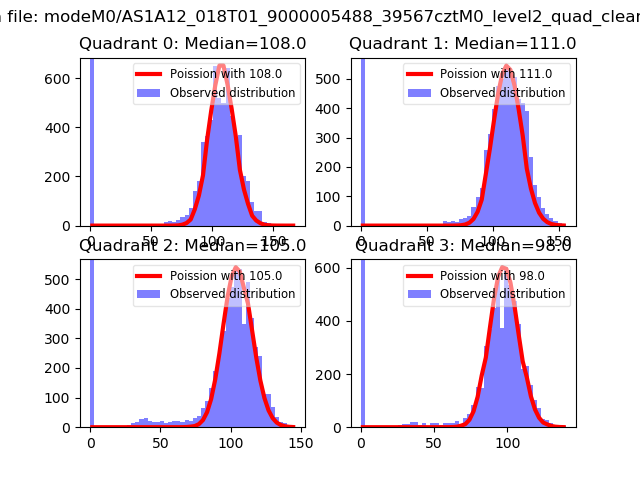 |
 |
| Quadrant-wise count rates Data is divided into 100 sec bins |
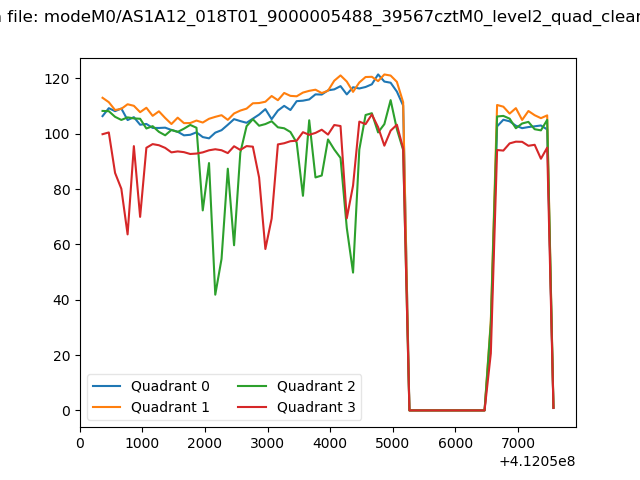 |
|
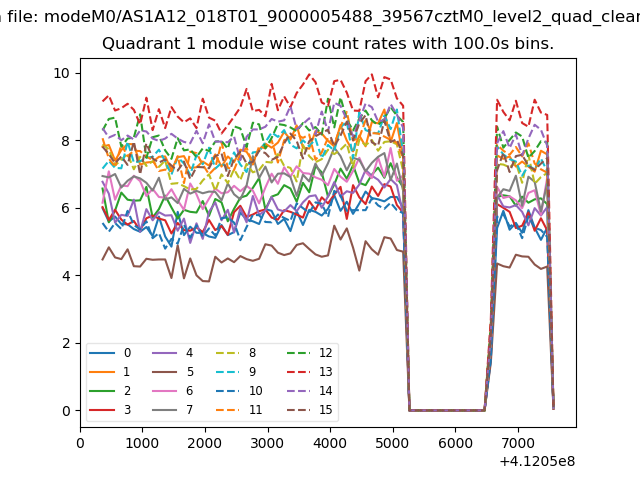
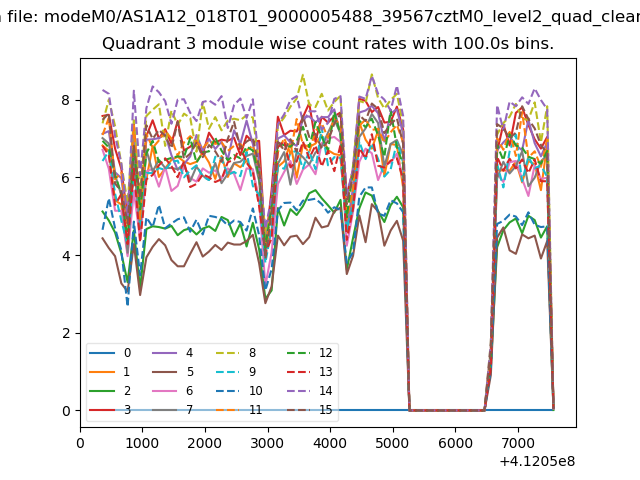
| Module-wise count rates for Quadrant A Data is divided into 100 sec bins |
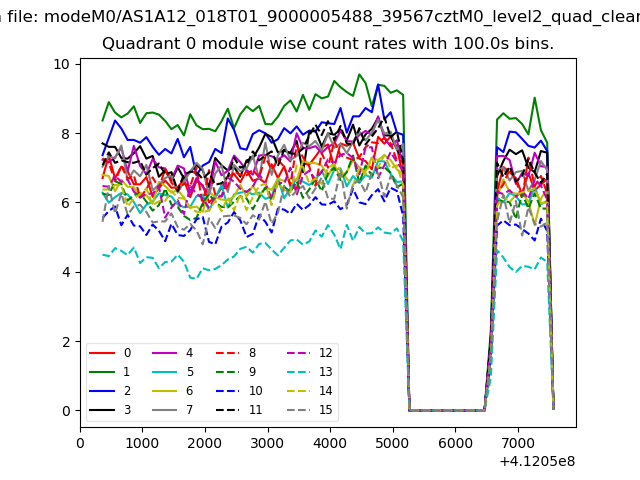 |
 |
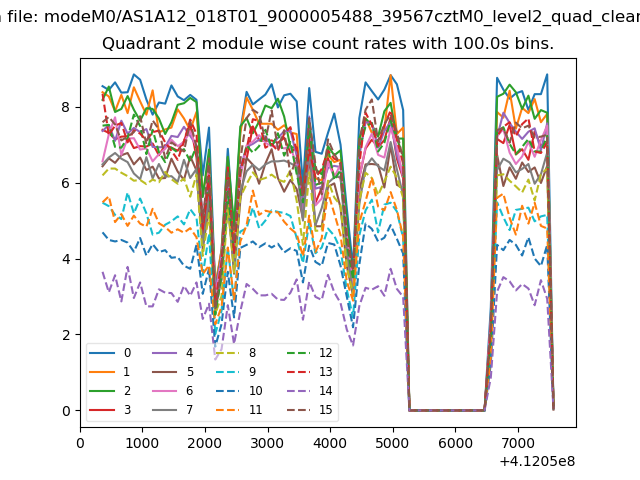
| Module-wise count rates for Quadrant B Data is divided into 100 sec bins |
 |
 |
| Module-wise count rates for Quadrant C Data is divided into 100 sec bins |
 |
 |
| Module-wise count rates for Quadrant D Data is divided into 100 sec bins |
 |
 |
| Parameter | Plot |
|---|---|
| CZT HV Monitor | 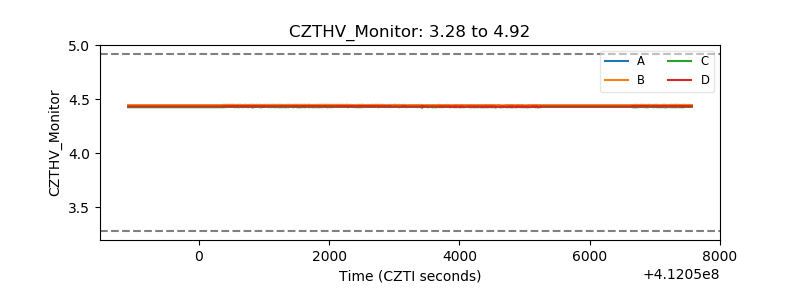 |
| D_VDD | 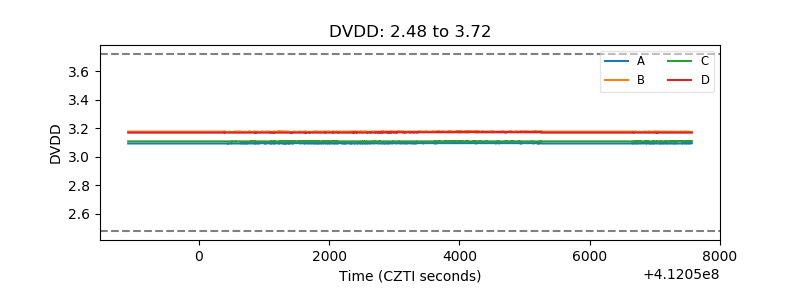 |
| Temperature 1 | 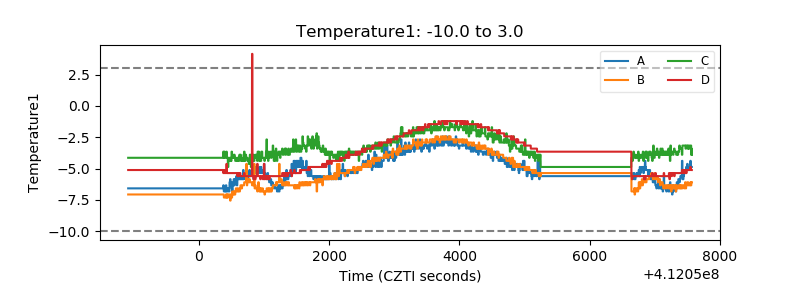 |
| Veto HV Monitor | 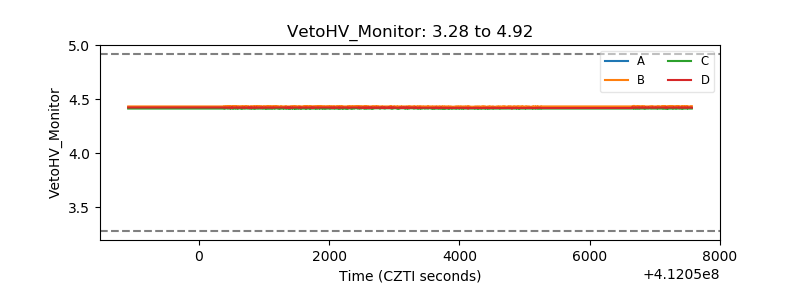 |
| Veto LLD | 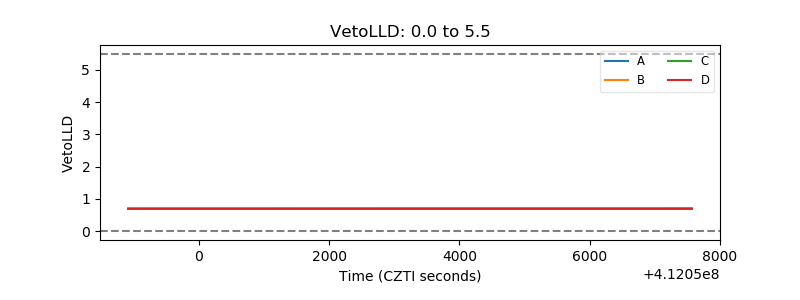 |
| Alpha Counter | 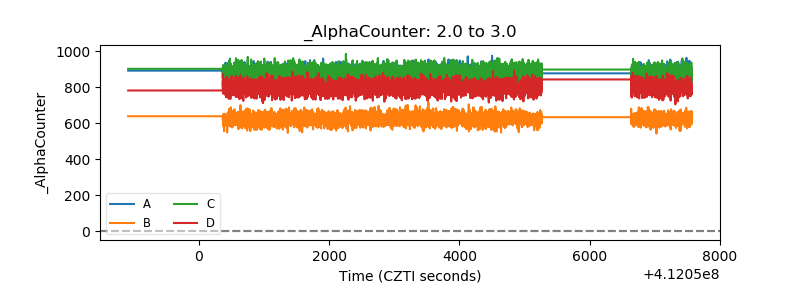 |
| _CPM_Rate | 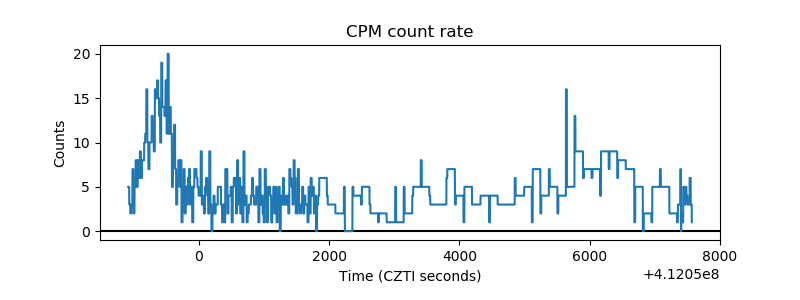 |
| CZT Counter | 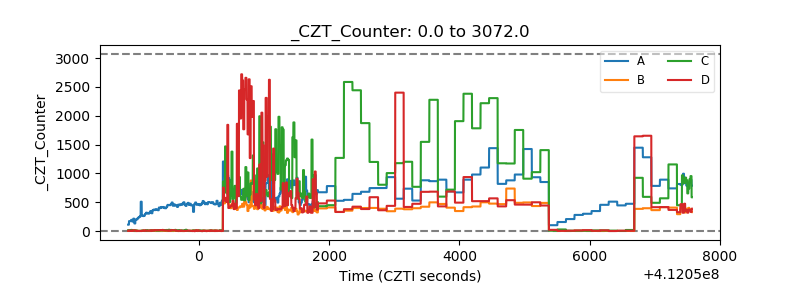 |
| +2.5 Volts monitor | 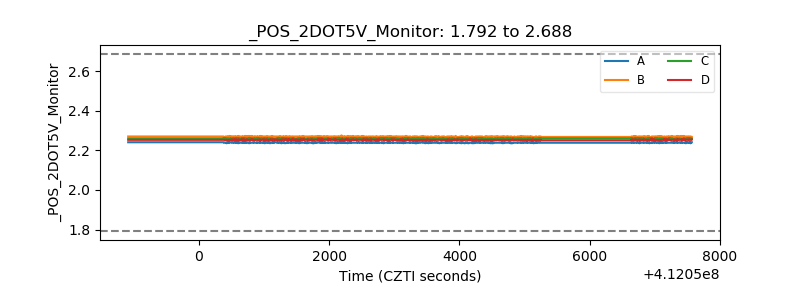 |
| +5 Volts monitor |  |
| _ROLL_ROT | 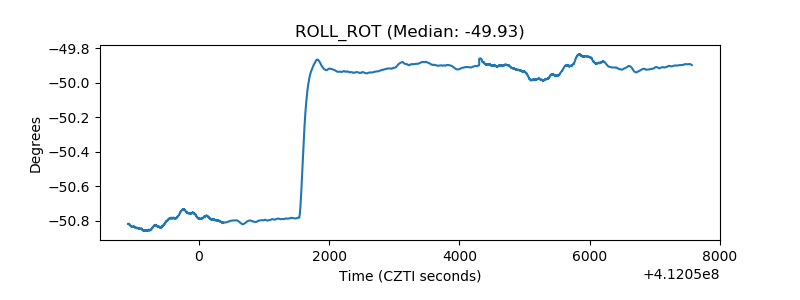 |
| _Roll_DEC | 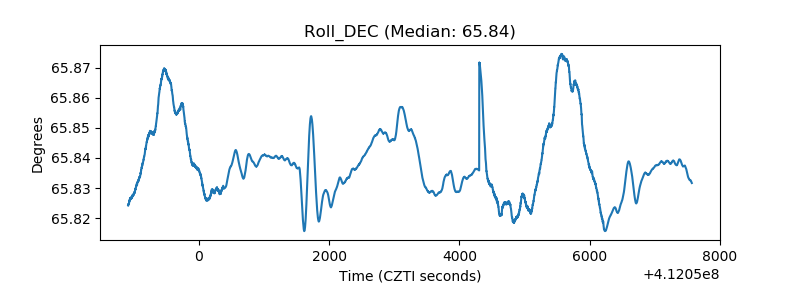 |
| _Roll_RA | 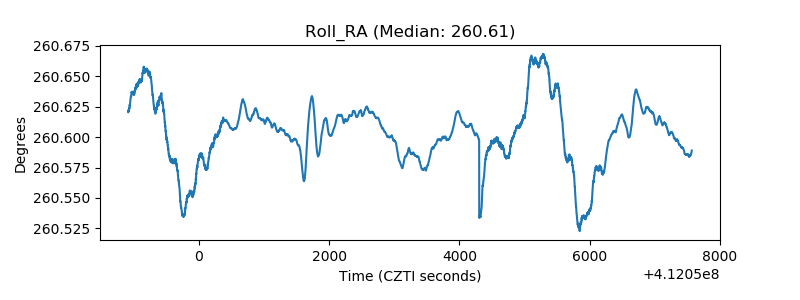 |
| Veto Counter | 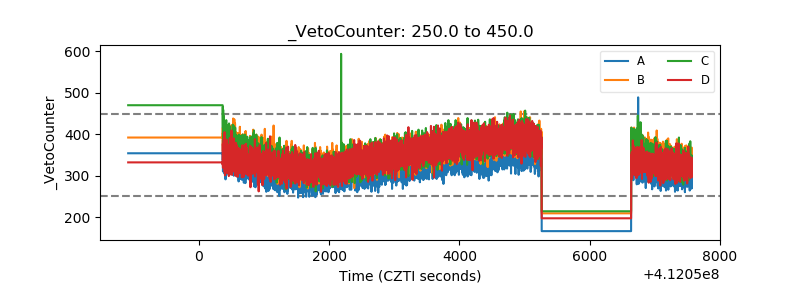 |