| Param | Original file | Final file |
|---|---|---|
| Filename | modeM0/AS1A12_018T01_9000005488_39568cztM0_level2.fits | modeM0/AS1A12_018T01_9000005488_39568cztM0_level2_quad_clean.evt |
| Size (bytes) | 700,269,120 | 79,931,520 |
| Size | 667.8 MB | 76.2 MB |
| Events in quadrant A | 5,580,833 | 605,157 |
| Events in quadrant B | 2,590,892 | 658,846 |
| Events in quadrant C | 11,066,252 | 265,961 |
| Events in quadrant D | 6,222,337 | 474,158 |
| Mode SS | |||
|---|---|---|---|
| Quadrant | BADHDUFLAG | Total packets | Discarded packets |
| A | 0 | 122 | 0 |
| B | 0 | 122 | 0 |
| C | 0 | 122 | 0 |
| D | 0 | 122 | 0 |
| Mode M0 | |||
|---|---|---|---|
| Quadrant | BADHDUFLAG | Total packets | Discarded packets |
| A | 0 | 20594 | 3 |
| B | 0 | 12212 | 2 |
| C | 0 | 36921 | 2 |
| D | 0 | 22867 | 2 |
| Mode M9 | |||
|---|---|---|---|
| Quadrant | BADHDUFLAG | Total packets | Discarded packets |
| A | 0 | 17 | 0 |
| B | 0 | 17 | 0 |
| C | 0 | 17 | 0 |
| D | 0 | 18 | 0 |
| Quadrant | Total seconds | Saturated seconds | Saturation percentage |
|---|---|---|---|
| A | 5949 | 341 | 5.732056% |
| B | 5949 | 7 | 0.117667% |
| C | 5949 | 3492 | 58.698941% |
| D | 5949 | 1211 | 20.356362% |
Noise dominated data is calculated using 1-second bins in cleaned event files. If a bin has >2000 counts, and if more than 50% of those come from <1% of pixels, then it is considered to be noise-dominated and hence unusable.
| Quadrant | # 1 sec bins | Bins with >0 counts | Bins with >2000 counts | High rate bins dominated by noise | Noise dominated (total time) | Noise dominated (detector-on time) | Marked lightcurve |
|---|---|---|---|---|---|---|---|
| A | 7232 | 5950 | 323 | 323 | 4.47% | 5.43% | 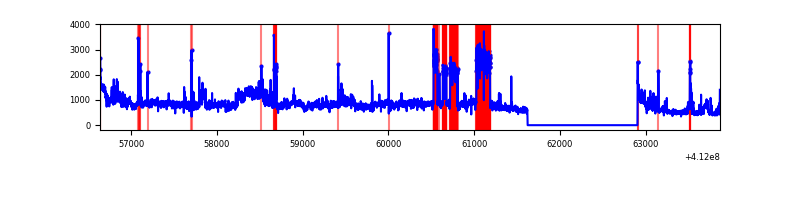 |
| B | 7232 | 5950 | 2 | 2 | 0.03% | 0.03% | 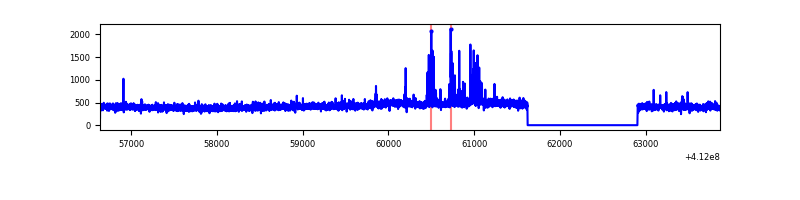 |
| C | 7232 | 5950 | 3334 | 3334 | 46.10% | 56.03% | 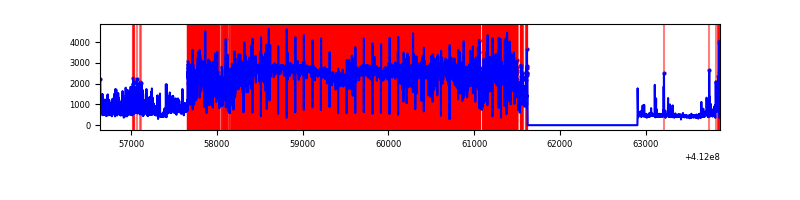 |
| D | 7232 | 5950 | 1051 | 1051 | 14.53% | 17.66% | 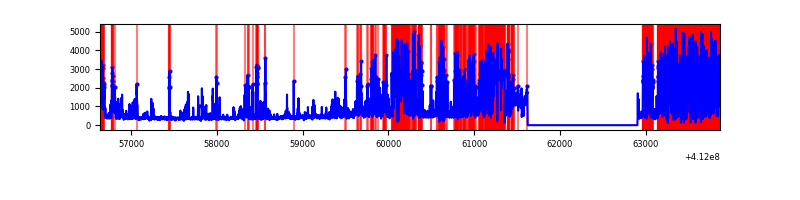 |
Top three noisy pixels from each quadrant. If the there are fewer than three noisy pixels in the level2.evt file, extra rows are filled as -1
| Pixel properties | Quadrant properties | ||||||
|---|---|---|---|---|---|---|---|
| Quadrant | DetID | PixID | Counts | Sigma | Mean | Median | Sigma |
| A | 15 | 222 | 2616786 | 21087.72 | 609 | 597 | 124.1 |
| A | 10 | 83 | 462816 | 3725.7 | 609 | 597 | 124.1 |
| A | 9 | 143 | 53370 | 425.38 | 609 | 597 | 124.1 |
| B | 5 | 255 | 106934 | 874.35 | 624 | 607 | 121.6 |
| B | 15 | 35 | 16996 | 134.77 | 624 | 607 | 121.6 |
| B | 12 | 111 | 15385 | 121.52 | 624 | 607 | 121.6 |
| C | 9 | 187 | 7668870 | 85924.61 | 377 | 378 | 89.2 |
| C | 15 | 208 | 1673483 | 18746.95 | 377 | 378 | 89.2 |
| C | 15 | 214 | 165893 | 1854.57 | 377 | 378 | 89.2 |
| D | 12 | 227 | 3824599 | 28865.29 | 543 | 526 | 132.5 |
| D | 12 | 233 | 143082 | 1076.06 | 543 | 526 | 132.5 |
| D | 1 | 52 | 49406 | 368.96 | 543 | 526 | 132.5 |
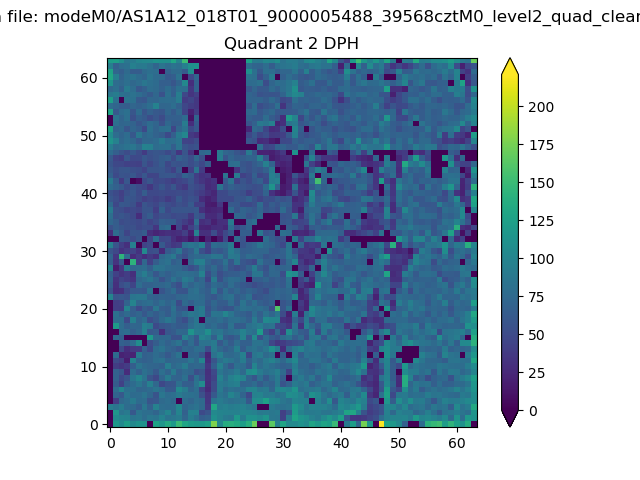
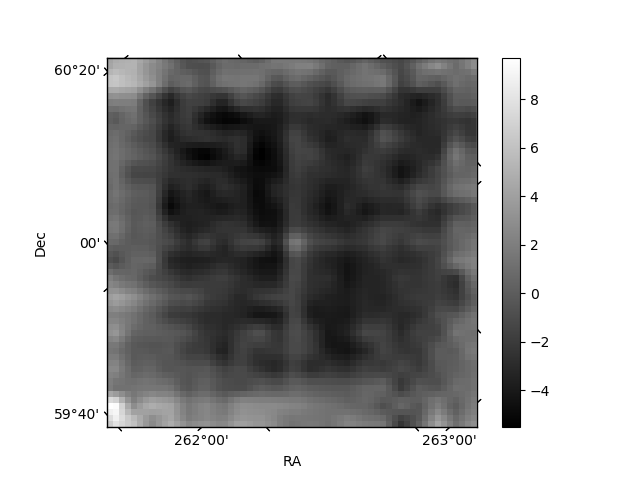
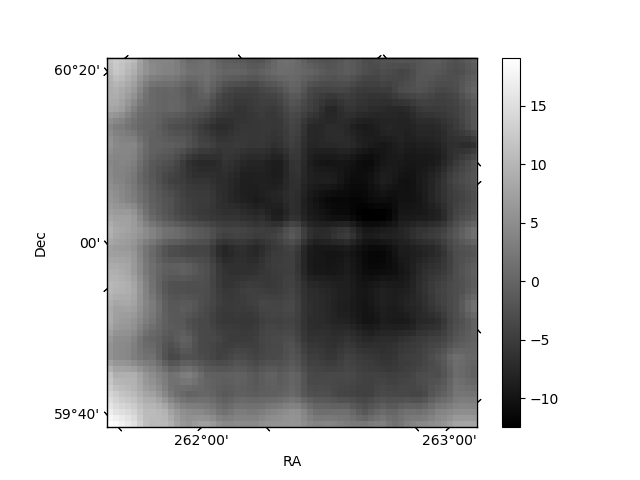
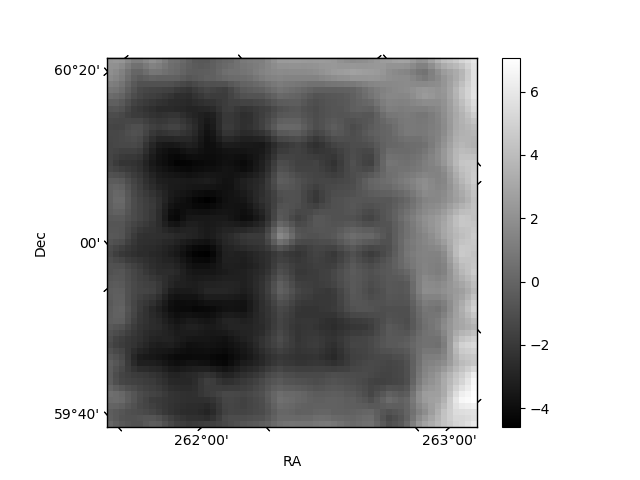
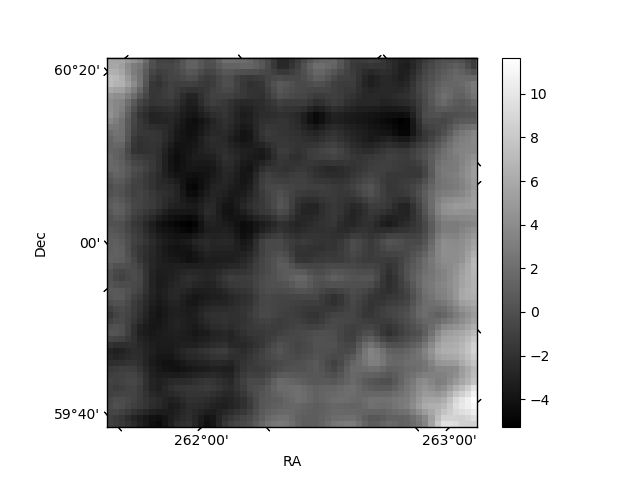
Histogram calculated using DETX and DETY for each event in the final _common_clean file
| Quadrant A | 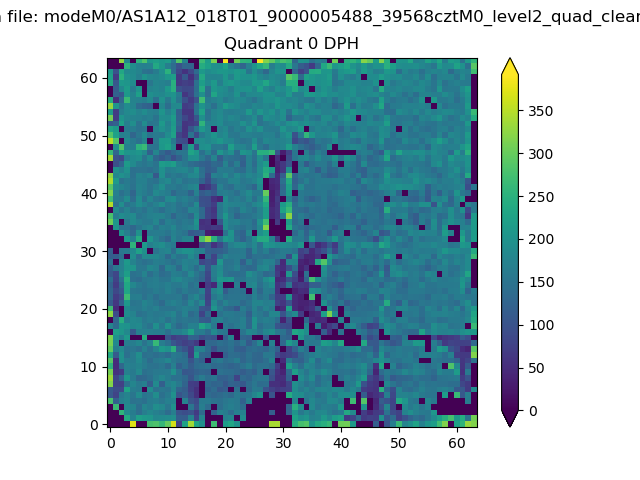 |
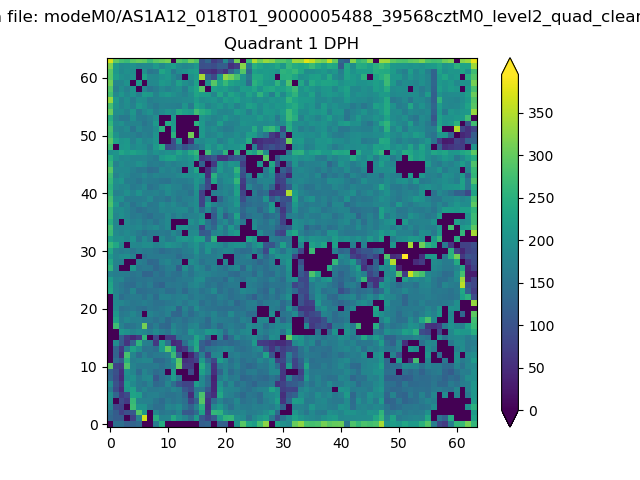 |
Quadrant B |
|---|---|---|---|
| Quadrant D | 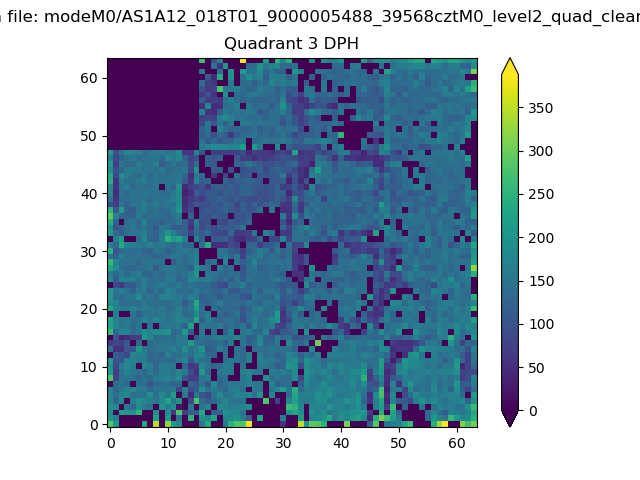 |
 |
Quadrant C |
| Plot type | Count rate plots | Images |
|---|---|---|
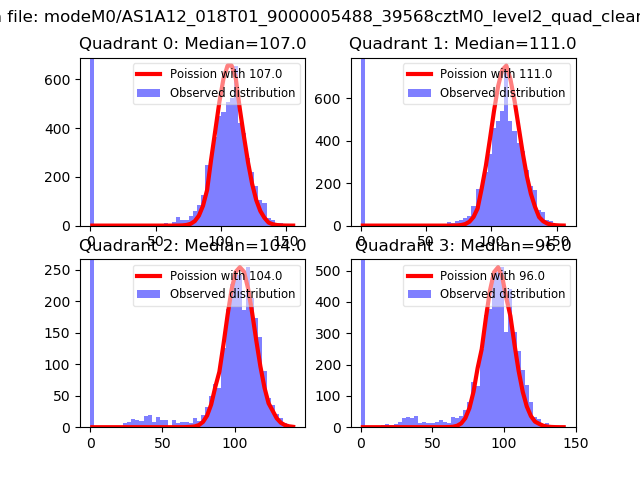
| Comparison with Poisson distribution Blue bars denote a histogram of data divided into 1 sec bins. Red curve is a Poisson curve with rate = median count rate of data. |
 |
 |
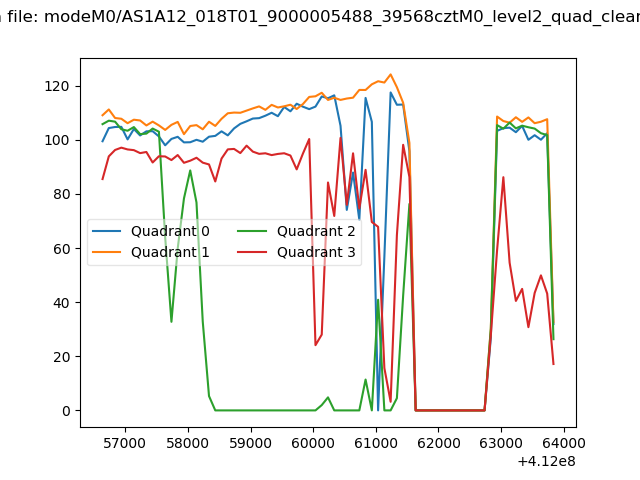
| Quadrant-wise count rates Data is divided into 100 sec bins |
 |
|
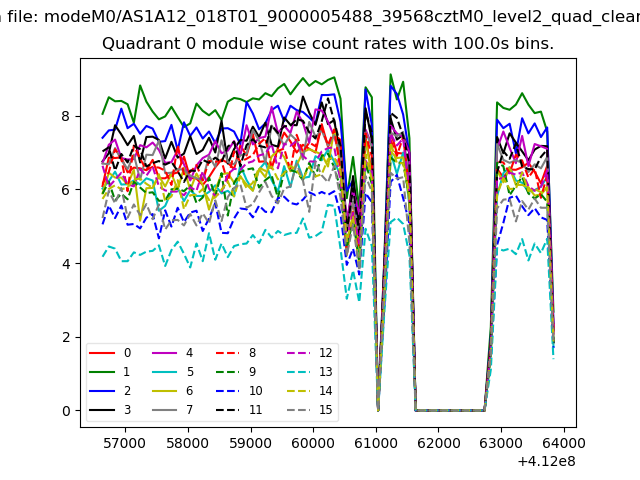
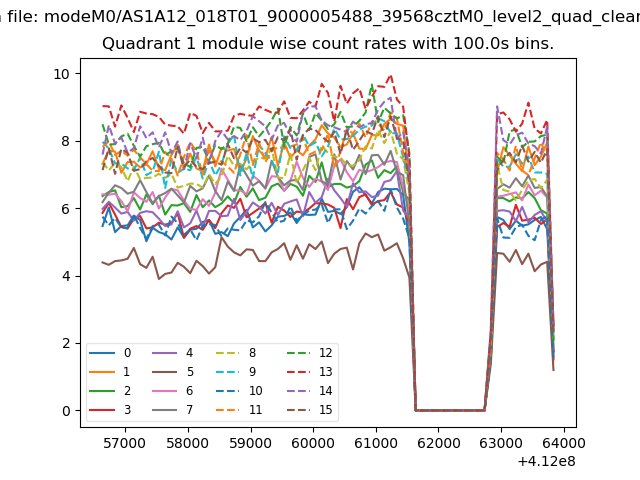
| Module-wise count rates for Quadrant A Data is divided into 100 sec bins |
 |
 |
| Module-wise count rates for Quadrant B Data is divided into 100 sec bins |
 |
 |
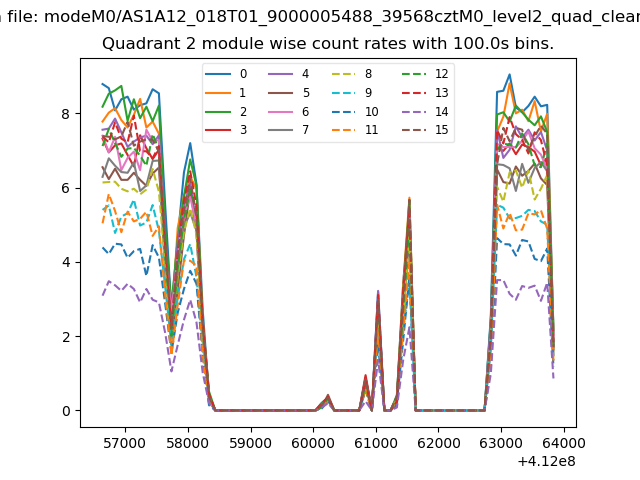
| Module-wise count rates for Quadrant C Data is divided into 100 sec bins |
 |
 |
| Module-wise count rates for Quadrant D Data is divided into 100 sec bins |
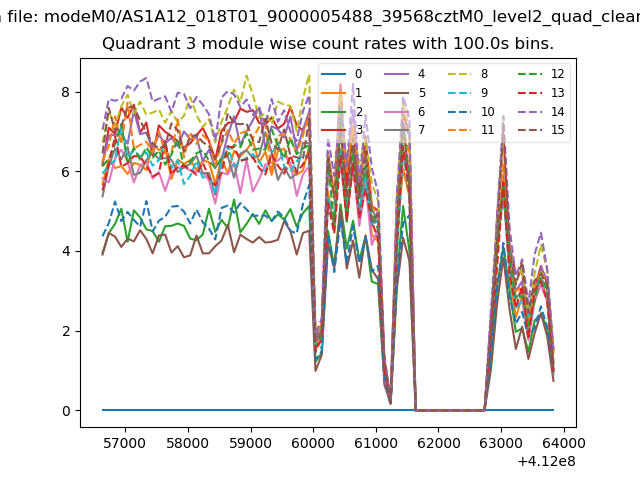 |
 |
| Parameter | Plot |
|---|---|
| CZT HV Monitor | 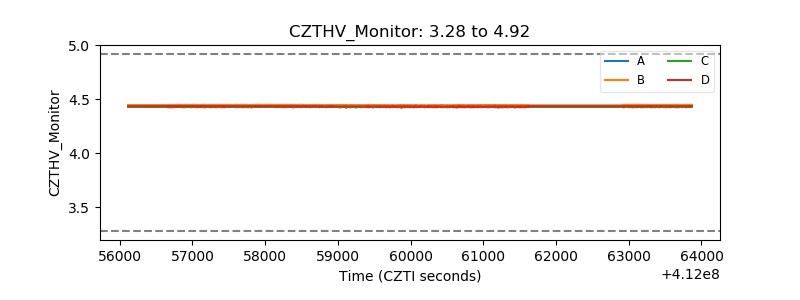 |
| D_VDD | 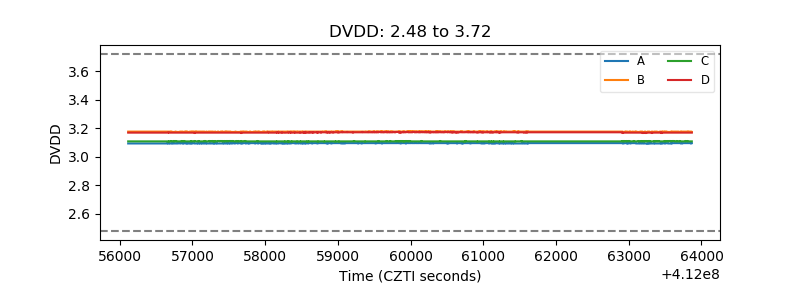 |
| Temperature 1 | 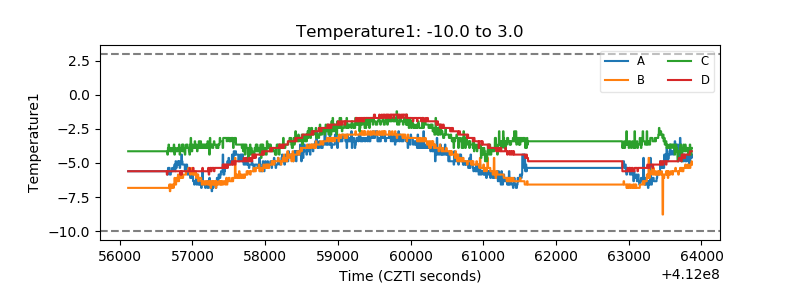 |
| Veto HV Monitor | 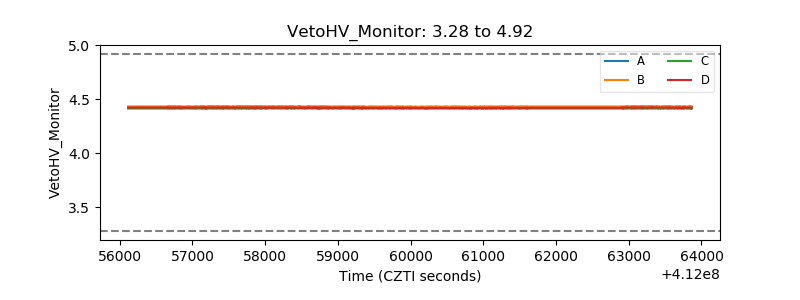 |
| Veto LLD | 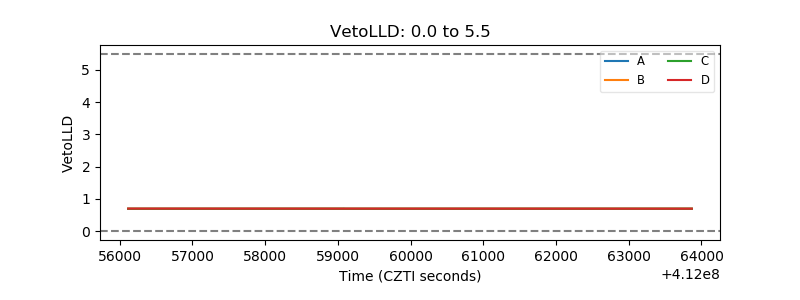 |
| Alpha Counter | 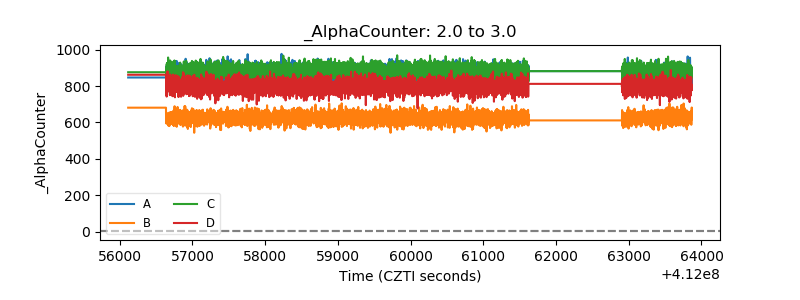 |
| _CPM_Rate | 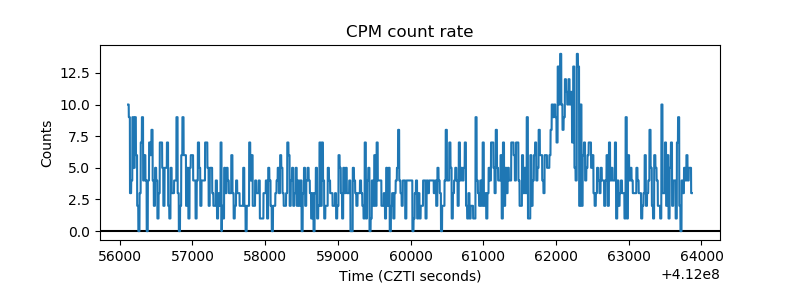 |
| CZT Counter | 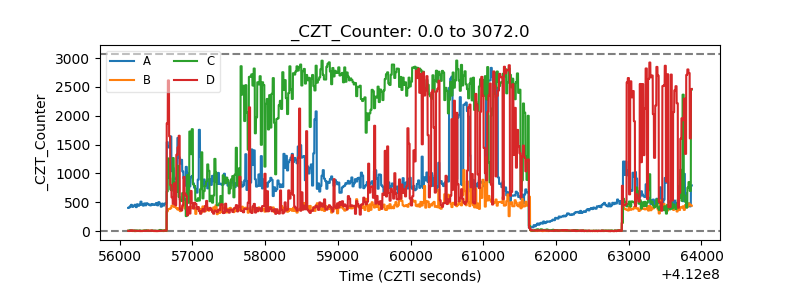 |
| +2.5 Volts monitor |  |
| +5 Volts monitor |  |
| _ROLL_ROT |  |
| _Roll_DEC |  |
| _Roll_RA |  |
| Veto Counter | 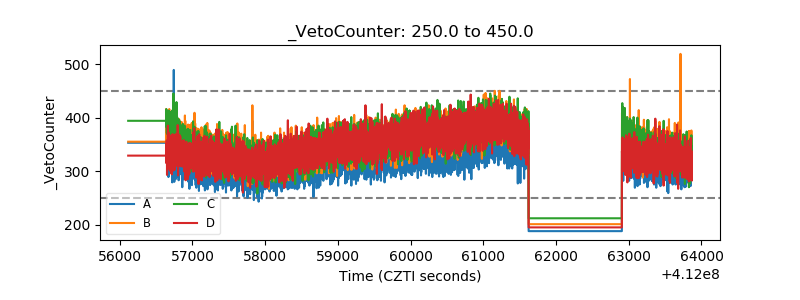 |