| Param | Original file | Final file |
|---|---|---|
| Filename | modeM0/AS1A12_018T01_9000005488_39571cztM0_level2.fits | modeM0/AS1A12_018T01_9000005488_39571cztM0_level2_quad_clean.evt |
| Size (bytes) | 1,490,371,200 | 225,446,400 |
| Size | 1.4 GB | 215.0 MB |
| Events in quadrant A | 11,030,824 | 1,623,292 |
| Events in quadrant B | 6,945,386 | 1,708,220 |
| Events in quadrant C | 22,870,733 | 1,161,433 |
| Events in quadrant D | 13,132,426 | 1,269,466 |
| Mode SS | |||
|---|---|---|---|
| Quadrant | BADHDUFLAG | Total packets | Discarded packets |
| A | 0 | 314 | 0 |
| B | 0 | 314 | 0 |
| C | 0 | 314 | 0 |
| D | 0 | 314 | 0 |
| Mode M0 | |||
|---|---|---|---|
| Quadrant | BADHDUFLAG | Total packets | Discarded packets |
| A | 0 | 43087 | 3 |
| B | 0 | 31985 | 2 |
| C | 0 | 78502 | 2 |
| D | 0 | 49924 | 2 |
| Mode M9 | |||
|---|---|---|---|
| Quadrant | BADHDUFLAG | Total packets | Discarded packets |
| A | 0 | 43 | 0 |
| B | 0 | 43 | 0 |
| C | 0 | 43 | 0 |
| D | 0 | 43 | 0 |
| Quadrant | Total seconds | Saturated seconds | Saturation percentage |
|---|---|---|---|
| A | 15404 | 323 | 2.096858% |
| B | 15404 | 81 | 0.525837% |
| C | 15404 | 4746 | 30.810179% |
| D | 15404 | 2147 | 13.937938% |
Noise dominated data is calculated using 1-second bins in cleaned event files. If a bin has >2000 counts, and if more than 50% of those come from <1% of pixels, then it is considered to be noise-dominated and hence unusable.
| Quadrant | # 1 sec bins | Bins with >0 counts | Bins with >2000 counts | High rate bins dominated by noise | Noise dominated (total time) | Noise dominated (detector-on time) | Marked lightcurve |
|---|---|---|---|---|---|---|---|
| A | 19640 | 15407 | 280 | 280 | 1.43% | 1.82% | 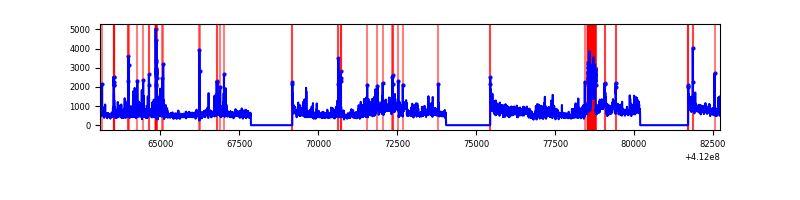 |
| B | 19640 | 15407 | 51 | 51 | 0.26% | 0.33% | 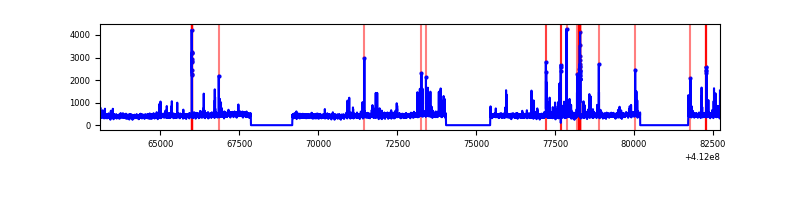 |
| C | 19640 | 15407 | 4348 | 4348 | 22.14% | 28.22% | 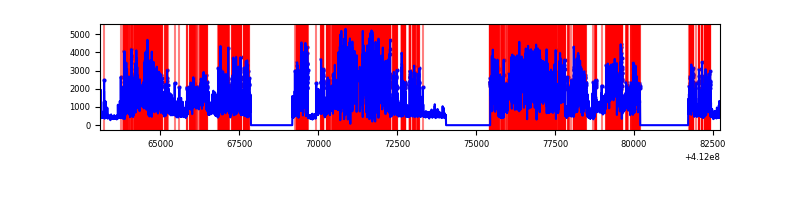 |
| D | 19640 | 15407 | 1778 | 1778 | 9.05% | 11.54% | 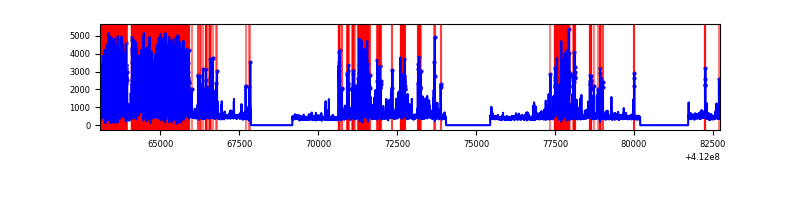 |
Top three noisy pixels from each quadrant. If the there are fewer than three noisy pixels in the level2.evt file, extra rows are filled as -1
| Pixel properties | Quadrant properties | ||||||
|---|---|---|---|---|---|---|---|
| Quadrant | DetID | PixID | Counts | Sigma | Mean | Median | Sigma |
| A | 15 | 222 | 3170231 | 9562.93 | 1635 | 1600 | 331.3 |
| A | 10 | 83 | 1061476 | 3198.71 | 1635 | 1600 | 331.3 |
| A | 13 | 248 | 272716 | 818.23 | 1635 | 1600 | 331.3 |
| B | 5 | 172 | 269373 | 853.04 | 1637 | 1589 | 313.9 |
| B | 5 | 255 | 165902 | 523.42 | 1637 | 1589 | 313.9 |
| B | 12 | 111 | 40266 | 123.21 | 1637 | 1589 | 313.9 |
| C | 9 | 187 | 14308939 | 44862.91 | 1380 | 1388 | 318.9 |
| C | 15 | 208 | 2208355 | 6920.19 | 1380 | 1388 | 318.9 |
| C | 15 | 214 | 547317 | 1711.82 | 1380 | 1388 | 318.9 |
| D | 12 | 227 | 6073516 | 16436.02 | 1515 | 1471 | 369.4 |
| D | 12 | 233 | 611143 | 1650.28 | 1515 | 1471 | 369.4 |
| D | 13 | 249 | 165323 | 443.52 | 1515 | 1471 | 369.4 |
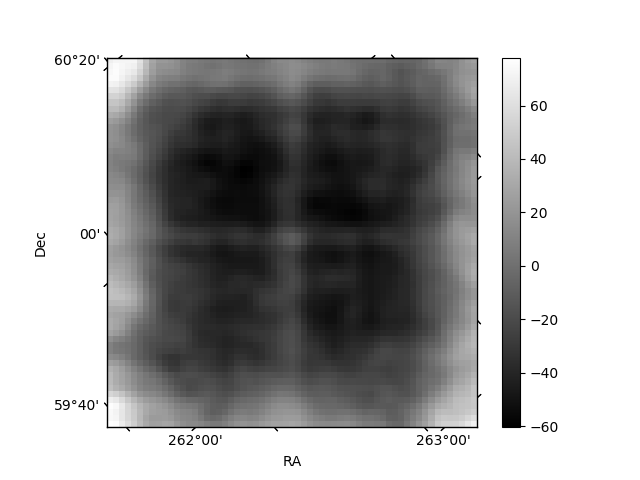
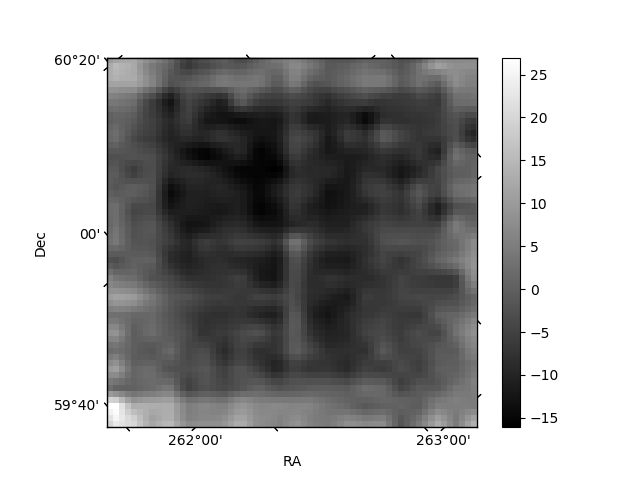
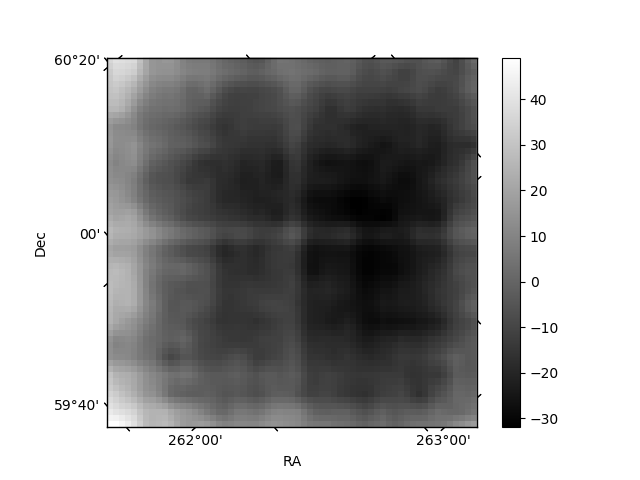
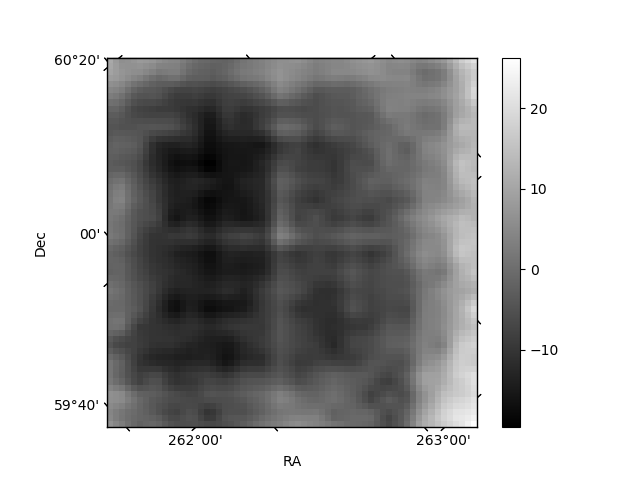
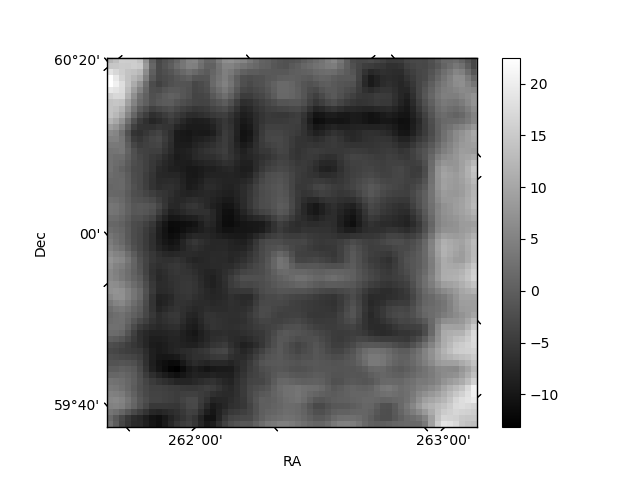
Histogram calculated using DETX and DETY for each event in the final _common_clean file
| Quadrant A | 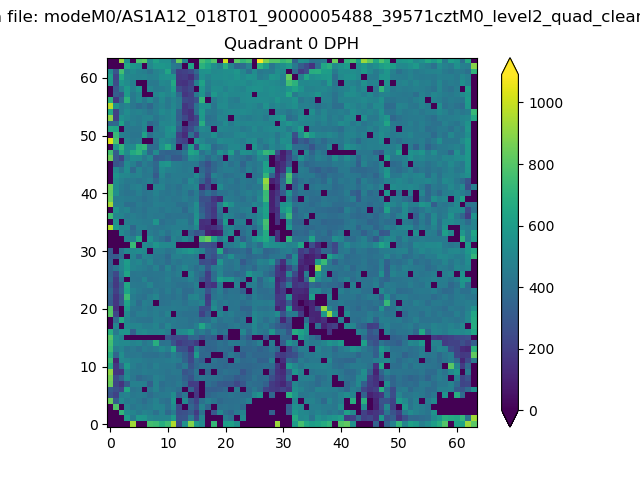 |
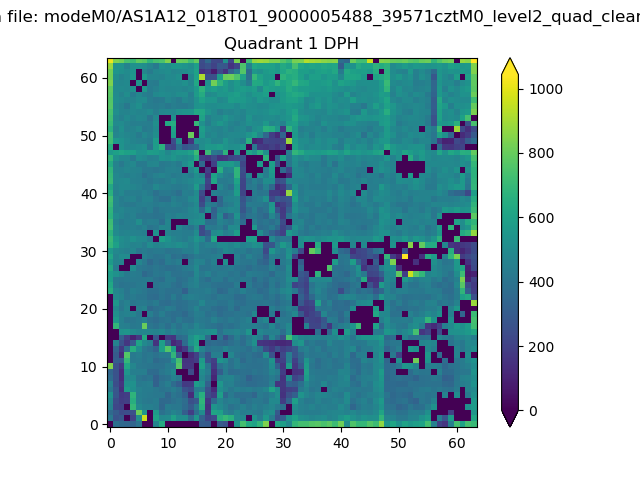 |
Quadrant B |
|---|---|---|---|
| Quadrant D | 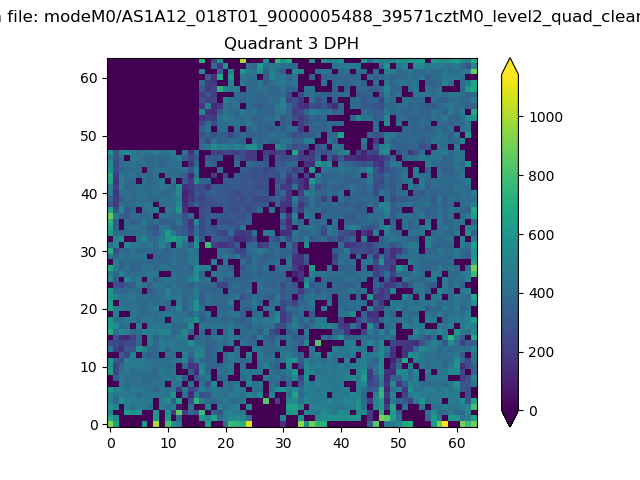 |
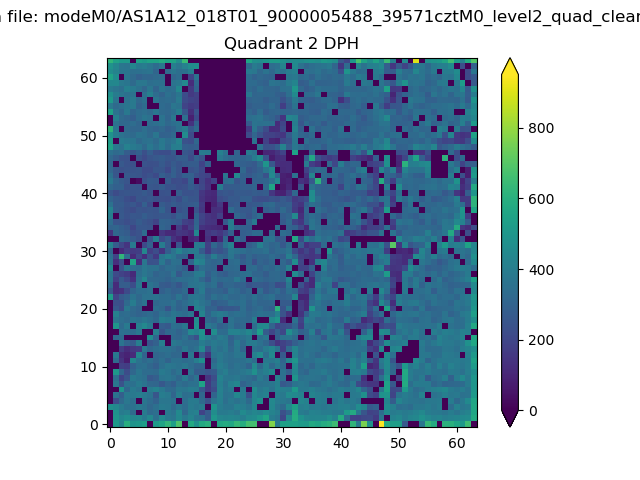 |
Quadrant C |
| Plot type | Count rate plots | Images |
|---|---|---|
| Comparison with Poisson distribution Blue bars denote a histogram of data divided into 1 sec bins. Red curve is a Poisson curve with rate = median count rate of data. |
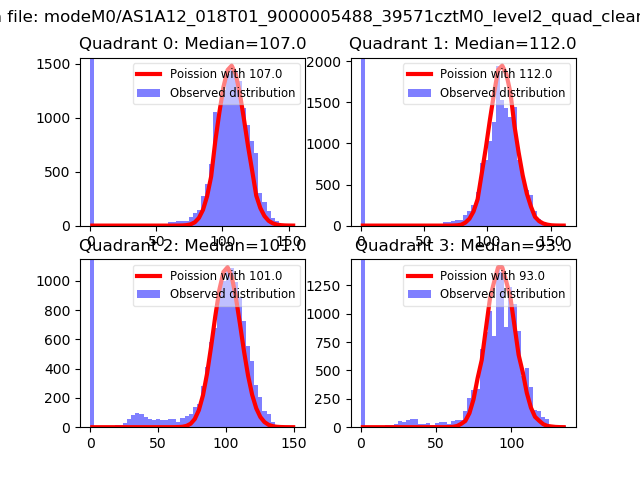 |
 |
| Quadrant-wise count rates Data is divided into 100 sec bins |
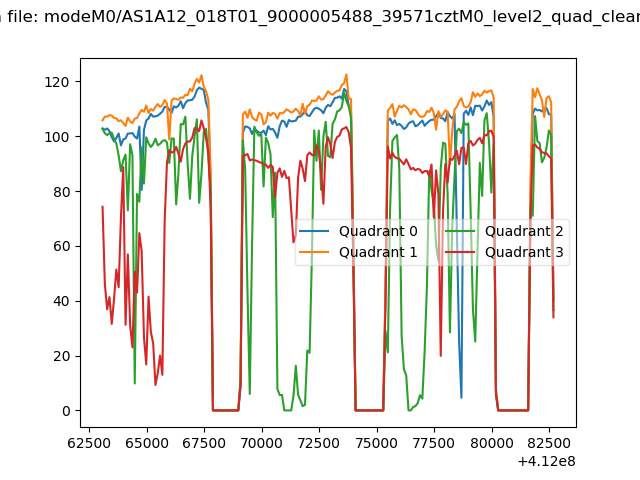 |
|
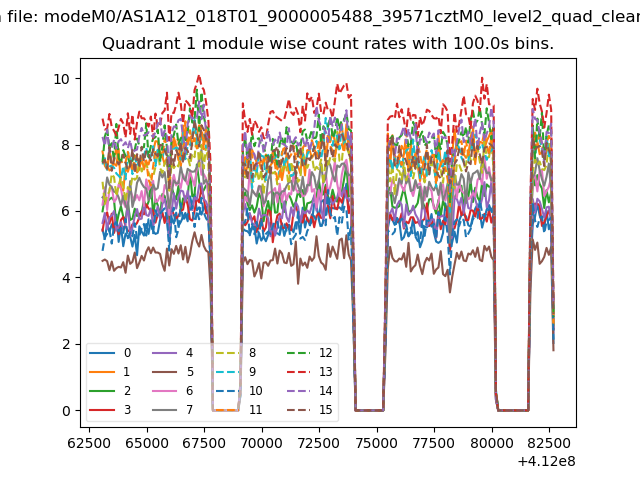
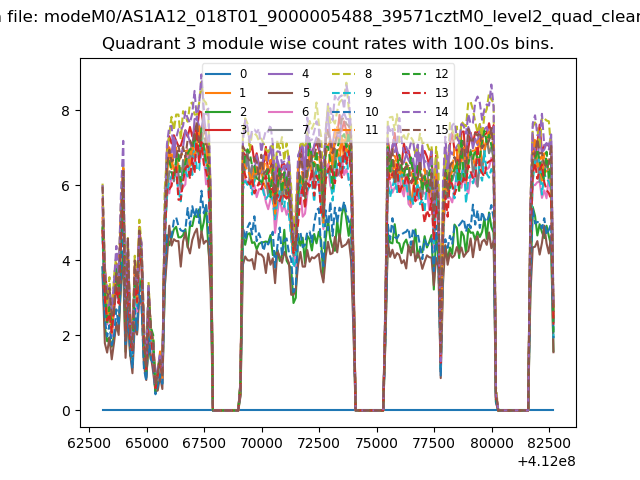
| Module-wise count rates for Quadrant A Data is divided into 100 sec bins |
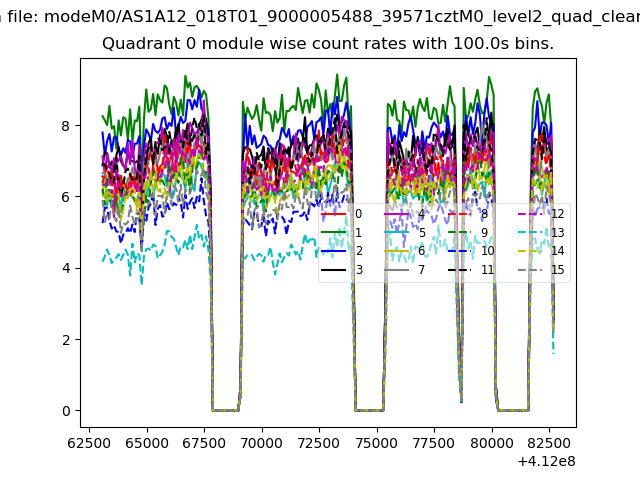 |
 |
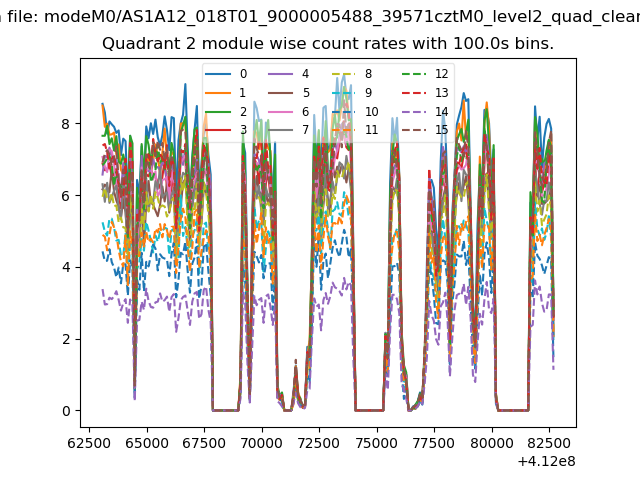
| Module-wise count rates for Quadrant B Data is divided into 100 sec bins |
 |
 |
| Module-wise count rates for Quadrant C Data is divided into 100 sec bins |
 |
 |
| Module-wise count rates for Quadrant D Data is divided into 100 sec bins |
 |
 |
| Parameter | Plot |
|---|---|
| CZT HV Monitor | 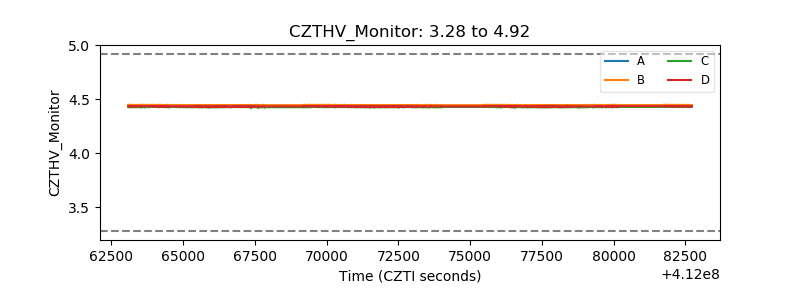 |
| D_VDD | 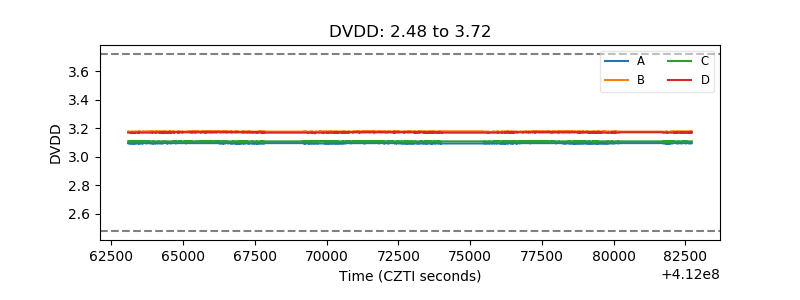 |
| Temperature 1 | 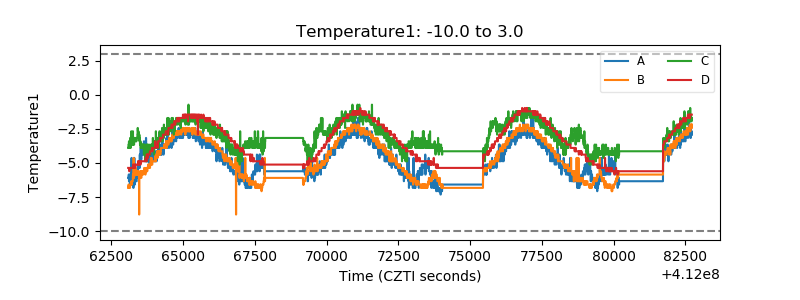 |
| Veto HV Monitor | 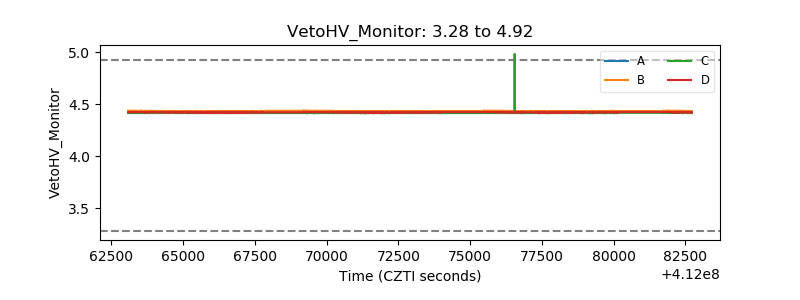 |
| Veto LLD | 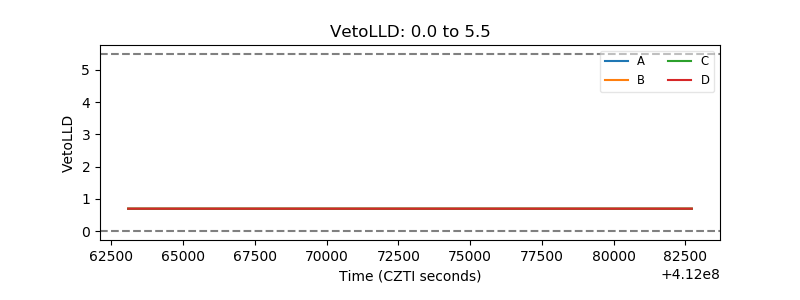 |
| Alpha Counter | 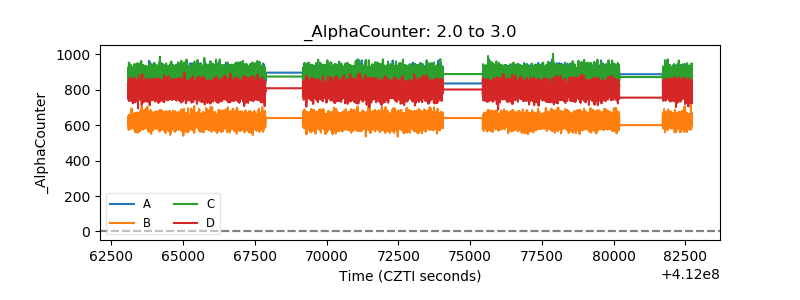 |
| _CPM_Rate | 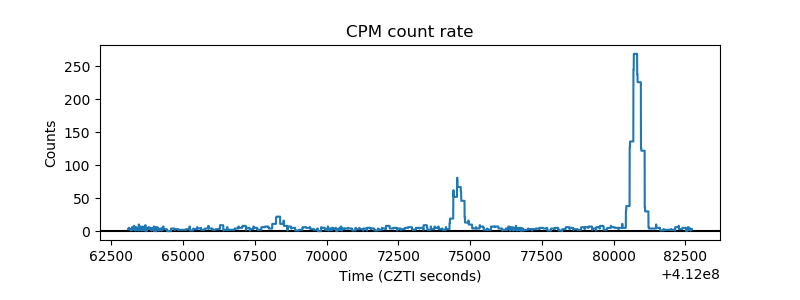 |
| CZT Counter | 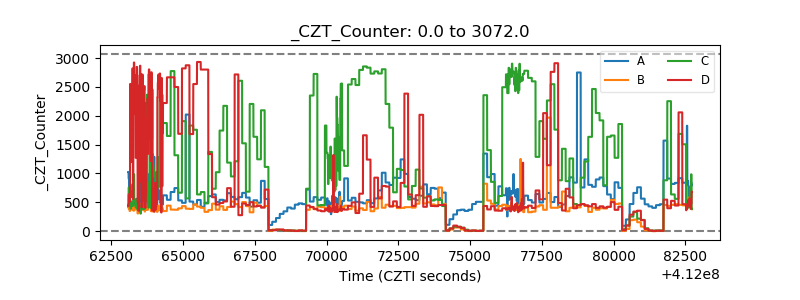 |
| +2.5 Volts monitor | 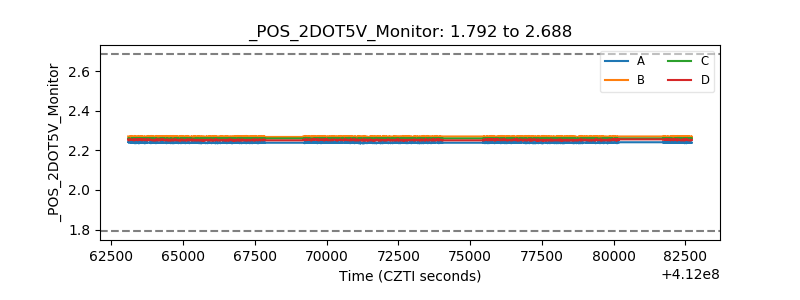 |
| +5 Volts monitor | 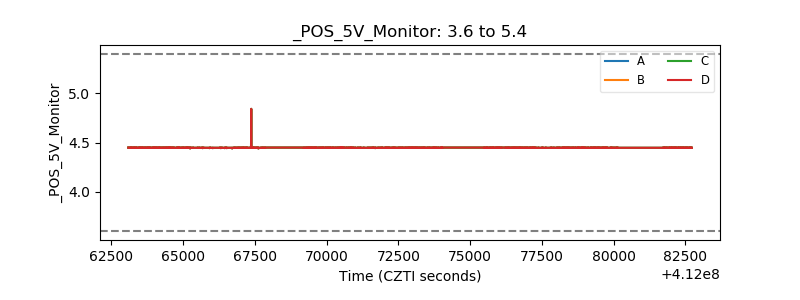 |
| _ROLL_ROT | 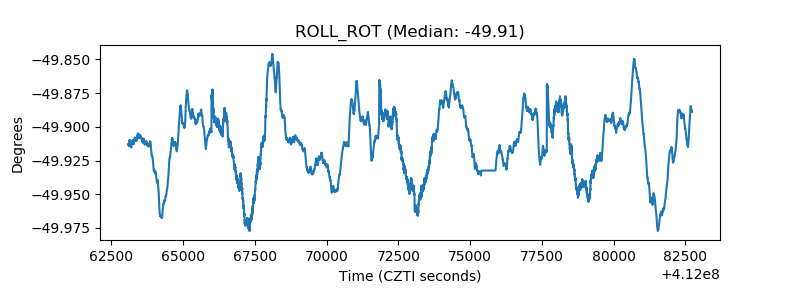 |
| _Roll_DEC | 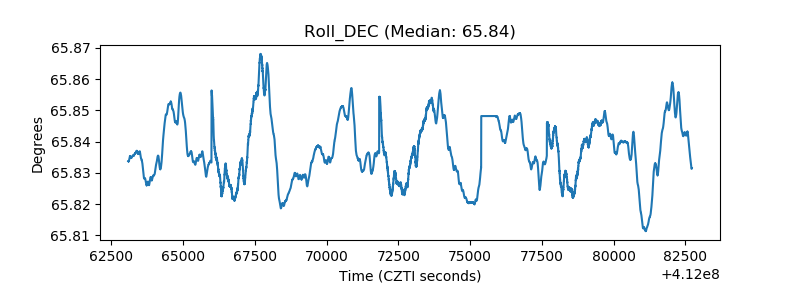 |
| _Roll_RA | 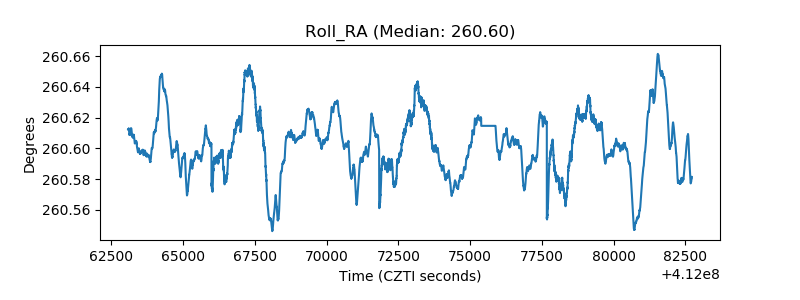 |
| Veto Counter | 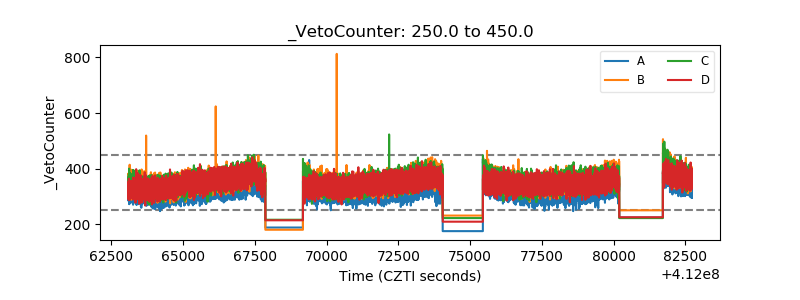 |