| Param | Original file | Final file |
|---|---|---|
| Filename | modeM0/AS1A12_018T01_9000005488_39572cztM0_level2.fits | modeM0/AS1A12_018T01_9000005488_39572cztM0_level2_quad_clean.evt |
| Size (bytes) | 391,628,160 | 86,417,280 |
| Size | 373.5 MB | 82.4 MB |
| Events in quadrant A | 3,903,925 | 591,712 |
| Events in quadrant B | 2,334,242 | 605,766 |
| Events in quadrant C | 5,230,497 | 517,528 |
| Events in quadrant D | 2,614,495 | 528,456 |
| Mode SS | |||
|---|---|---|---|
| Quadrant | BADHDUFLAG | Total packets | Discarded packets |
| A | 0 | 110 | 0 |
| B | 0 | 110 | 0 |
| C | 0 | 110 | 0 |
| D | 0 | 110 | 0 |
| Mode M0 | |||
|---|---|---|---|
| Quadrant | BADHDUFLAG | Total packets | Discarded packets |
| A | 0 | 15308 | 2 |
| B | 0 | 10855 | 1 |
| C | 0 | 19121 | 1 |
| D | 0 | 11571 | 1 |
| Mode M9 | |||
|---|---|---|---|
| Quadrant | BADHDUFLAG | Total packets | Discarded packets |
| A | 0 | 16 | 0 |
| B | 0 | 16 | 0 |
| C | 0 | 16 | 0 |
| D | 0 | 16 | 0 |
| Quadrant | Total seconds | Saturated seconds | Saturation percentage |
|---|---|---|---|
| A | 5320 | 46 | 0.864662% |
| B | 5320 | 17 | 0.319549% |
| C | 5320 | 611 | 11.484962% |
| D | 5320 | 36 | 0.676692% |
Noise dominated data is calculated using 1-second bins in cleaned event files. If a bin has >2000 counts, and if more than 50% of those come from <1% of pixels, then it is considered to be noise-dominated and hence unusable.
| Quadrant | # 1 sec bins | Bins with >0 counts | Bins with >2000 counts | High rate bins dominated by noise | Noise dominated (total time) | Noise dominated (detector-on time) | Marked lightcurve |
|---|---|---|---|---|---|---|---|
| A | 6961 | 5321 | 35 | 35 | 0.50% | 0.66% | 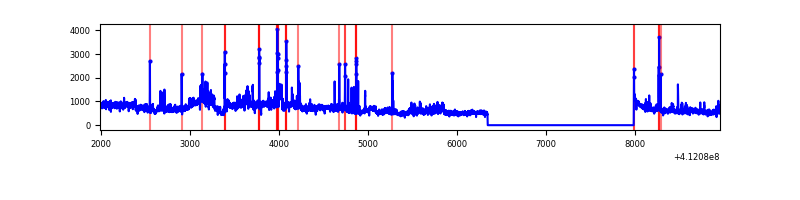 |
| B | 6961 | 5321 | 10 | 10 | 0.14% | 0.19% | 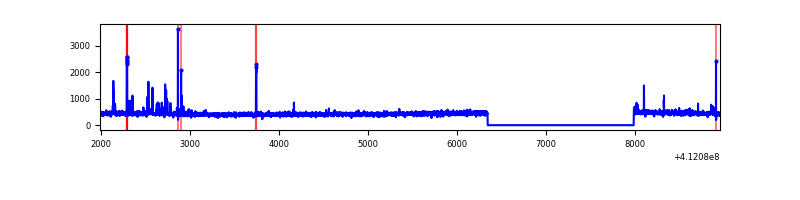 |
| C | 6961 | 5321 | 553 | 553 | 7.94% | 10.39% | 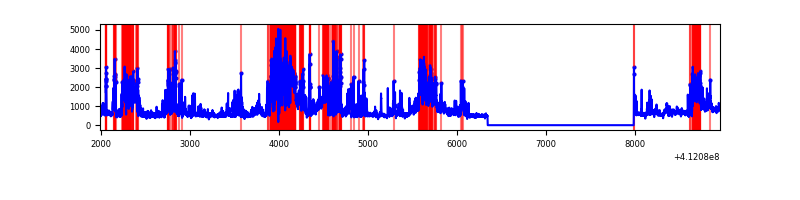 |
| D | 6961 | 5321 | 28 | 28 | 0.40% | 0.53% | 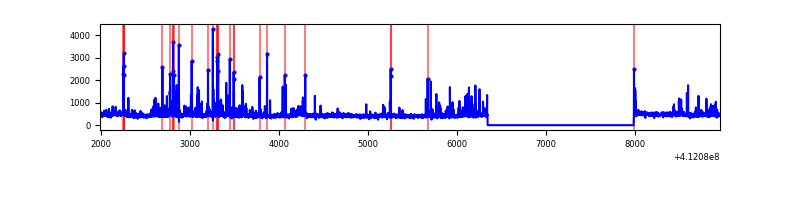 |
Top three noisy pixels from each quadrant. If the there are fewer than three noisy pixels in the level2.evt file, extra rows are filled as -1
| Pixel properties | Quadrant properties | ||||||
|---|---|---|---|---|---|---|---|
| Quadrant | DetID | PixID | Counts | Sigma | Mean | Median | Sigma |
| A | 15 | 222 | 1131568 | 9491.14 | 576 | 562 | 119.2 |
| A | 10 | 83 | 374947 | 3141.75 | 576 | 562 | 119.2 |
| A | 2 | 79 | 53699 | 445.91 | 576 | 562 | 119.2 |
| B | 5 | 172 | 56449 | 504.63 | 571 | 555 | 110.8 |
| B | 5 | 255 | 16281 | 141.98 | 571 | 555 | 110.8 |
| B | 12 | 111 | 13896 | 120.45 | 571 | 555 | 110.8 |
| C | 9 | 187 | 2293798 | 18128.36 | 541 | 544 | 126.5 |
| C | 15 | 208 | 436387 | 3445.37 | 541 | 544 | 126.5 |
| C | 15 | 214 | 209059 | 1648.33 | 541 | 544 | 126.5 |
| D | 12 | 233 | 117859 | 850.7 | 564 | 547 | 137.9 |
| D | 1 | 52 | 93990 | 677.61 | 564 | 547 | 137.9 |
| D | 12 | 227 | 70334 | 506.06 | 564 | 547 | 137.9 |
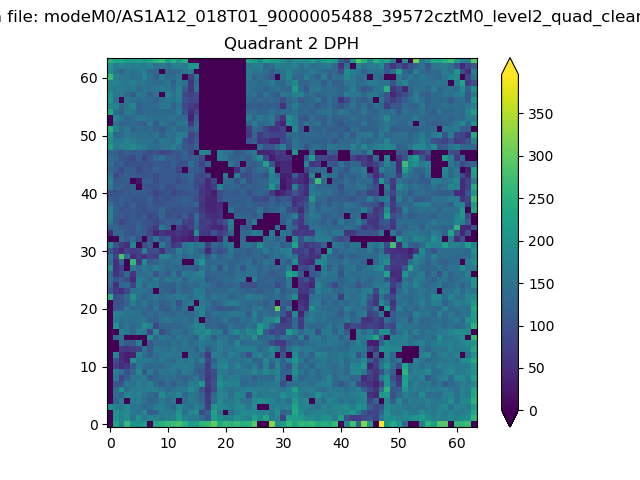
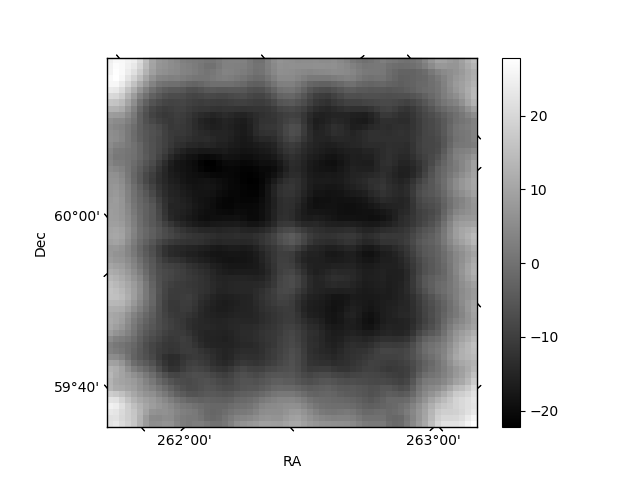
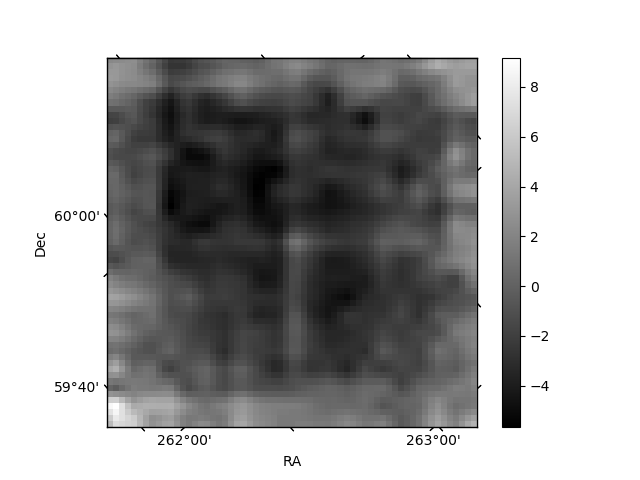
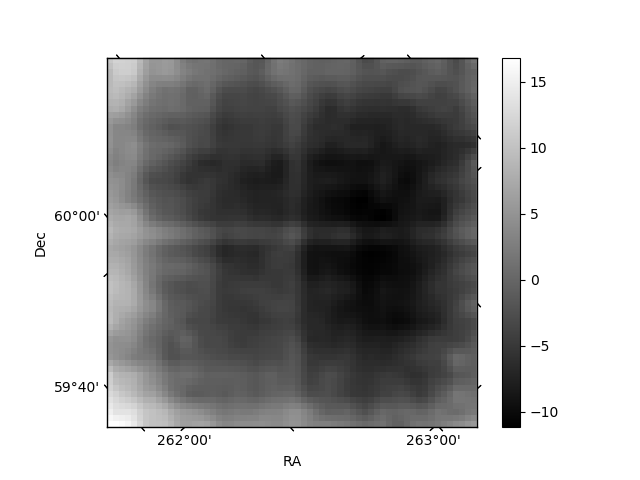
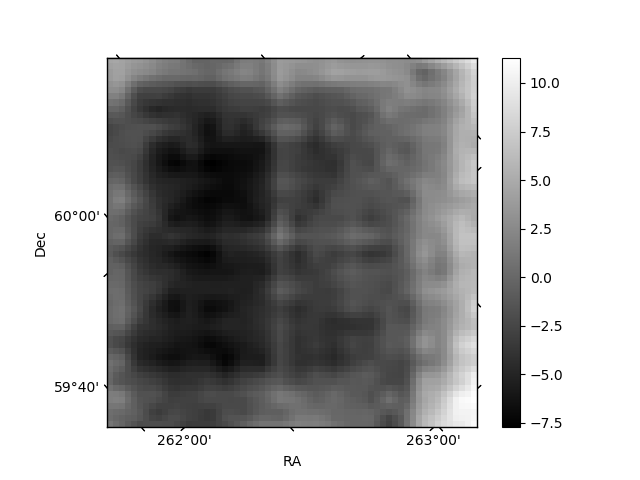
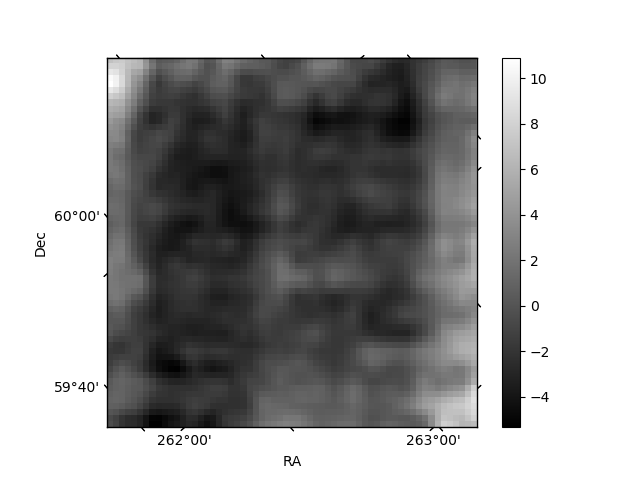
Histogram calculated using DETX and DETY for each event in the final _common_clean file
| Quadrant A | 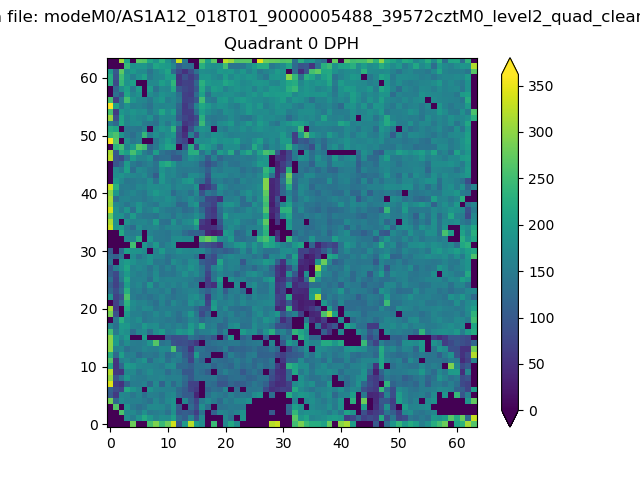 |
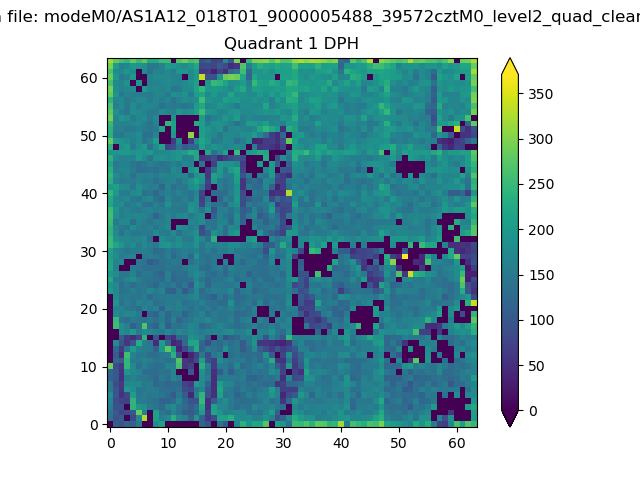 |
Quadrant B |
|---|---|---|---|
| Quadrant D | 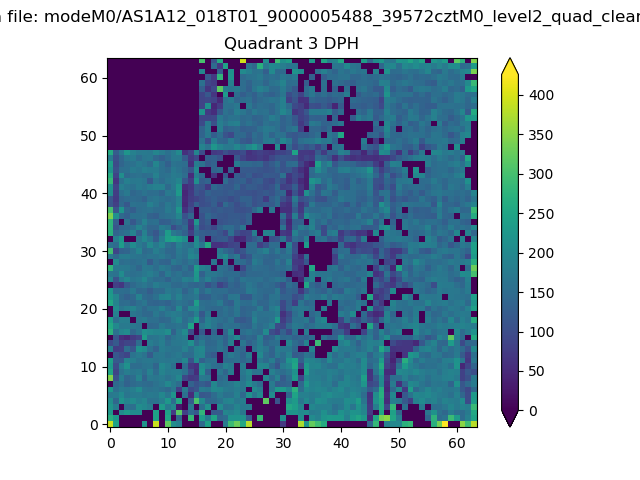 |
 |
Quadrant C |
| Plot type | Count rate plots | Images |
|---|---|---|
| Comparison with Poisson distribution Blue bars denote a histogram of data divided into 1 sec bins. Red curve is a Poisson curve with rate = median count rate of data. |
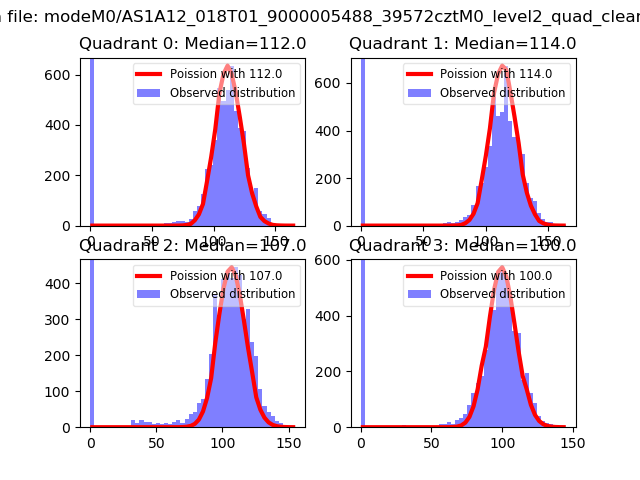 |
 |
| Quadrant-wise count rates Data is divided into 100 sec bins |
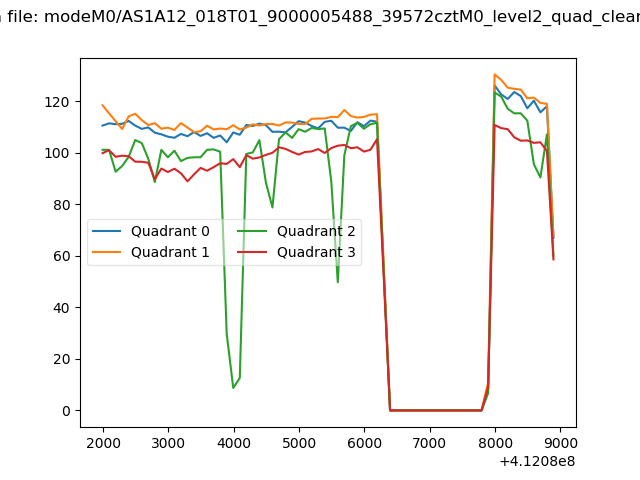 |
|
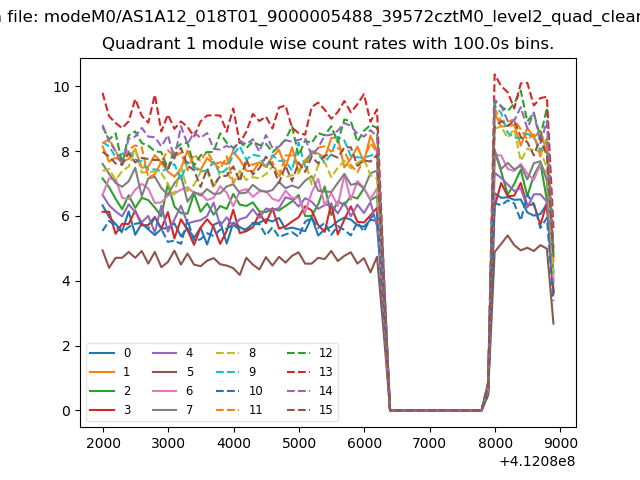
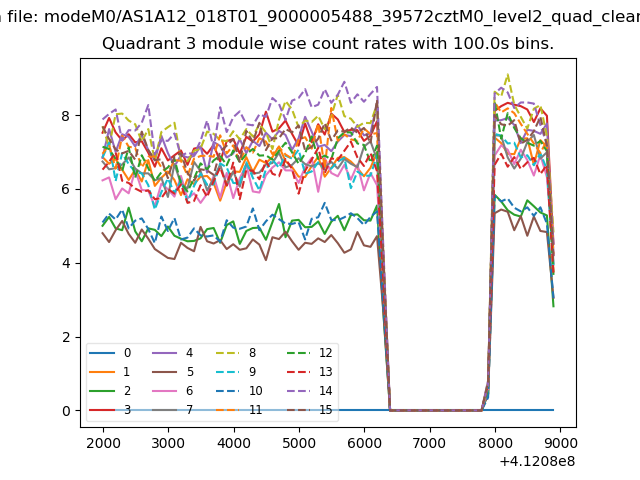
| Module-wise count rates for Quadrant A Data is divided into 100 sec bins |
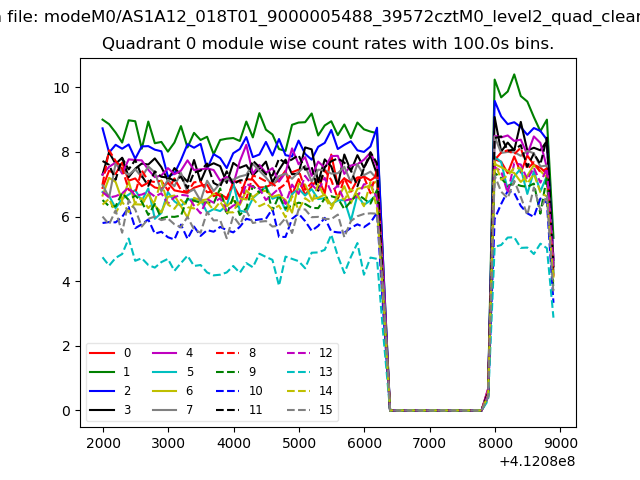 |
 |
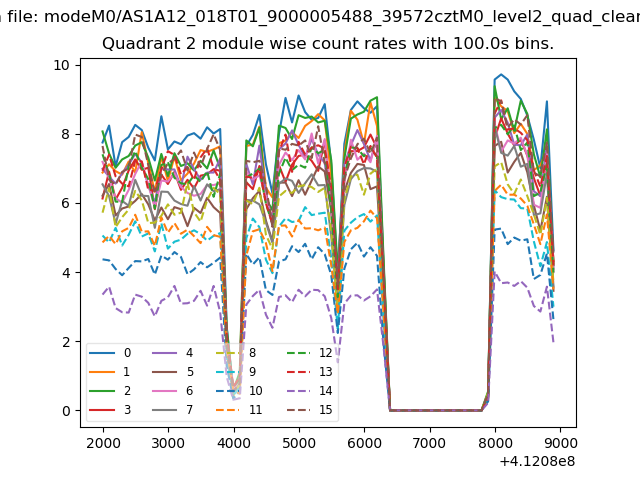
| Module-wise count rates for Quadrant B Data is divided into 100 sec bins |
 |
 |
| Module-wise count rates for Quadrant C Data is divided into 100 sec bins |
 |
 |
| Module-wise count rates for Quadrant D Data is divided into 100 sec bins |
 |
 |
| Parameter | Plot |
|---|---|
| CZT HV Monitor | 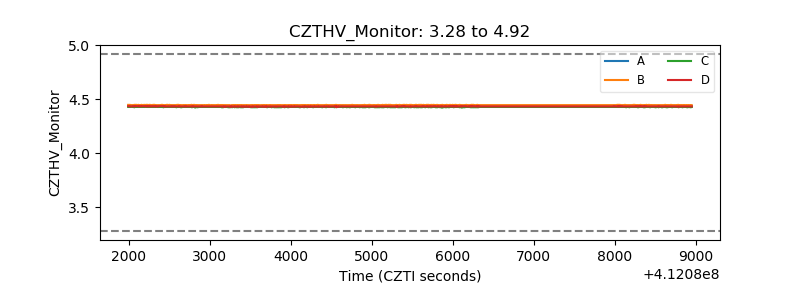 |
| D_VDD | 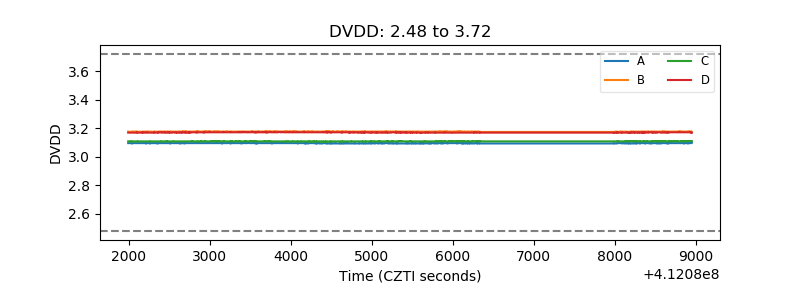 |
| Temperature 1 | 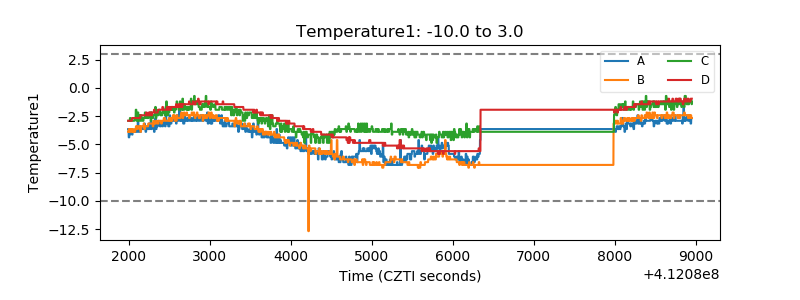 |
| Veto HV Monitor | 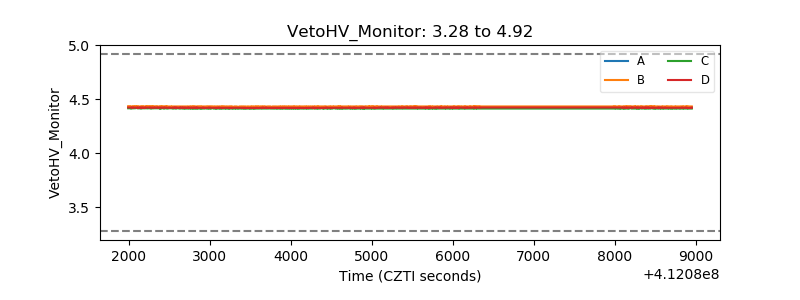 |
| Veto LLD | 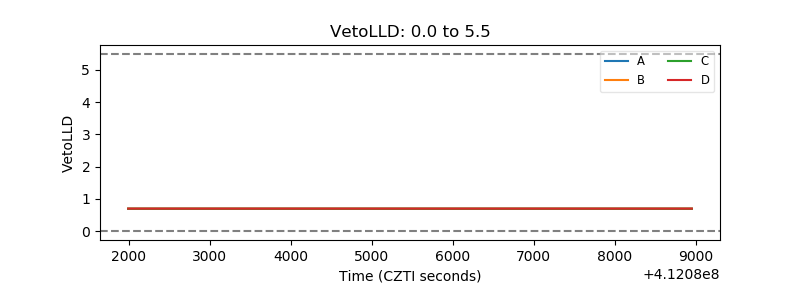 |
| Alpha Counter | 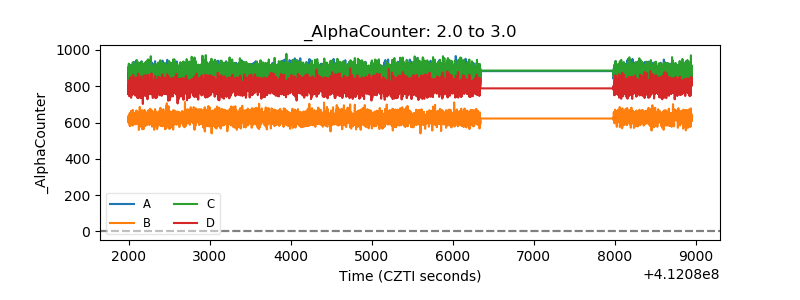 |
| _CPM_Rate | 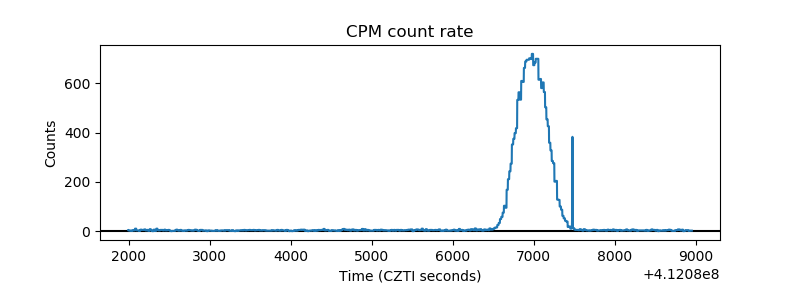 |
| CZT Counter | 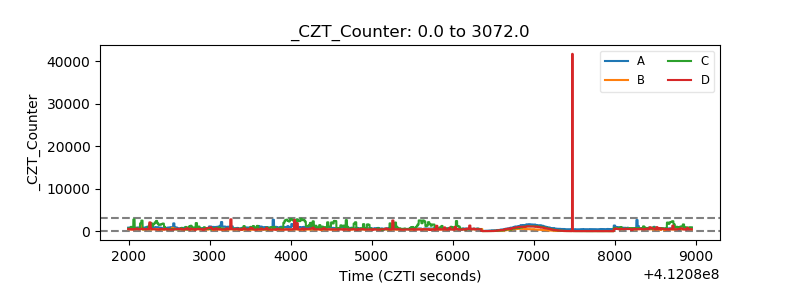 |
| +2.5 Volts monitor | 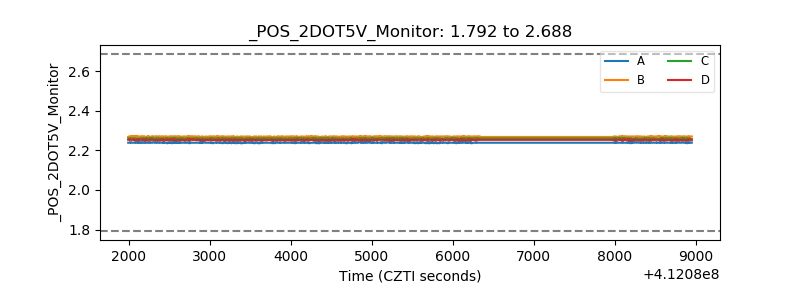 |
| +5 Volts monitor | 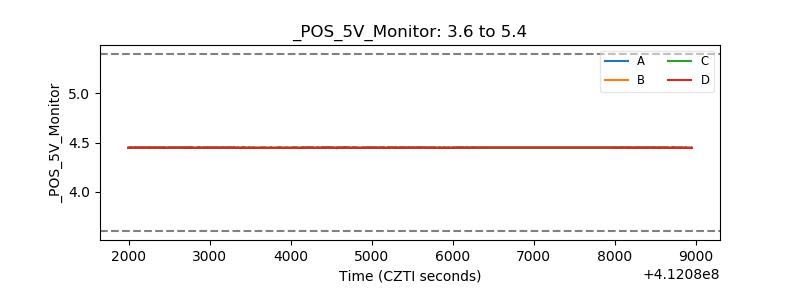 |
| _ROLL_ROT | 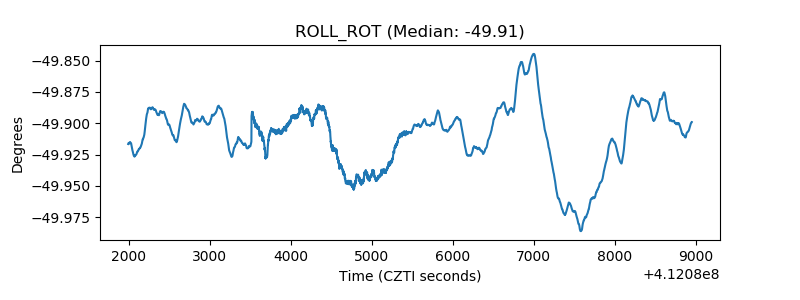 |
| _Roll_DEC | 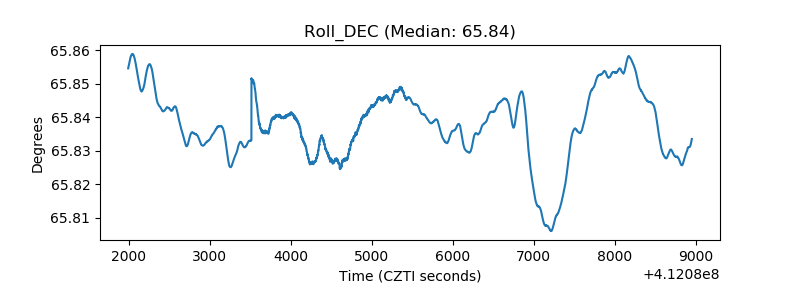 |
| _Roll_RA | 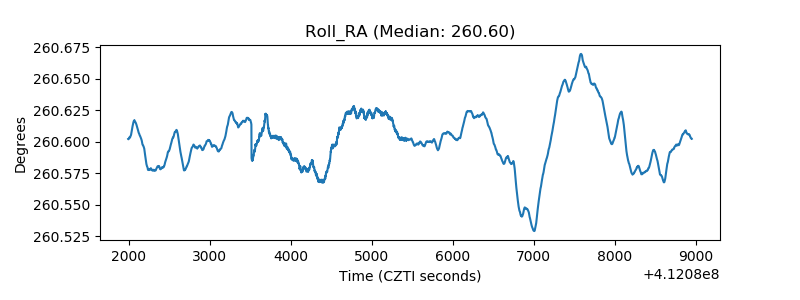 |
| Veto Counter | 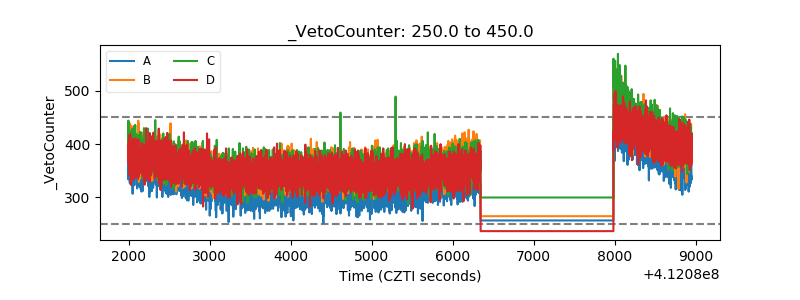 |