| Param | Original file | Final file |
|---|---|---|
| Filename | modeM0/AS1A12_018T01_9000005488_39574cztM0_level2.fits | modeM0/AS1A12_018T01_9000005488_39574cztM0_level2_quad_clean.evt |
| Size (bytes) | 511,536,960 | 92,522,880 |
| Size | 487.8 MB | 88.2 MB |
| Events in quadrant A | 3,897,009 | 637,759 |
| Events in quadrant B | 2,539,526 | 670,936 |
| Events in quadrant C | 7,786,009 | 531,735 |
| Events in quadrant D | 4,277,724 | 568,330 |
| Mode SS | |||
|---|---|---|---|
| Quadrant | BADHDUFLAG | Total packets | Discarded packets |
| A | 0 | 114 | 0 |
| B | 0 | 114 | 0 |
| C | 0 | 114 | 0 |
| D | 0 | 114 | 0 |
| Mode M0 | |||
|---|---|---|---|
| Quadrant | BADHDUFLAG | Total packets | Discarded packets |
| A | 0 | 15150 | 3 |
| B | 0 | 11404 | 2 |
| C | 0 | 27170 | 2 |
| D | 0 | 16470 | 2 |
| Mode M9 | |||
|---|---|---|---|
| Quadrant | BADHDUFLAG | Total packets | Discarded packets |
| A | 0 | 18 | 0 |
| B | 0 | 18 | 0 |
| C | 0 | 18 | 0 |
| D | 0 | 19 | 0 |
| Quadrant | Total seconds | Saturated seconds | Saturation percentage |
|---|---|---|---|
| A | 5615 | 208 | 3.704363% |
| B | 5615 | 11 | 0.195904% |
| C | 5615 | 1005 | 17.898486% |
| D | 5615 | 269 | 4.790739% |
Noise dominated data is calculated using 1-second bins in cleaned event files. If a bin has >2000 counts, and if more than 50% of those come from <1% of pixels, then it is considered to be noise-dominated and hence unusable.
| Quadrant | # 1 sec bins | Bins with >0 counts | Bins with >2000 counts | High rate bins dominated by noise | Noise dominated (total time) | Noise dominated (detector-on time) | Marked lightcurve |
|---|---|---|---|---|---|---|---|
| A | 7407 | 5616 | 181 | 181 | 2.44% | 3.22% | 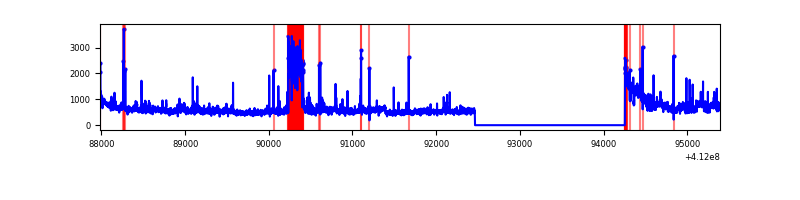 |
| B | 7407 | 5616 | 1 | 1 | 0.01% | 0.02% | 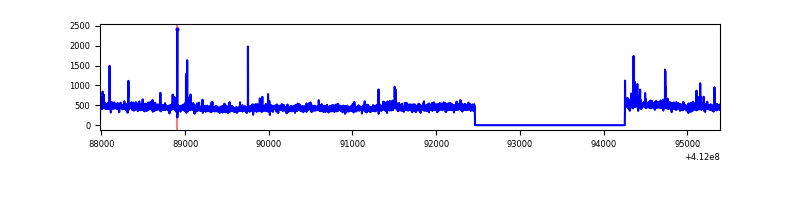 |
| C | 7407 | 5616 | 1006 | 1006 | 13.58% | 17.91% | 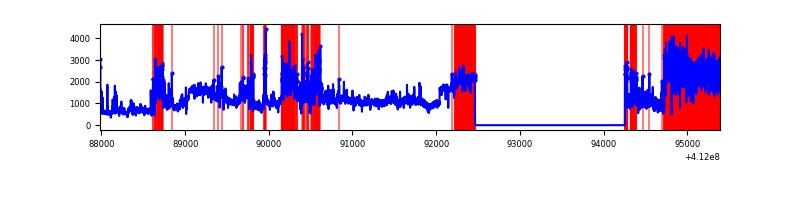 |
| D | 7407 | 5616 | 274 | 274 | 3.70% | 4.88% | 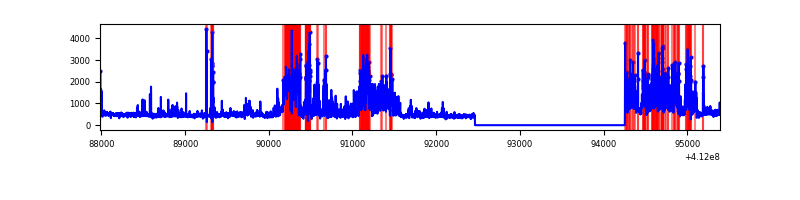 |
Top three noisy pixels from each quadrant. If the there are fewer than three noisy pixels in the level2.evt file, extra rows are filled as -1
| Pixel properties | Quadrant properties | ||||||
|---|---|---|---|---|---|---|---|
| Quadrant | DetID | PixID | Counts | Sigma | Mean | Median | Sigma |
| A | 15 | 222 | 905286 | 7139.05 | 618 | 607 | 126.7 |
| A | 10 | 83 | 463085 | 3649.53 | 618 | 607 | 126.7 |
| A | 9 | 143 | 50741 | 395.62 | 618 | 607 | 126.7 |
| B | 5 | 172 | 45160 | 376.43 | 619 | 602 | 118.4 |
| B | 5 | 255 | 30100 | 249.2 | 619 | 602 | 118.4 |
| B | 0 | 230 | 17253 | 140.67 | 619 | 602 | 118.4 |
| C | 3 | 233 | 2623709 | 19914.83 | 569 | 573 | 131.7 |
| C | 9 | 187 | 2261012 | 17161.24 | 569 | 573 | 131.7 |
| C | 15 | 208 | 439814 | 3334.71 | 569 | 573 | 131.7 |
| D | 12 | 227 | 1237995 | 8321.47 | 606 | 588 | 148.7 |
| D | 1 | 52 | 198440 | 1330.54 | 606 | 588 | 148.7 |
| D | 13 | 249 | 189945 | 1273.41 | 606 | 588 | 148.7 |
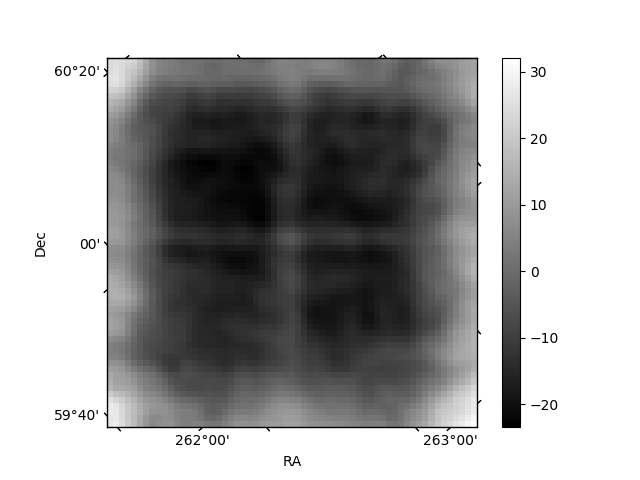
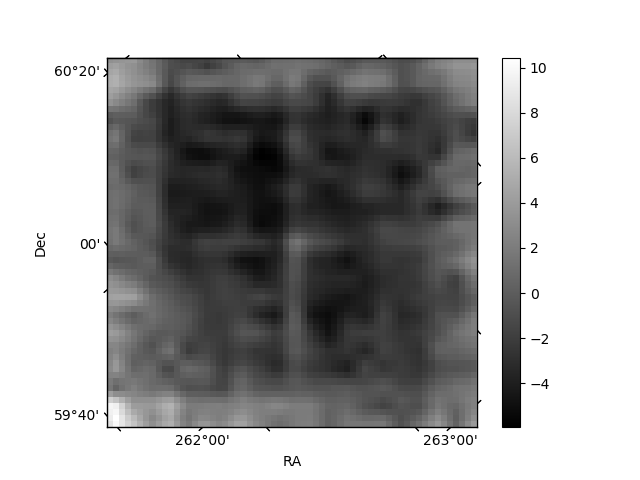
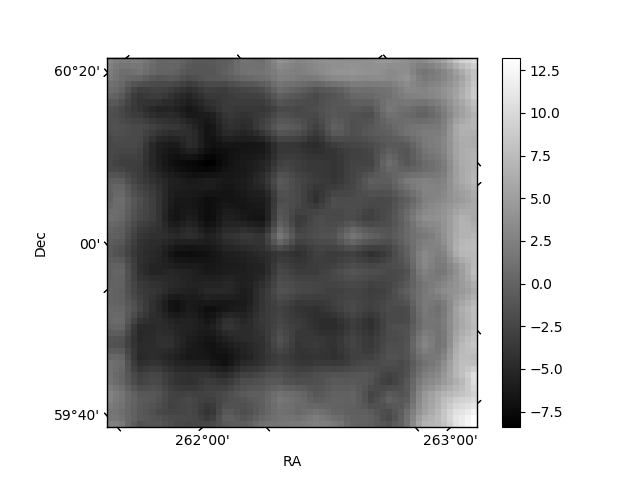
Histogram calculated using DETX and DETY for each event in the final _common_clean file
| Quadrant A | 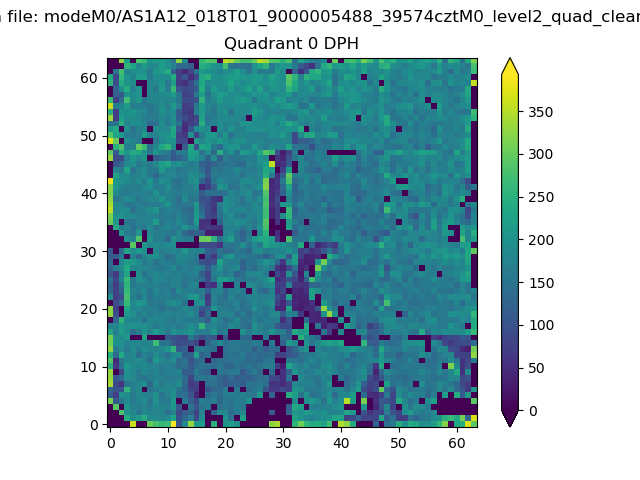 |
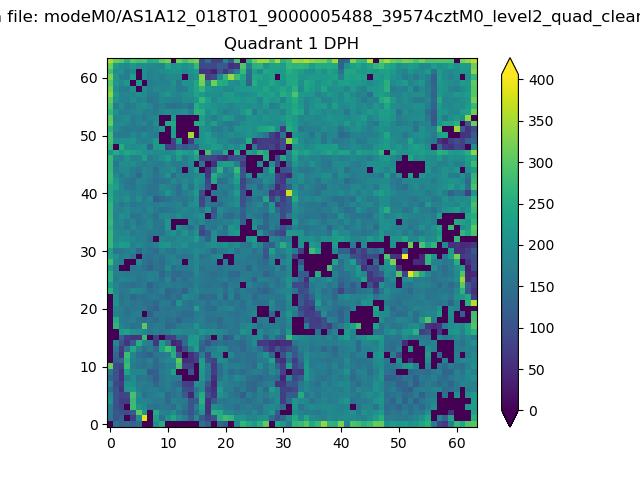 |
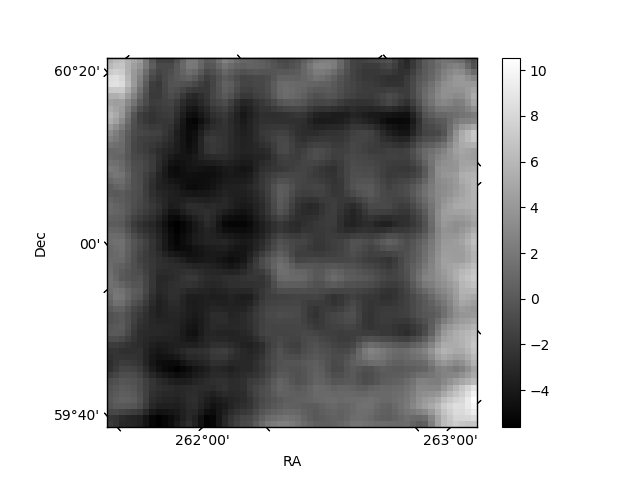
Quadrant B |
|---|---|---|---|
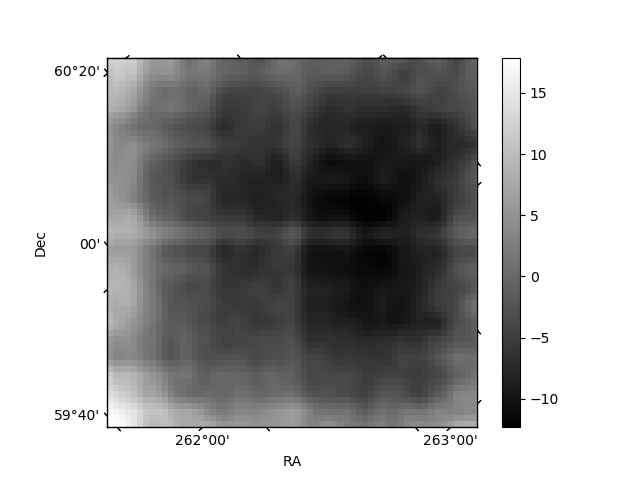
| Quadrant D | 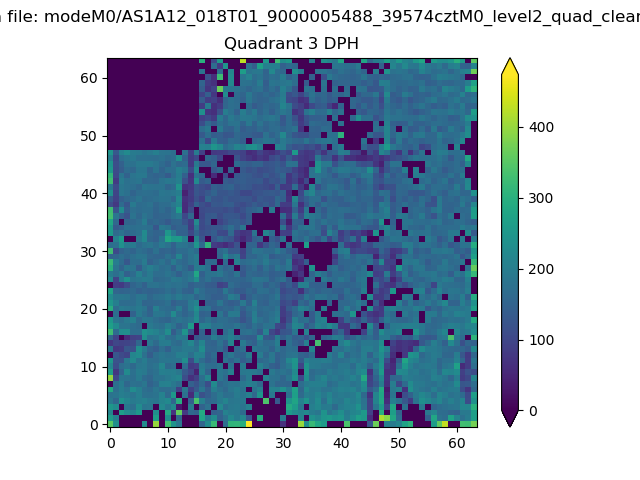 |
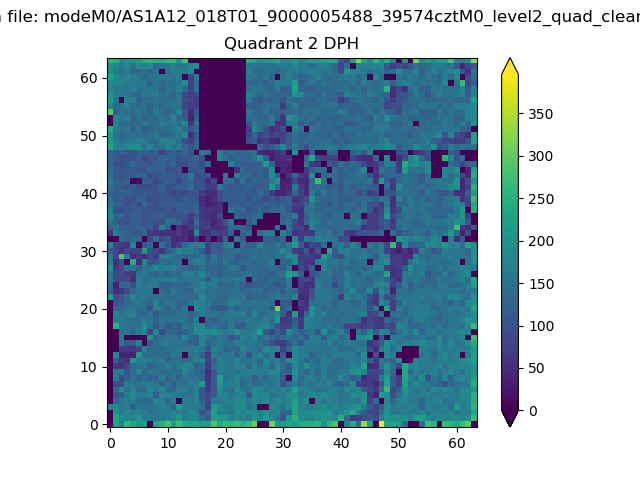 |
Quadrant C |
| Plot type | Count rate plots | Images |
|---|---|---|
| Comparison with Poisson distribution Blue bars denote a histogram of data divided into 1 sec bins. Red curve is a Poisson curve with rate = median count rate of data. |
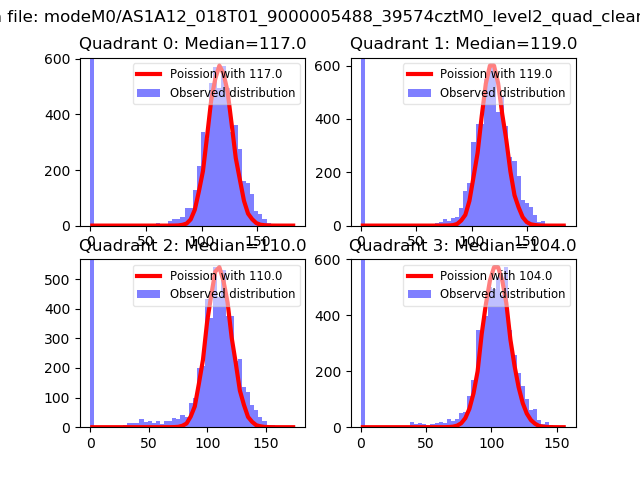 |
 |
| Quadrant-wise count rates Data is divided into 100 sec bins |
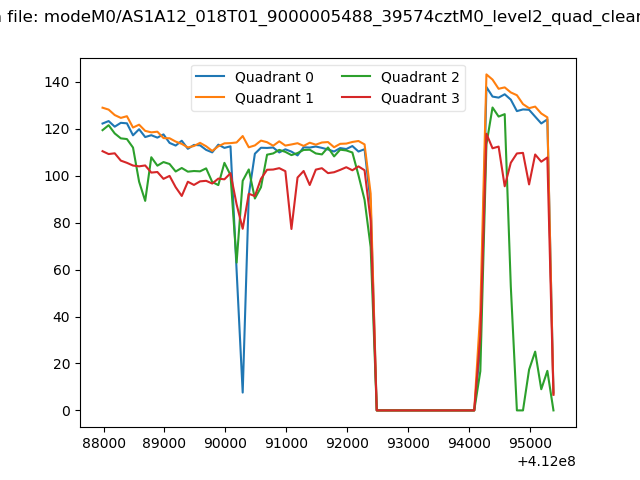 |
|
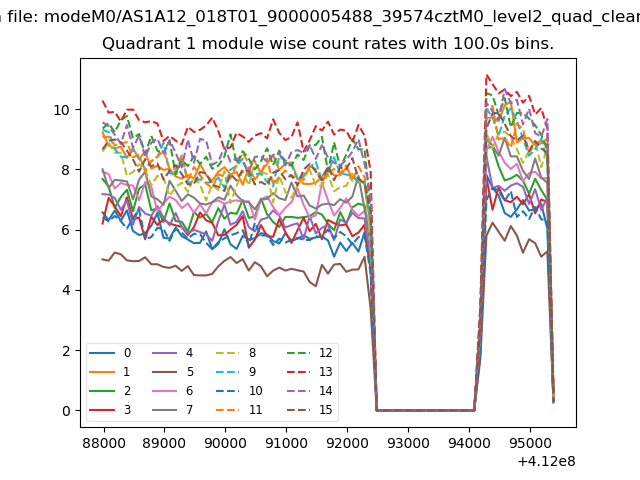
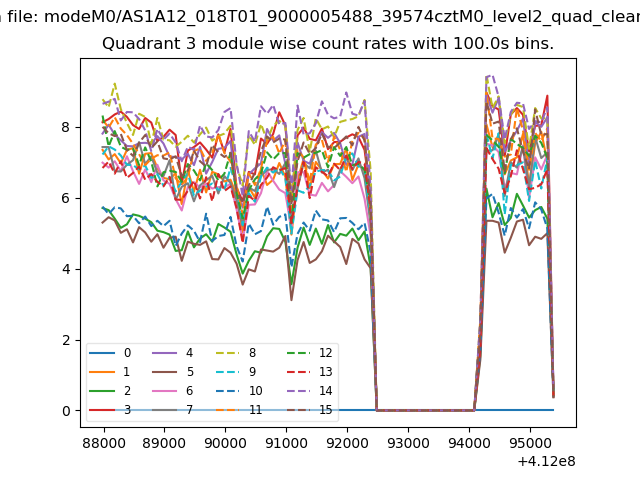
| Module-wise count rates for Quadrant A Data is divided into 100 sec bins |
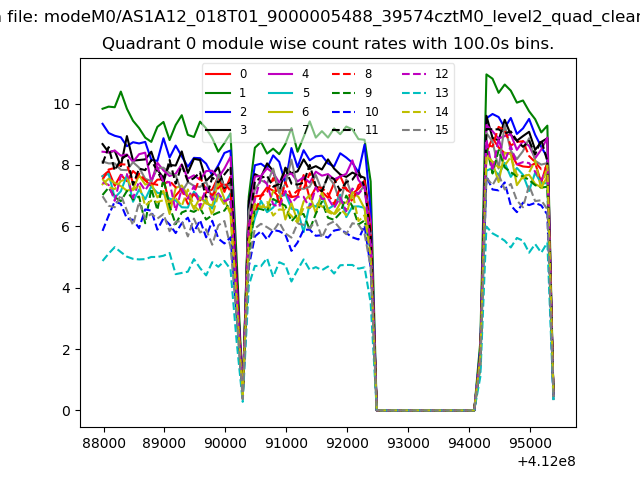 |
 |
| Module-wise count rates for Quadrant B Data is divided into 100 sec bins |
 |
 |
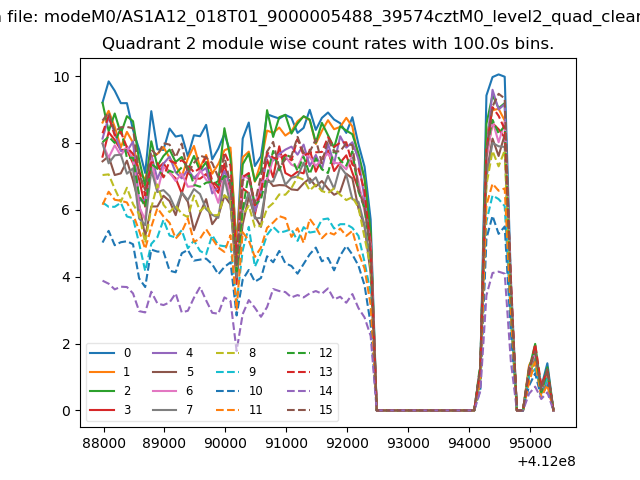
| Module-wise count rates for Quadrant C Data is divided into 100 sec bins |
 |
 |
| Module-wise count rates for Quadrant D Data is divided into 100 sec bins |
 |
 |
| Parameter | Plot |
|---|---|
| CZT HV Monitor | 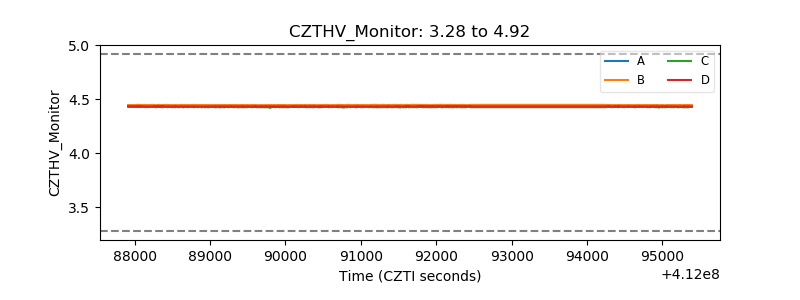 |
| D_VDD | 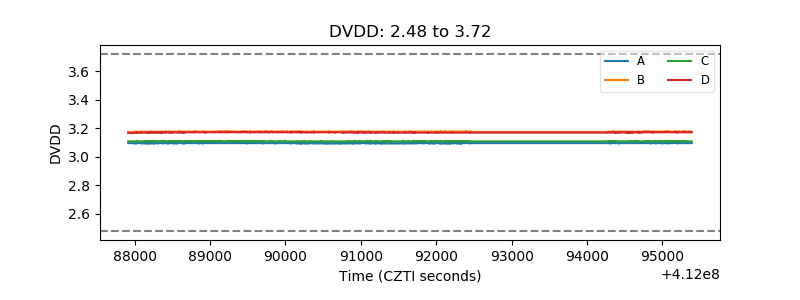 |
| Temperature 1 | 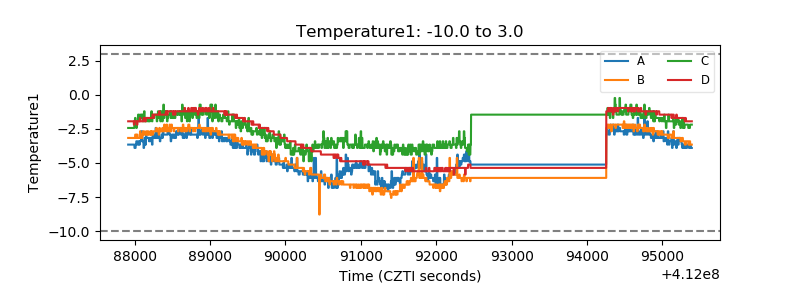 |
| Veto HV Monitor | 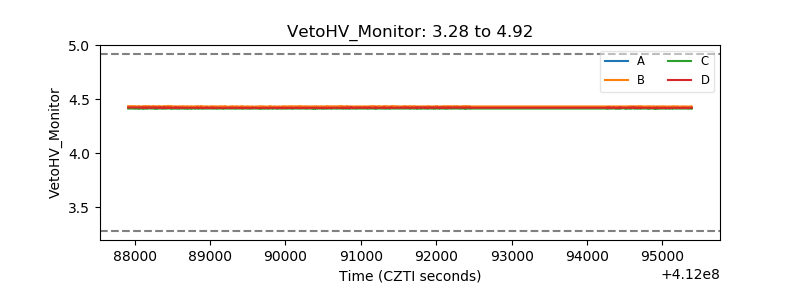 |
| Veto LLD | 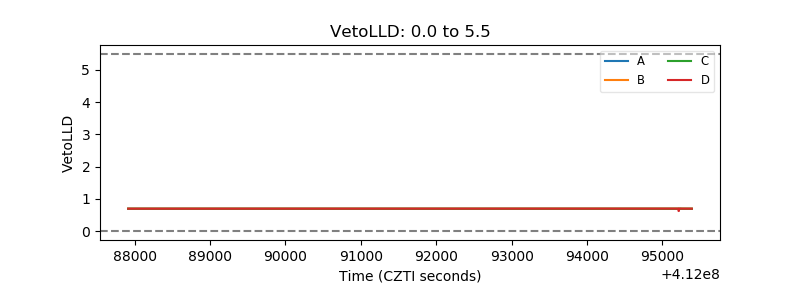 |
| Alpha Counter | 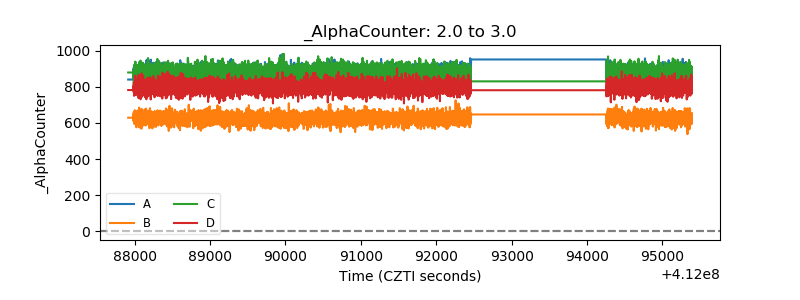 |
| _CPM_Rate | 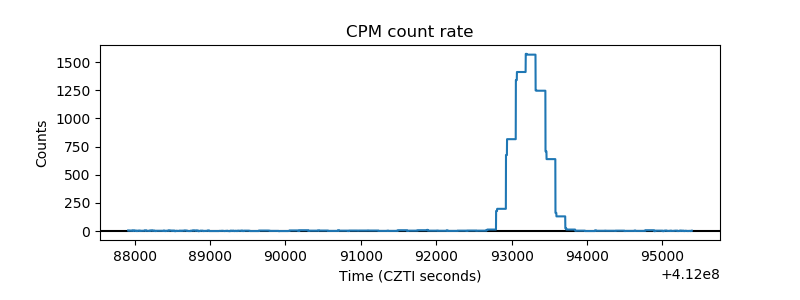 |
| CZT Counter | 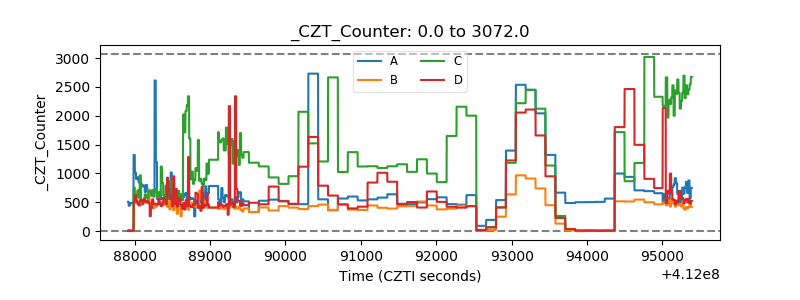 |
| +2.5 Volts monitor | 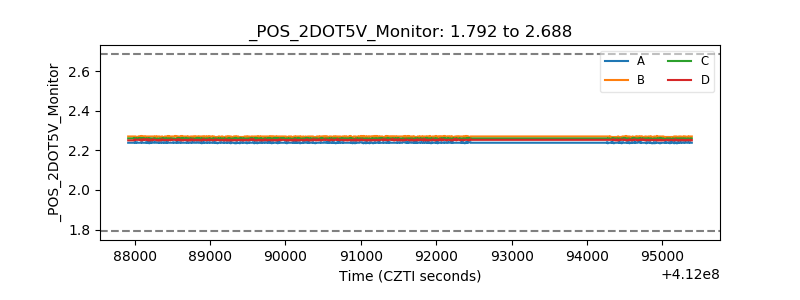 |
| +5 Volts monitor | 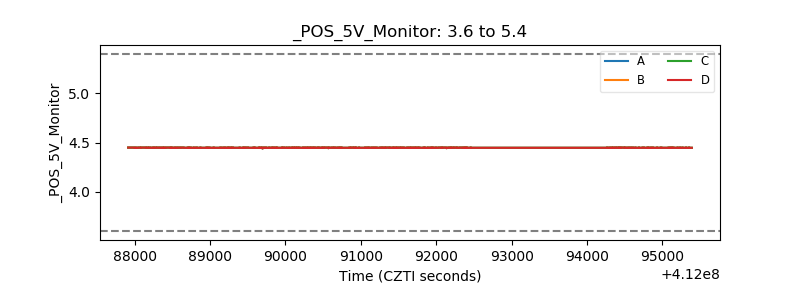 |
| _ROLL_ROT | 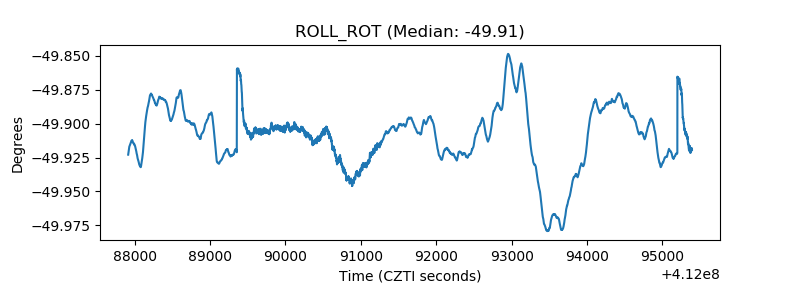 |
| _Roll_DEC | 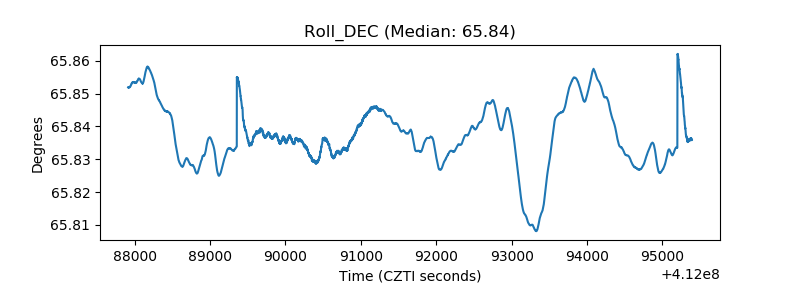 |
| _Roll_RA | 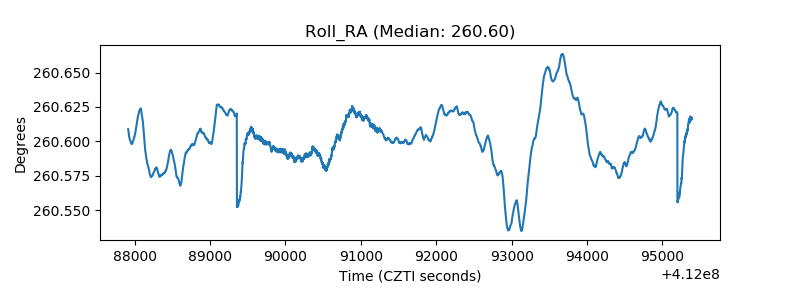 |
| Veto Counter | 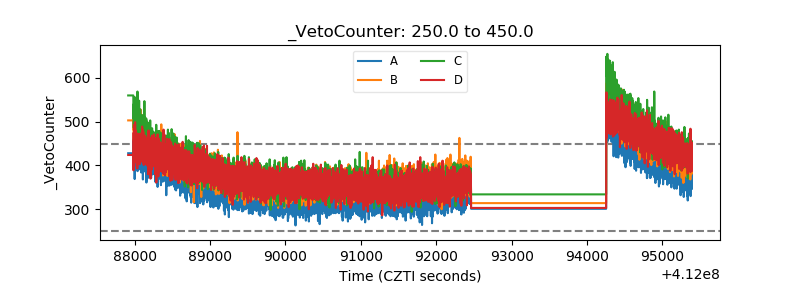 |