| Param | Original file | Final file |
|---|---|---|
| Filename | modeM0/AS1A12_018T01_9000005488_39575cztM0_level2.fits | modeM0/AS1A12_018T01_9000005488_39575cztM0_level2_quad_clean.evt |
| Size (bytes) | 1,189,120,320 | 233,282,880 |
| Size | 1.1 GB | 222.5 MB |
| Events in quadrant A | 9,819,823 | 1,616,564 |
| Events in quadrant B | 6,388,608 | 1,681,867 |
| Events in quadrant C | 17,131,456 | 1,339,792 |
| Events in quadrant D | 9,578,195 | 1,442,164 |
| Mode SS | |||
|---|---|---|---|
| Quadrant | BADHDUFLAG | Total packets | Discarded packets |
| A | 0 | 292 | 0 |
| B | 0 | 292 | 0 |
| C | 0 | 292 | 0 |
| D | 0 | 292 | 0 |
| Mode M0 | |||
|---|---|---|---|
| Quadrant | BADHDUFLAG | Total packets | Discarded packets |
| A | 0 | 38506 | 4 |
| B | 0 | 29153 | 3 |
| C | 0 | 60733 | 3 |
| D | 0 | 38510 | 3 |
| Mode M9 | |||
|---|---|---|---|
| Quadrant | BADHDUFLAG | Total packets | Discarded packets |
| A | 0 | 53 | 0 |
| B | 0 | 53 | 0 |
| C | 0 | 53 | 0 |
| D | 0 | 53 | 0 |
| Quadrant | Total seconds | Saturated seconds | Saturation percentage |
|---|---|---|---|
| A | 14233 | 308 | 2.163985% |
| B | 14233 | 36 | 0.252933% |
| C | 14233 | 2462 | 17.297829% |
| D | 14233 | 514 | 3.611326% |
Noise dominated data is calculated using 1-second bins in cleaned event files. If a bin has >2000 counts, and if more than 50% of those come from <1% of pixels, then it is considered to be noise-dominated and hence unusable.
| Quadrant | # 1 sec bins | Bins with >0 counts | Bins with >2000 counts | High rate bins dominated by noise | Noise dominated (total time) | Noise dominated (detector-on time) | Marked lightcurve |
|---|---|---|---|---|---|---|---|
| A | 19550 | 14236 | 258 | 258 | 1.32% | 1.81% | 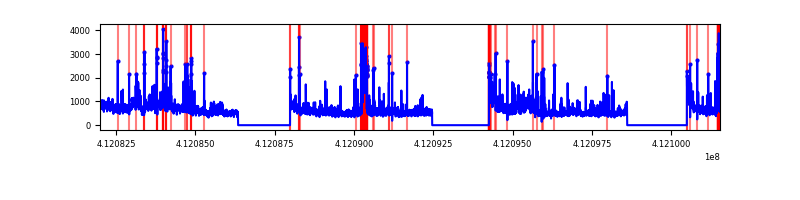 |
| B | 19550 | 14236 | 14 | 14 | 0.07% | 0.10% | 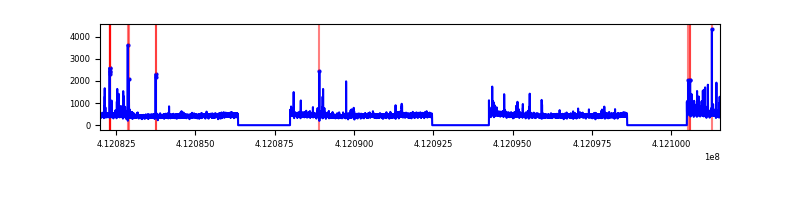 |
| C | 19550 | 14236 | 2301 | 2301 | 11.77% | 16.16% | 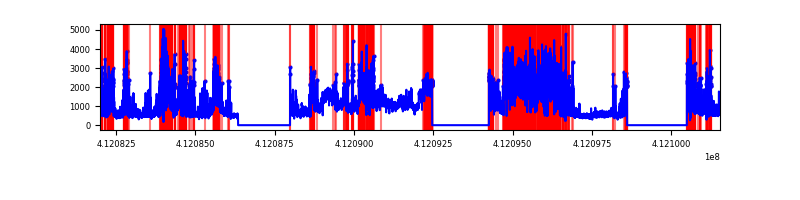 |
| D | 19550 | 14236 | 510 | 510 | 2.61% | 3.58% | 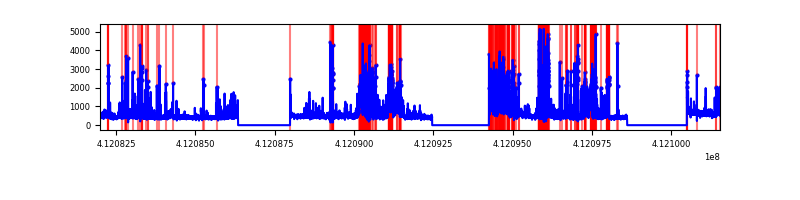 |
Top three noisy pixels from each quadrant. If the there are fewer than three noisy pixels in the level2.evt file, extra rows are filled as -1
| Pixel properties | Quadrant properties | ||||||
|---|---|---|---|---|---|---|---|
| Quadrant | DetID | PixID | Counts | Sigma | Mean | Median | Sigma |
| A | 15 | 222 | 2335971 | 7444.69 | 1555 | 1523 | 313.6 |
| A | 10 | 83 | 1007321 | 3207.55 | 1555 | 1523 | 313.6 |
| A | 9 | 143 | 215498 | 682.38 | 1555 | 1523 | 313.6 |
| B | 5 | 172 | 186406 | 631.94 | 1554 | 1513 | 292.6 |
| B | 5 | 255 | 43528 | 143.6 | 1554 | 1513 | 292.6 |
| B | 12 | 111 | 36804 | 120.62 | 1554 | 1513 | 292.6 |
| C | 9 | 187 | 6741779 | 20324.31 | 1439 | 1448 | 331.6 |
| C | 3 | 233 | 2705478 | 8153.54 | 1439 | 1448 | 331.6 |
| C | 15 | 208 | 1506360 | 4537.8 | 1439 | 1448 | 331.6 |
| D | 12 | 227 | 2303323 | 6202.88 | 1523 | 1482 | 371.1 |
| D | 1 | 52 | 415386 | 1115.37 | 1523 | 1482 | 371.1 |
| D | 13 | 249 | 311153 | 834.48 | 1523 | 1482 | 371.1 |
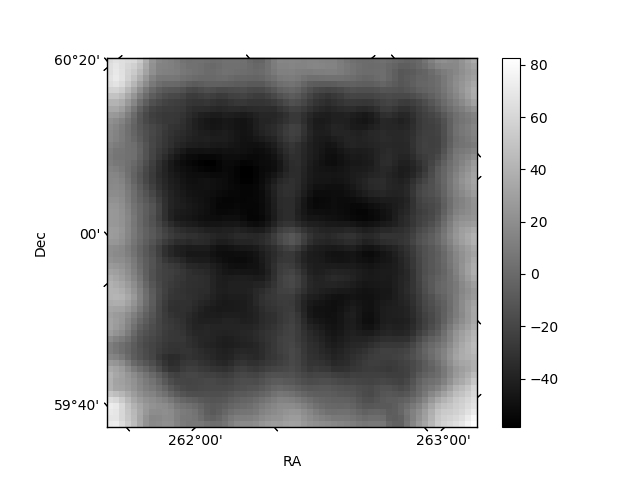
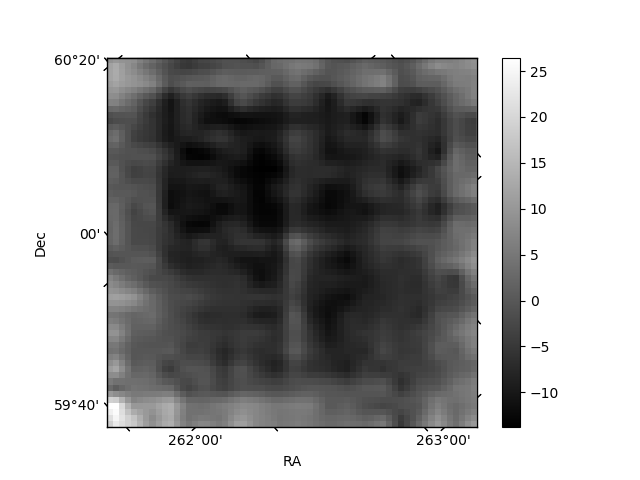
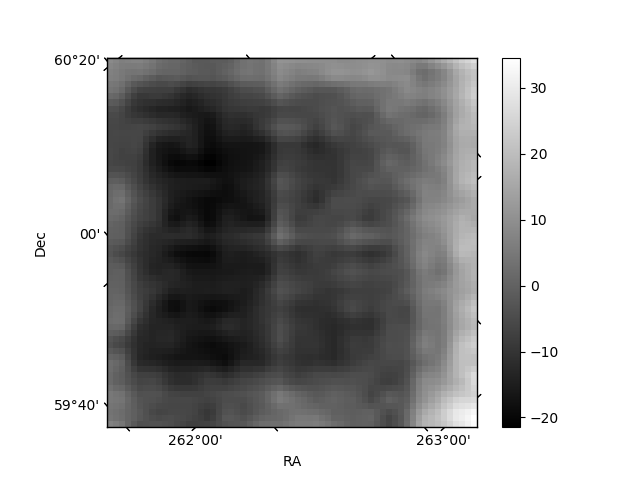
Histogram calculated using DETX and DETY for each event in the final _common_clean file
| Quadrant A | 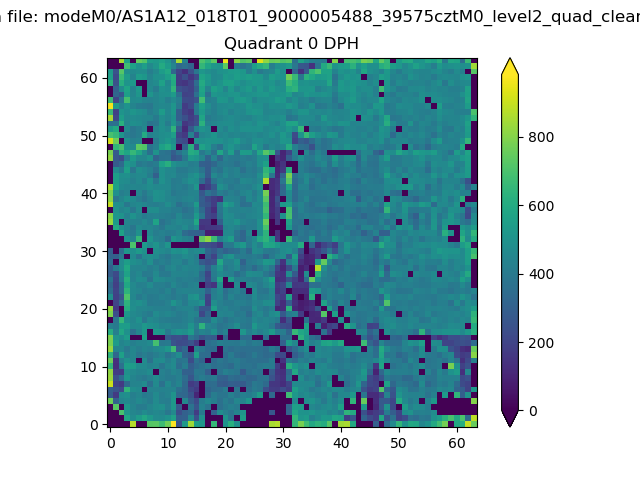 |
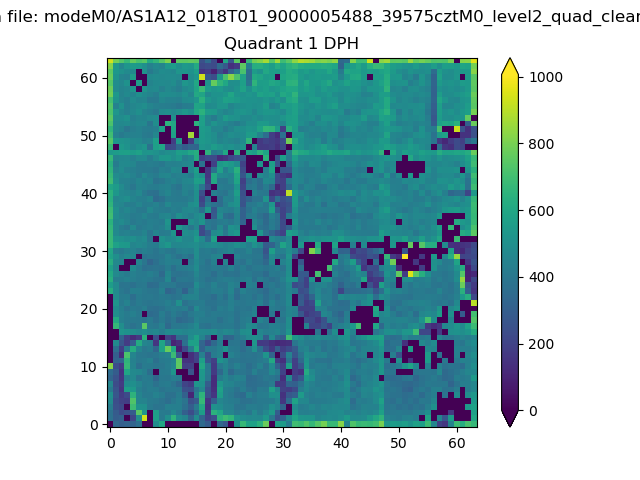 |
Quadrant B |
|---|---|---|---|
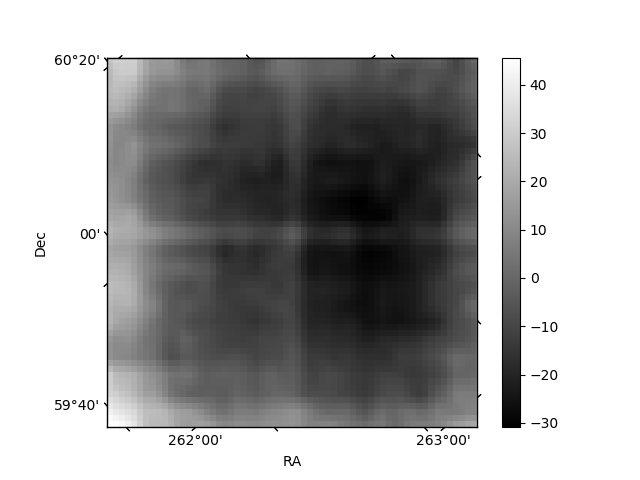
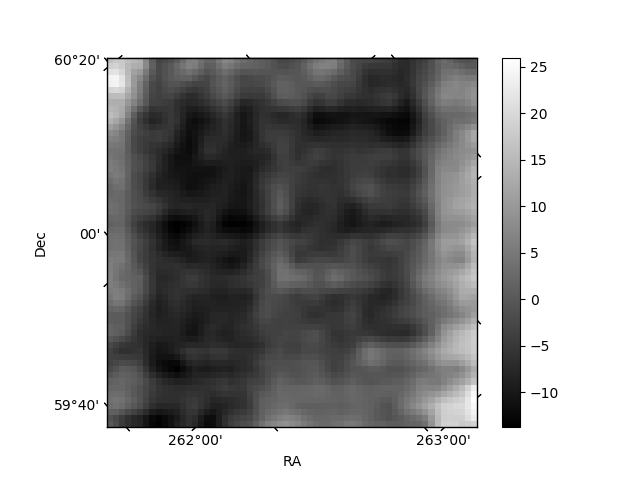
| Quadrant D | 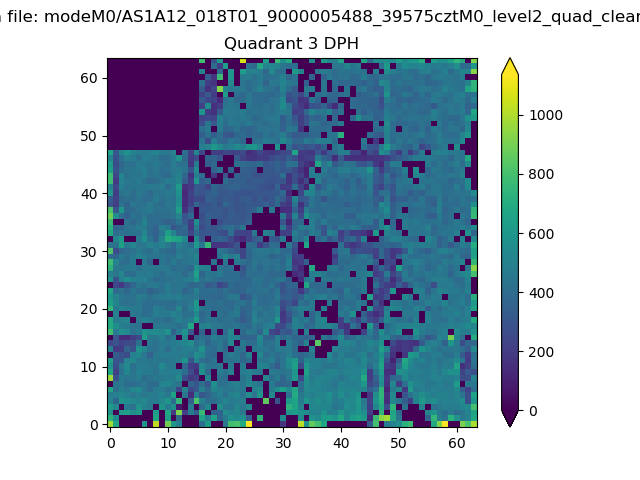 |
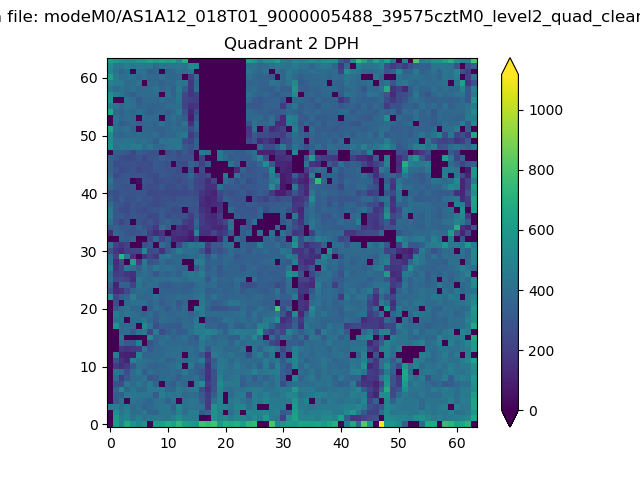 |
Quadrant C |
| Plot type | Count rate plots | Images |
|---|---|---|
| Comparison with Poisson distribution Blue bars denote a histogram of data divided into 1 sec bins. Red curve is a Poisson curve with rate = median count rate of data. |
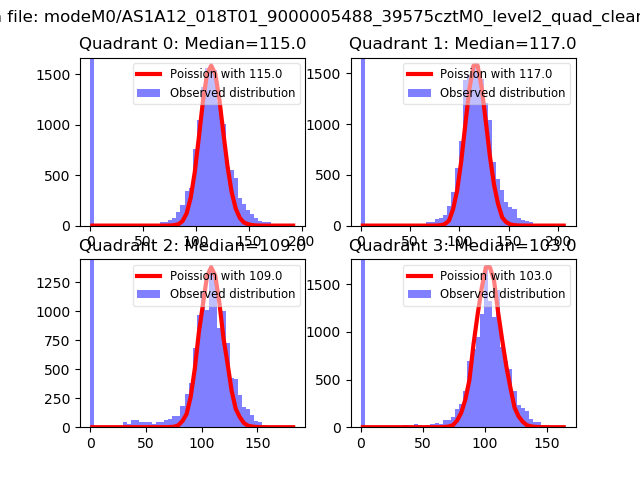 |
 |
| Quadrant-wise count rates Data is divided into 100 sec bins |
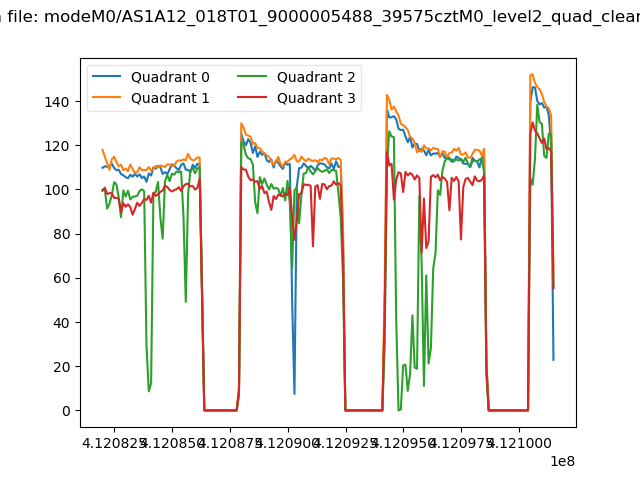 |
|
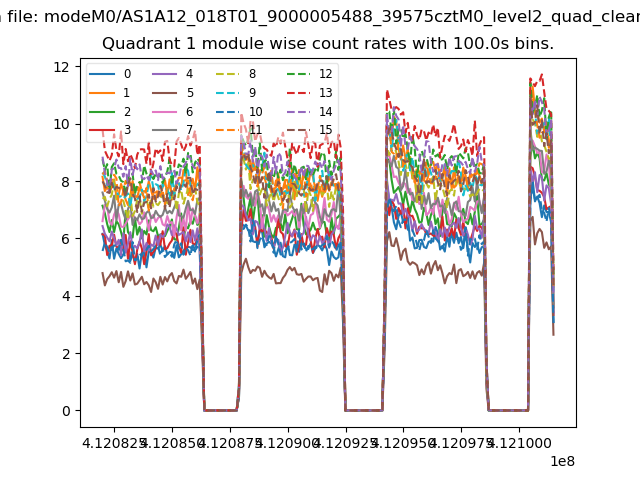
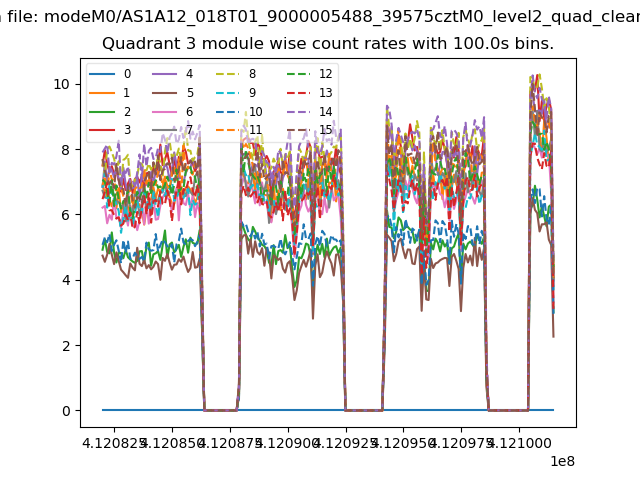
| Module-wise count rates for Quadrant A Data is divided into 100 sec bins |
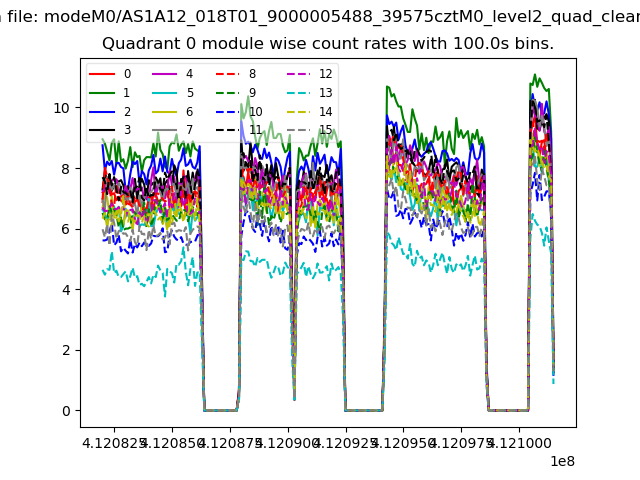 |
 |
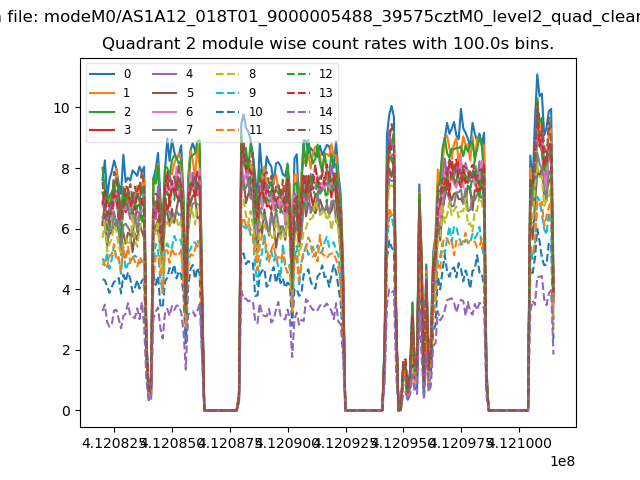
| Module-wise count rates for Quadrant B Data is divided into 100 sec bins |
 |
 |
| Module-wise count rates for Quadrant C Data is divided into 100 sec bins |
 |
 |
| Module-wise count rates for Quadrant D Data is divided into 100 sec bins |
 |
 |
| Parameter | Plot |
|---|---|
| CZT HV Monitor | 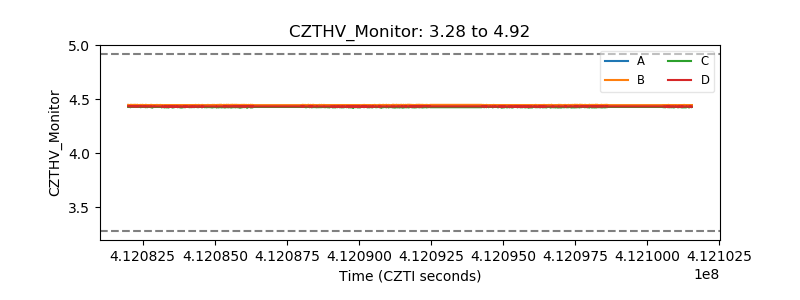 |
| D_VDD | 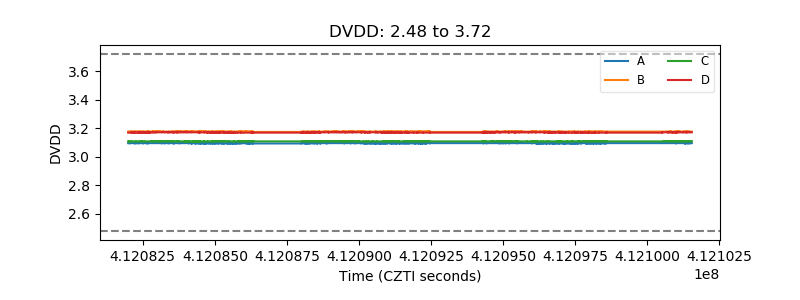 |
| Temperature 1 | 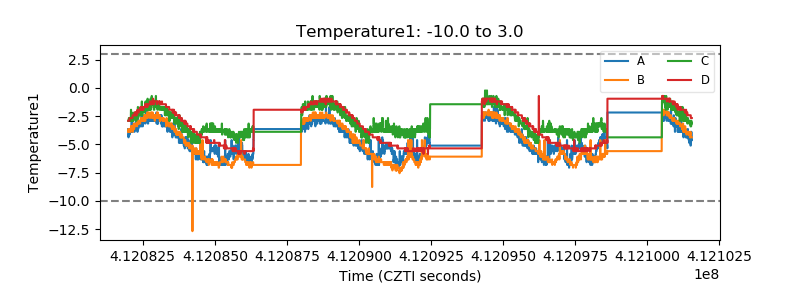 |
| Veto HV Monitor | 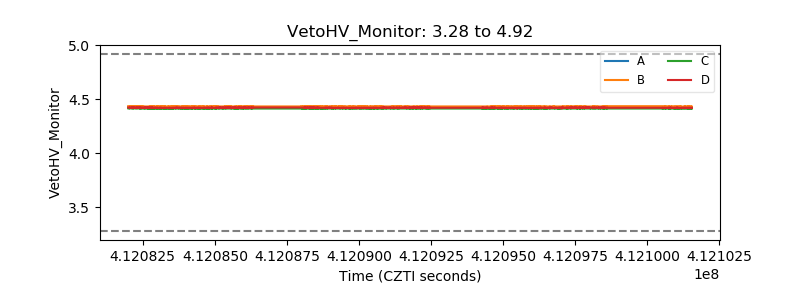 |
| Veto LLD | 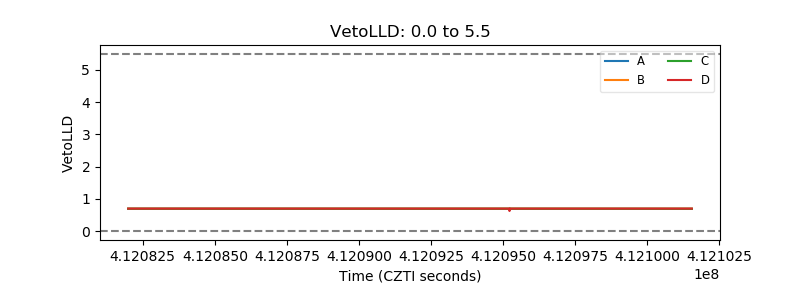 |
| Alpha Counter | 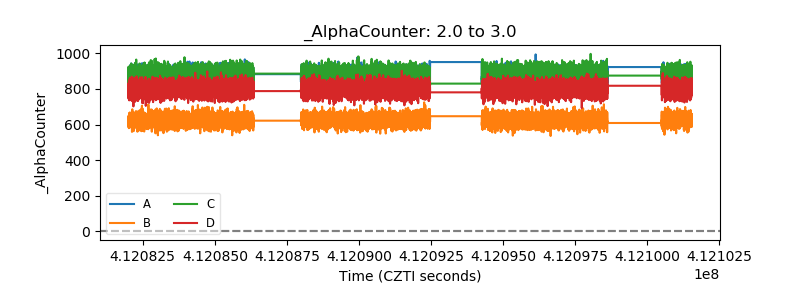 |
| _CPM_Rate | 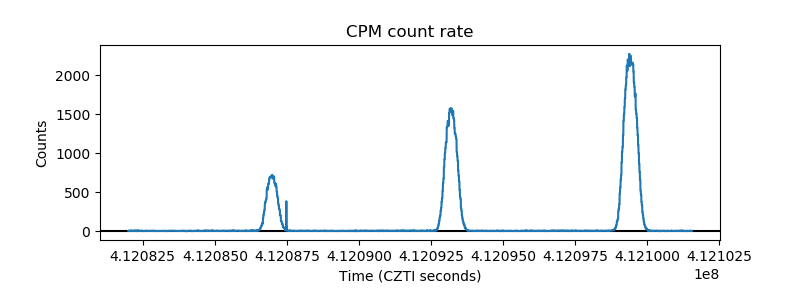 |
| CZT Counter | 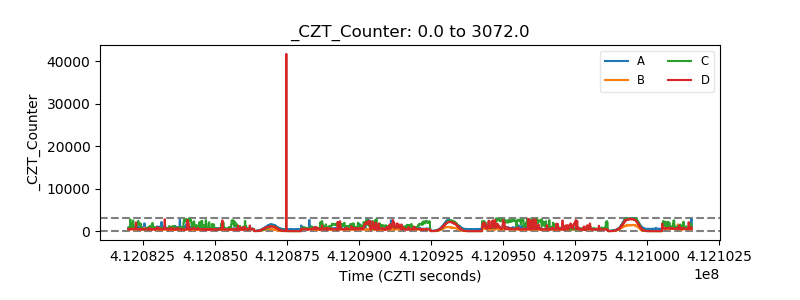 |
| +2.5 Volts monitor | 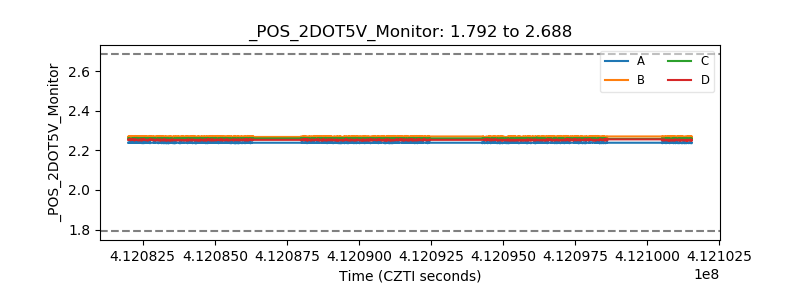 |
| +5 Volts monitor | 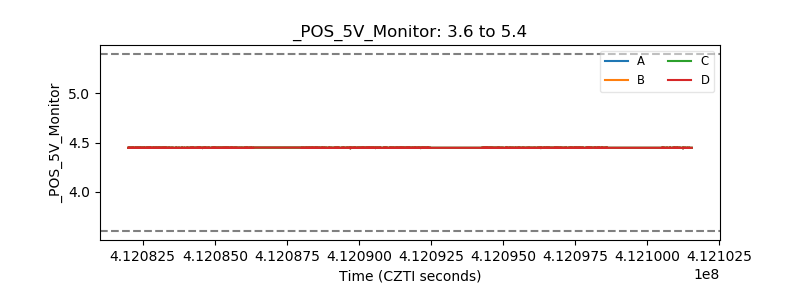 |
| _ROLL_ROT | 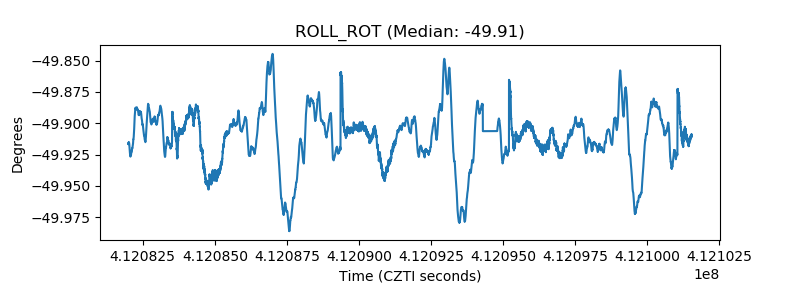 |
| _Roll_DEC | 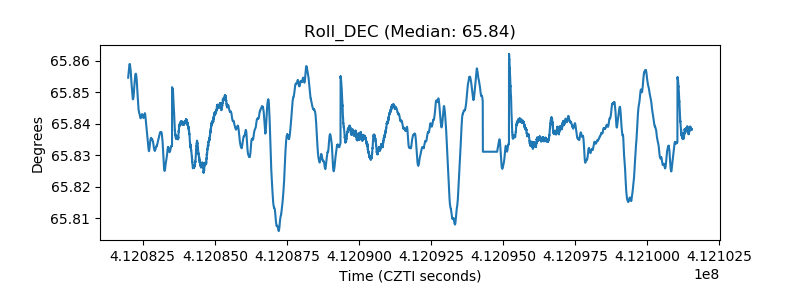 |
| _Roll_RA | 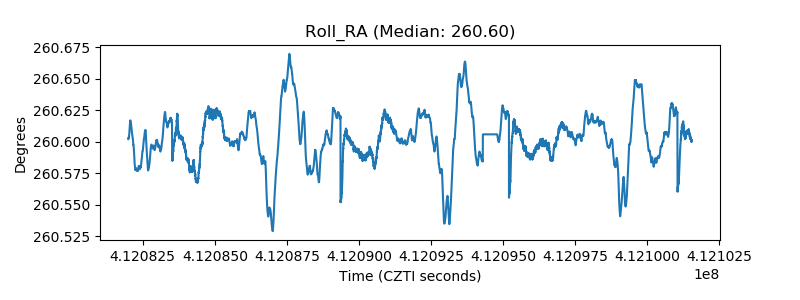 |
| Veto Counter | 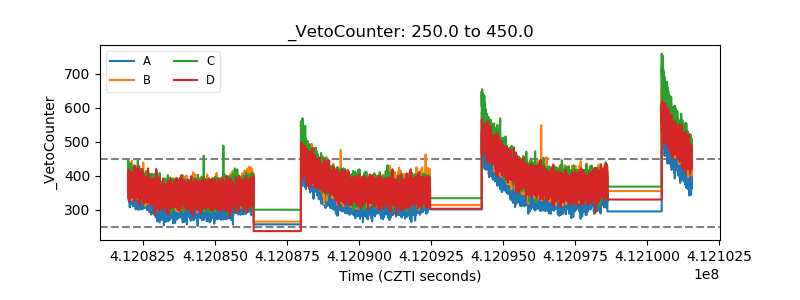 |