| Param | Original file | Final file |
|---|---|---|
| Filename | modeM0/AS1A12_018T01_9000005488_39576cztM0_level2.fits | modeM0/AS1A12_018T01_9000005488_39576cztM0_level2_quad_clean.evt |
| Size (bytes) | 471,784,320 | 88,246,080 |
| Size | 449.9 MB | 84.2 MB |
| Events in quadrant A | 4,114,712 | 573,879 |
| Events in quadrant B | 3,304,319 | 632,527 |
| Events in quadrant C | 5,683,450 | 569,988 |
| Events in quadrant D | 3,970,552 | 542,437 |
| Mode SS | |||
|---|---|---|---|
| Quadrant | BADHDUFLAG | Total packets | Discarded packets |
| A | 0 | 104 | 0 |
| B | 0 | 104 | 0 |
| C | 0 | 104 | 0 |
| D | 0 | 104 | 0 |
| Mode M0 | |||
|---|---|---|---|
| Quadrant | BADHDUFLAG | Total packets | Discarded packets |
| A | 0 | 15535 | 3 |
| B | 0 | 13146 | 2 |
| C | 0 | 20442 | 2 |
| D | 0 | 15396 | 2 |
| Mode M9 | |||
|---|---|---|---|
| Quadrant | BADHDUFLAG | Total packets | Discarded packets |
| A | 0 | 20 | 0 |
| B | 0 | 20 | 0 |
| C | 0 | 20 | 0 |
| D | 0 | 21 | 0 |
| Quadrant | Total seconds | Saturated seconds | Saturation percentage |
|---|---|---|---|
| A | 5035 | 595 | 11.817279% |
| B | 5035 | 265 | 5.263158% |
| C | 5035 | 653 | 12.969215% |
| D | 5035 | 408 | 8.103277% |
Noise dominated data is calculated using 1-second bins in cleaned event files. If a bin has >2000 counts, and if more than 50% of those come from <1% of pixels, then it is considered to be noise-dominated and hence unusable.
| Quadrant | # 1 sec bins | Bins with >0 counts | Bins with >2000 counts | High rate bins dominated by noise | Noise dominated (total time) | Noise dominated (detector-on time) | Marked lightcurve |
|---|---|---|---|---|---|---|---|
| A | 7039 | 5036 | 466 | 466 | 6.62% | 9.25% | 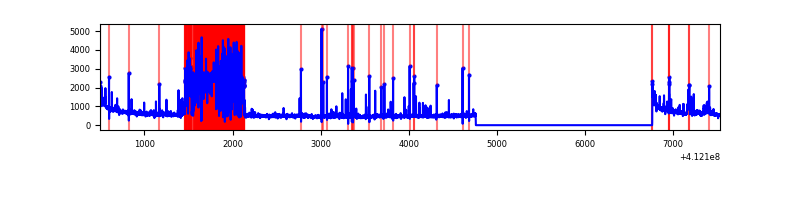 |
| B | 7039 | 5036 | 221 | 221 | 3.14% | 4.39% | 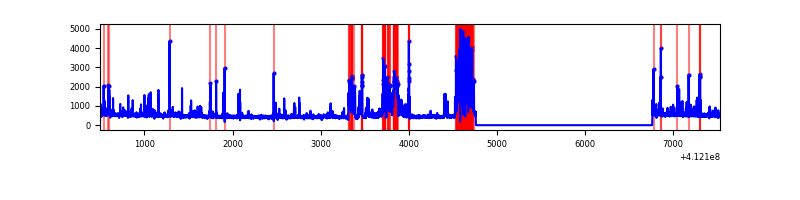 |
| C | 7039 | 5036 | 592 | 592 | 8.41% | 11.76% | 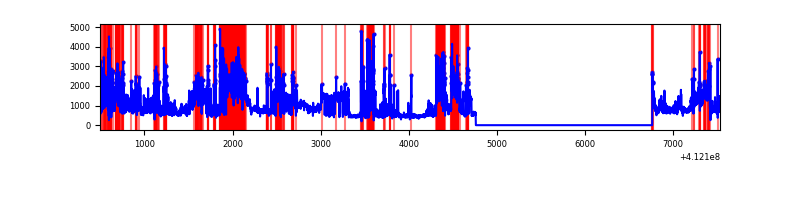 |
| D | 7039 | 5036 | 375 | 375 | 5.33% | 7.45% | 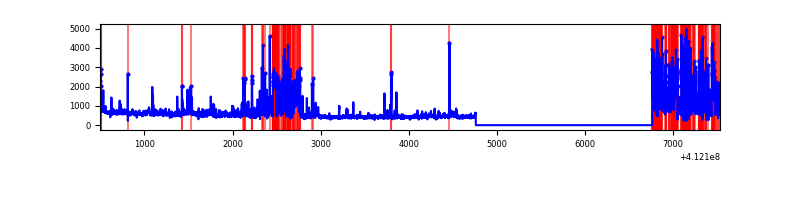 |
Top three noisy pixels from each quadrant. If the there are fewer than three noisy pixels in the level2.evt file, extra rows are filled as -1
| Pixel properties | Quadrant properties | ||||||
|---|---|---|---|---|---|---|---|
| Quadrant | DetID | PixID | Counts | Sigma | Mean | Median | Sigma |
| A | 9 | 143 | 1381486 | 12606.69 | 541 | 530 | 109.5 |
| A | 10 | 83 | 413487 | 3769.86 | 541 | 530 | 109.5 |
| A | 6 | 10 | 111163 | 1009.96 | 541 | 530 | 109.5 |
| B | 5 | 172 | 1019468 | 9558.78 | 569 | 553 | 106.6 |
| B | 5 | 255 | 35821 | 330.86 | 569 | 553 | 106.6 |
| B | 12 | 111 | 12712 | 114.07 | 569 | 553 | 106.6 |
| C | 15 | 208 | 1777309 | 13874.69 | 558 | 561 | 128.1 |
| C | 9 | 187 | 1480783 | 11559.1 | 558 | 561 | 128.1 |
| C | 15 | 214 | 203828 | 1587.32 | 558 | 561 | 128.1 |
| D | 12 | 227 | 875179 | 6619.63 | 553 | 539 | 132.1 |
| D | 13 | 249 | 410052 | 3099.36 | 553 | 539 | 132.1 |
| D | 1 | 52 | 204898 | 1546.67 | 553 | 539 | 132.1 |
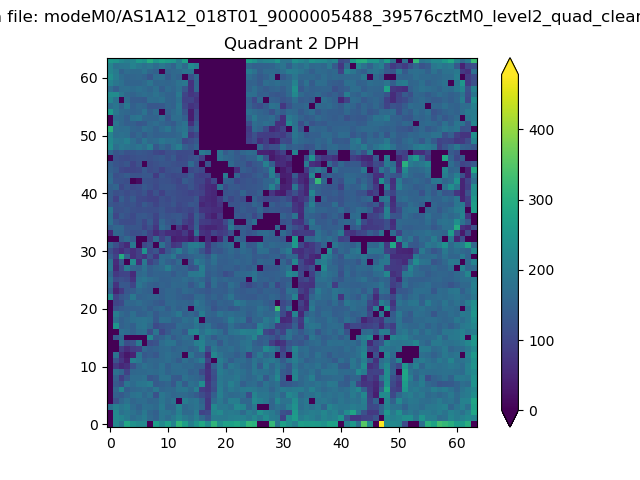
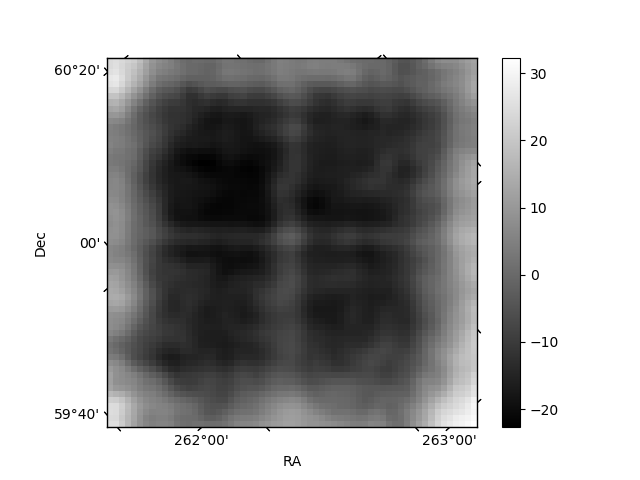
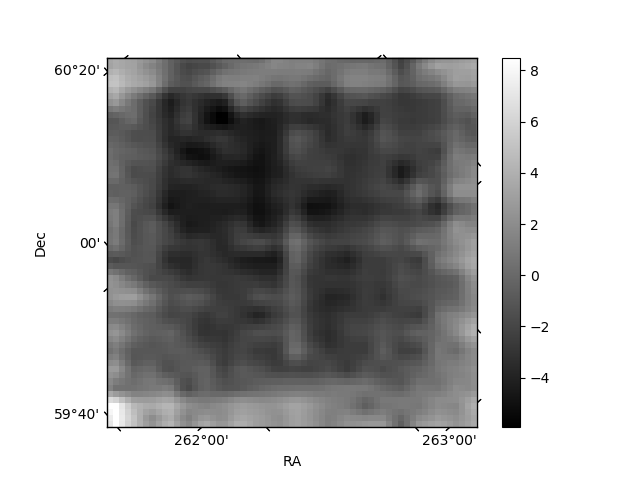
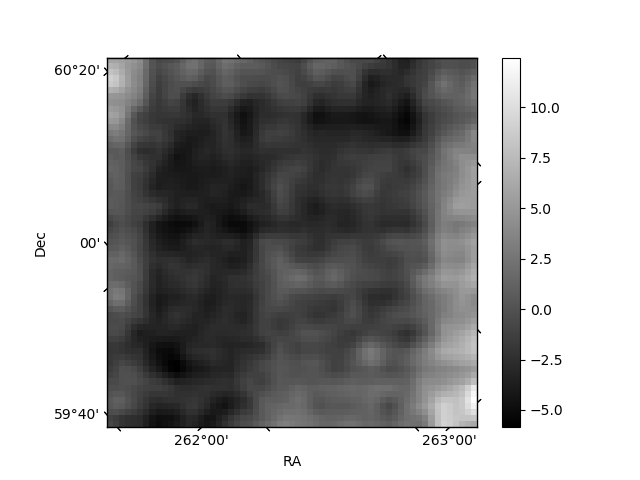
Histogram calculated using DETX and DETY for each event in the final _common_clean file
| Quadrant A | 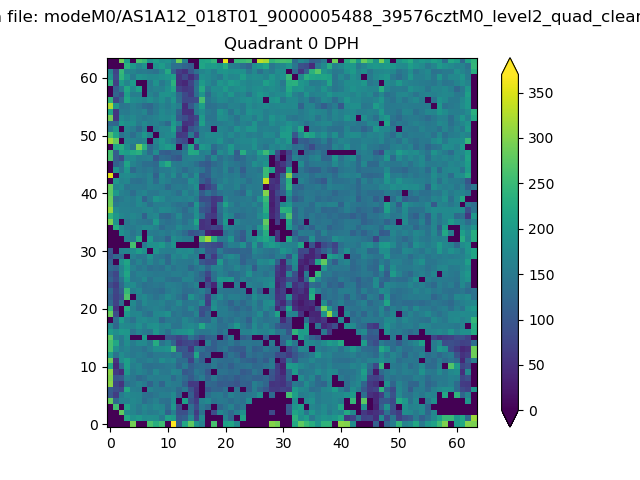 |
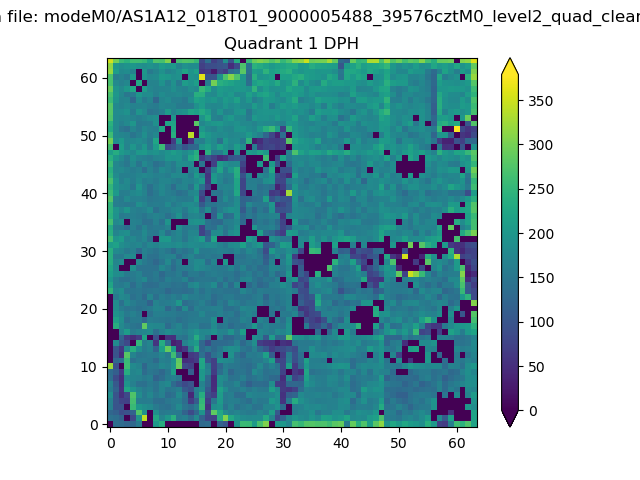 |
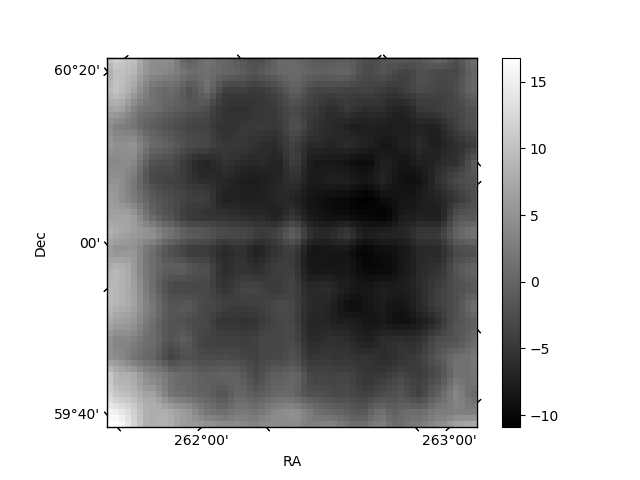
Quadrant B |
|---|---|---|---|
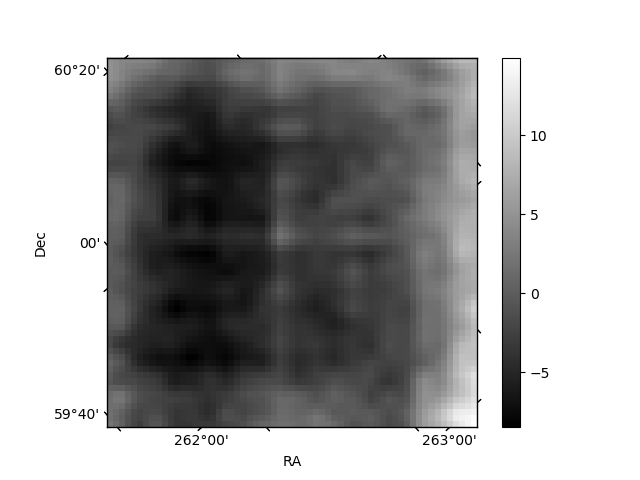
| Quadrant D | 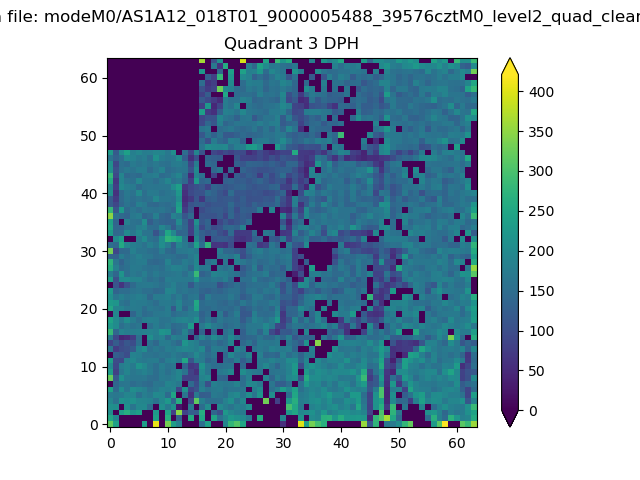 |
 |
Quadrant C |
| Plot type | Count rate plots | Images |
|---|---|---|
| Comparison with Poisson distribution Blue bars denote a histogram of data divided into 1 sec bins. Red curve is a Poisson curve with rate = median count rate of data. |
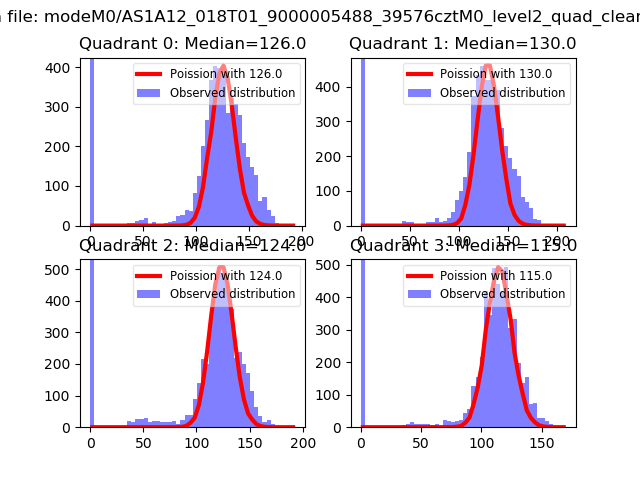 |
 |
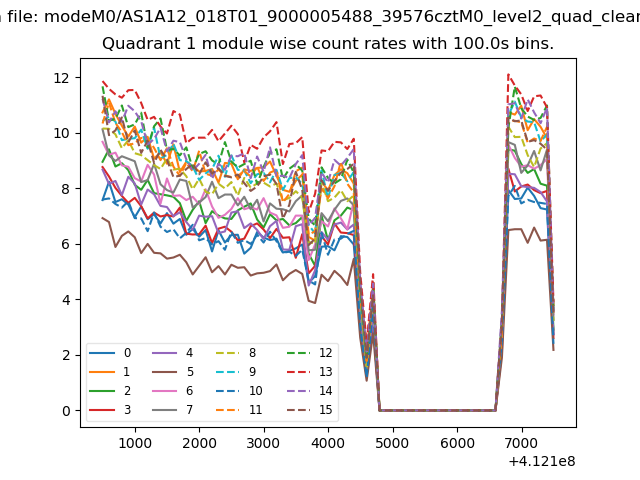
| Quadrant-wise count rates Data is divided into 100 sec bins |
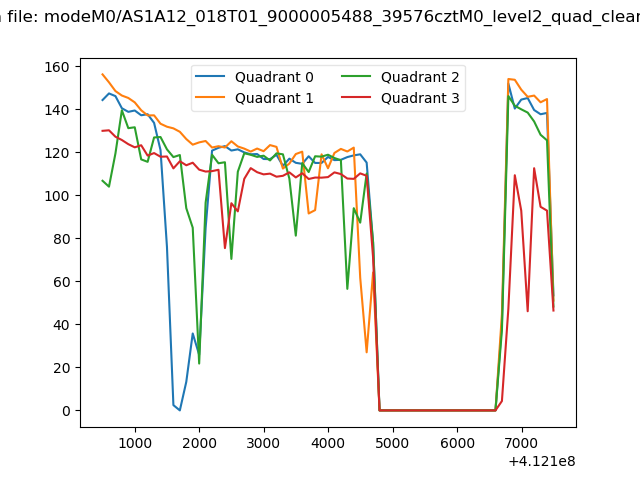 |
|
| Module-wise count rates for Quadrant A Data is divided into 100 sec bins |
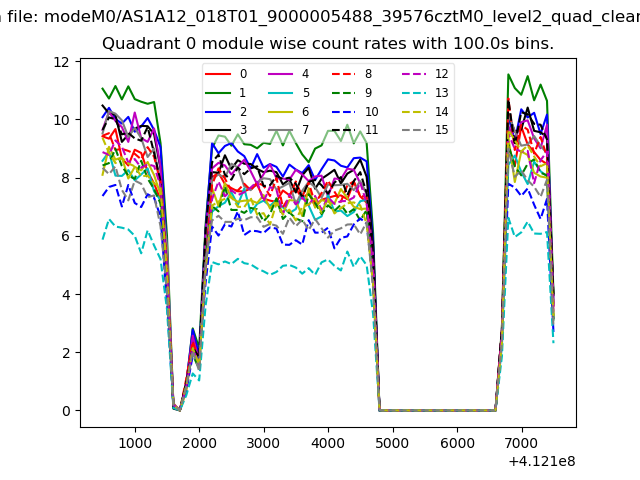 |
 |
| Module-wise count rates for Quadrant B Data is divided into 100 sec bins |
 |
 |
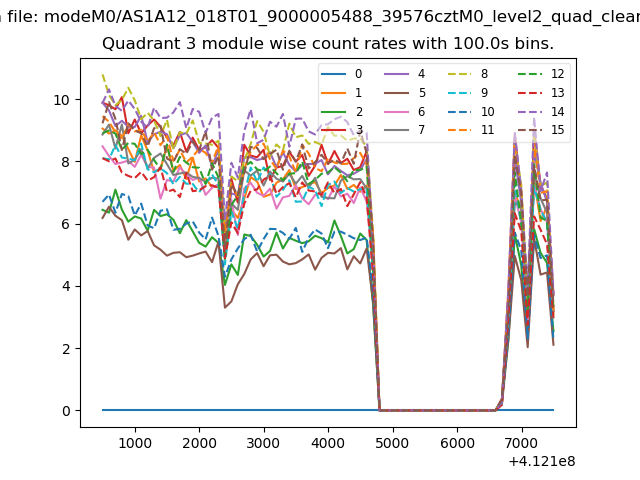
| Module-wise count rates for Quadrant C Data is divided into 100 sec bins |
 |
 |
| Module-wise count rates for Quadrant D Data is divided into 100 sec bins |
 |
 |
| Parameter | Plot |
|---|---|
| CZT HV Monitor | 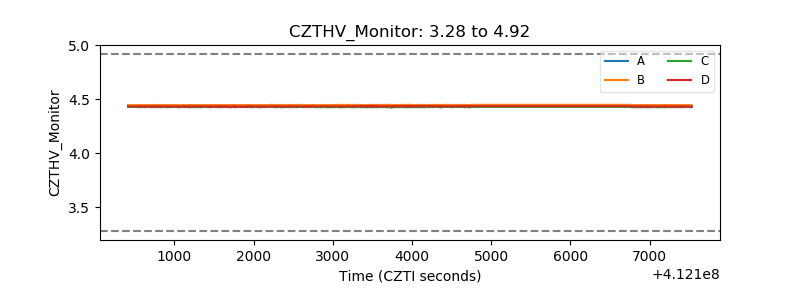 |
| D_VDD | 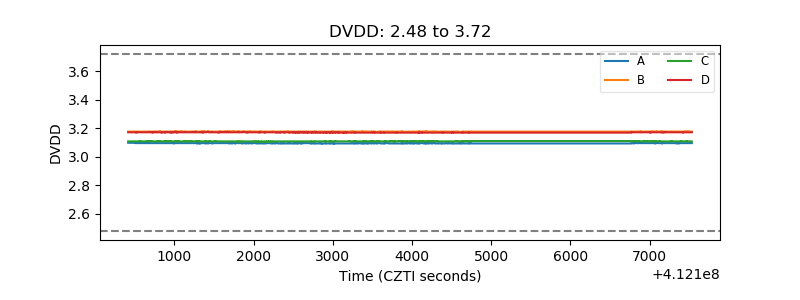 |
| Temperature 1 | 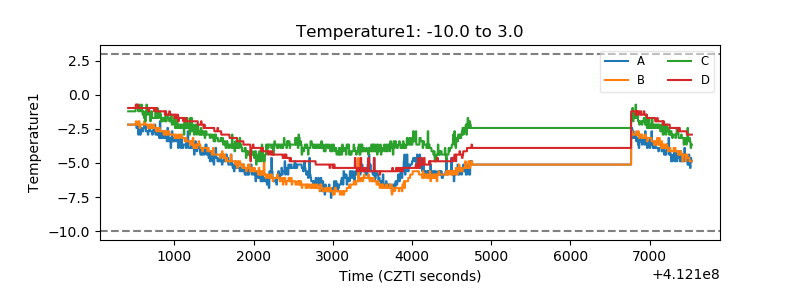 |
| Veto HV Monitor | 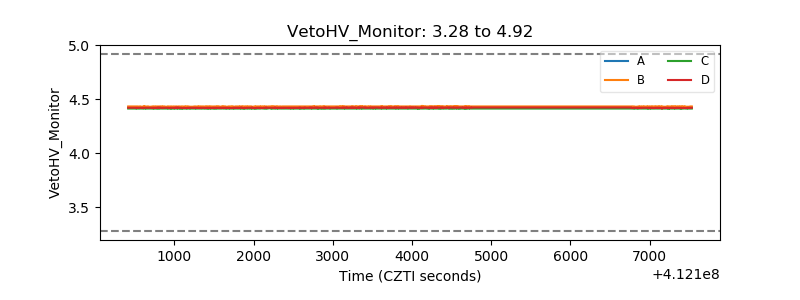 |
| Veto LLD | 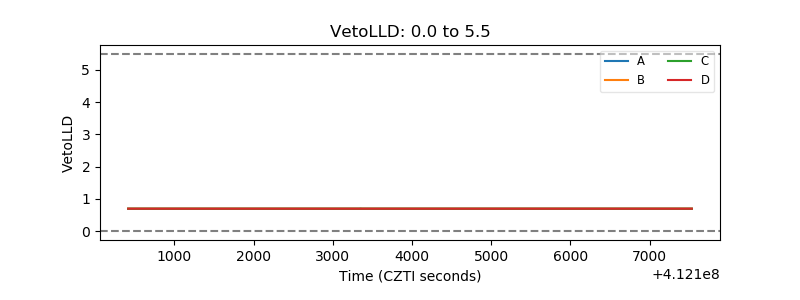 |
| Alpha Counter | 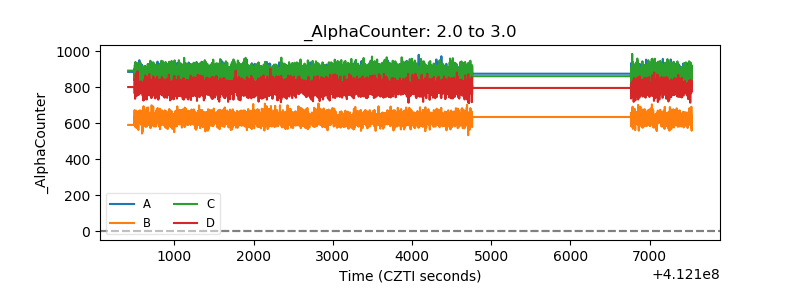 |
| _CPM_Rate | 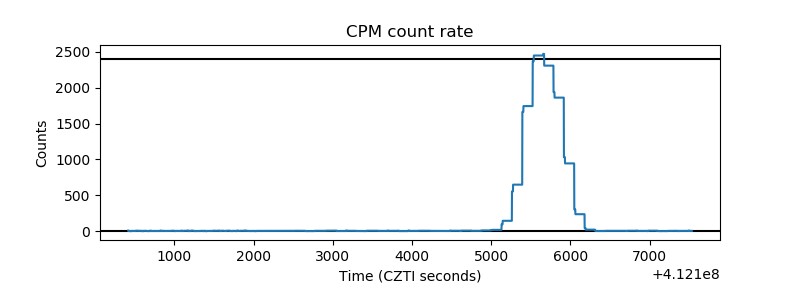 |
| CZT Counter | 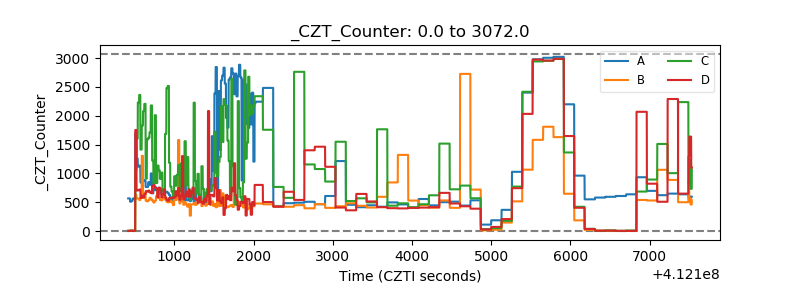 |
| +2.5 Volts monitor | 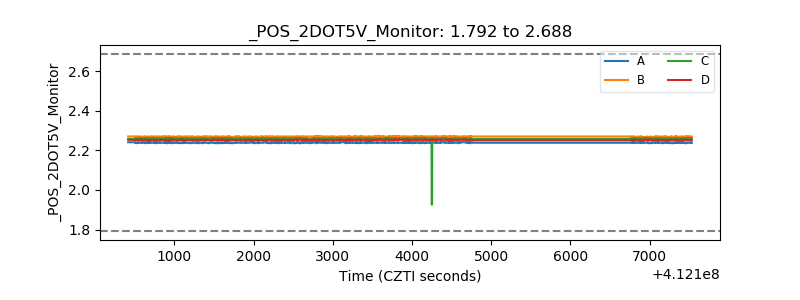 |
| +5 Volts monitor | 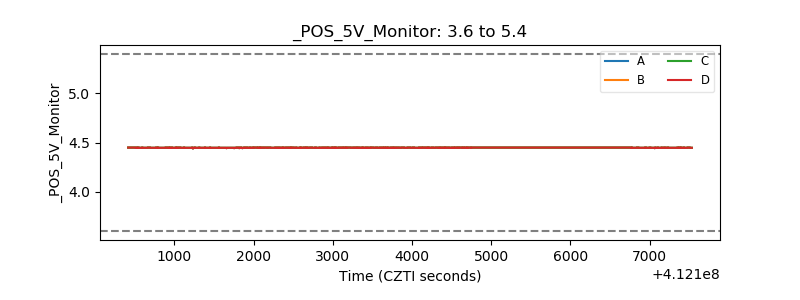 |
| _ROLL_ROT | 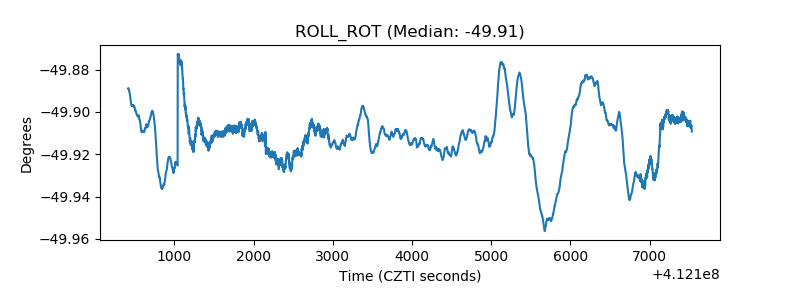 |
| _Roll_DEC | 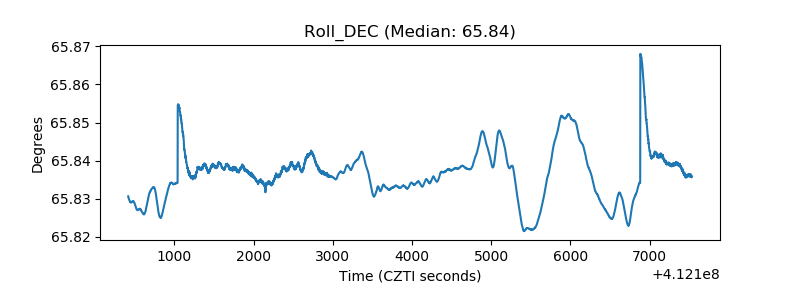 |
| _Roll_RA | 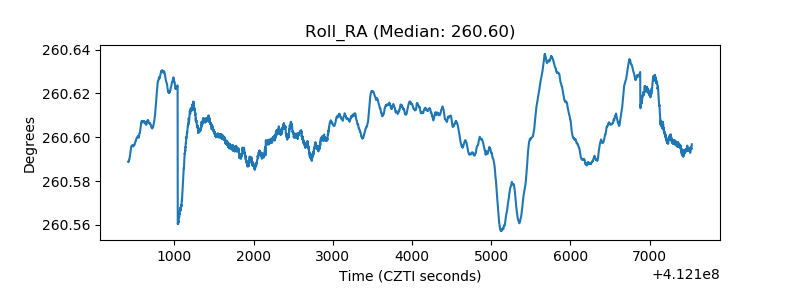 |
| Veto Counter | 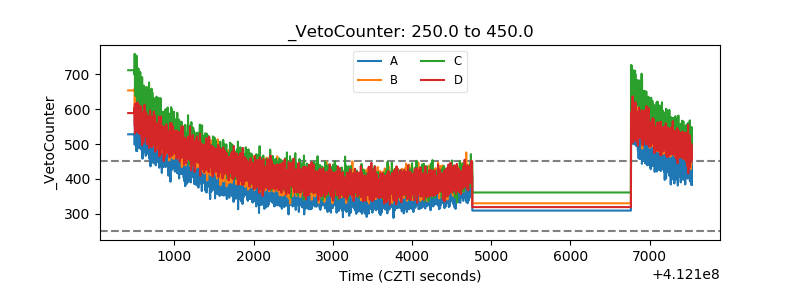 |