| Param | Original file | Final file |
|---|---|---|
| Filename | modeM0/AS1A12_018T01_9000005488_39577cztM0_level2.fits | modeM0/AS1A12_018T01_9000005488_39577cztM0_level2_quad_clean.evt |
| Size (bytes) | 431,919,360 | 89,504,640 |
| Size | 411.9 MB | 85.4 MB |
| Events in quadrant A | 3,330,240 | 628,780 |
| Events in quadrant B | 2,483,965 | 644,319 |
| Events in quadrant C | 4,882,323 | 565,175 |
| Events in quadrant D | 4,907,932 | 525,667 |
| Mode SS | |||
|---|---|---|---|
| Quadrant | BADHDUFLAG | Total packets | Discarded packets |
| A | 0 | 100 | 0 |
| B | 0 | 100 | 0 |
| C | 0 | 100 | 0 |
| D | 0 | 100 | 0 |
| Mode M0 | |||
|---|---|---|---|
| Quadrant | BADHDUFLAG | Total packets | Discarded packets |
| A | 0 | 13367 | 3 |
| B | 0 | 10675 | 2 |
| C | 0 | 17881 | 2 |
| D | 0 | 17989 | 2 |
| Mode M9 | |||
|---|---|---|---|
| Quadrant | BADHDUFLAG | Total packets | Discarded packets |
| A | 0 | 27 | 0 |
| B | 0 | 27 | 0 |
| C | 0 | 27 | 0 |
| D | 0 | 28 | 0 |
| Quadrant | Total seconds | Saturated seconds | Saturation percentage |
|---|---|---|---|
| A | 4943 | 38 | 0.768764% |
| B | 4943 | 63 | 1.274530% |
| C | 4943 | 570 | 11.531459% |
| D | 4943 | 509 | 10.297390% |
Noise dominated data is calculated using 1-second bins in cleaned event files. If a bin has >2000 counts, and if more than 50% of those come from <1% of pixels, then it is considered to be noise-dominated and hence unusable.
| Quadrant | # 1 sec bins | Bins with >0 counts | Bins with >2000 counts | High rate bins dominated by noise | Noise dominated (total time) | Noise dominated (detector-on time) | Marked lightcurve |
|---|---|---|---|---|---|---|---|
| A | 7037 | 4944 | 21 | 21 | 0.30% | 0.42% | 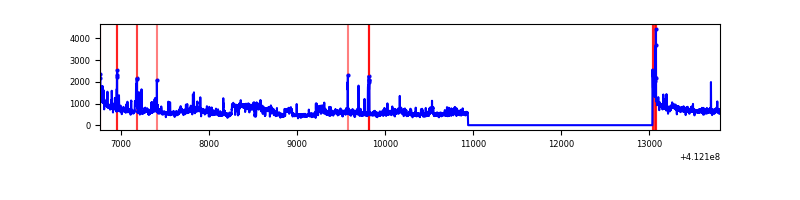 |
| B | 7037 | 4944 | 41 | 41 | 0.58% | 0.83% | 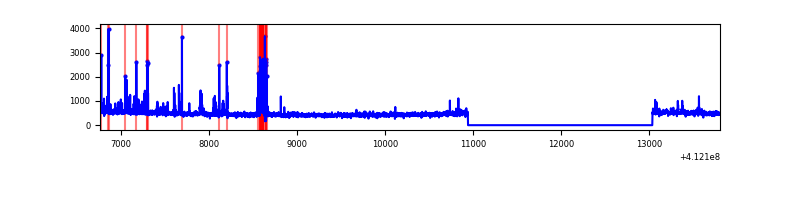 |
| C | 7037 | 4944 | 548 | 548 | 7.79% | 11.08% | 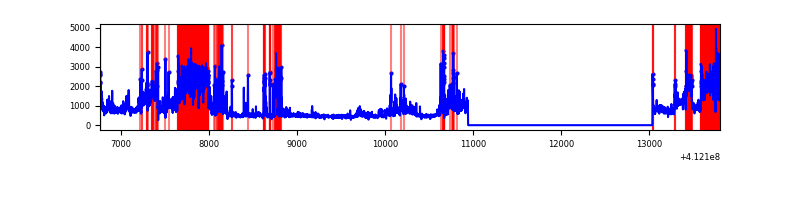 |
| D | 7037 | 4944 | 497 | 497 | 7.06% | 10.05% | 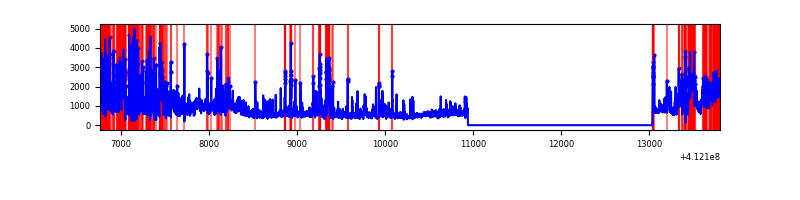 |
Top three noisy pixels from each quadrant. If the there are fewer than three noisy pixels in the level2.evt file, extra rows are filled as -1
| Pixel properties | Quadrant properties | ||||||
|---|---|---|---|---|---|---|---|
| Quadrant | DetID | PixID | Counts | Sigma | Mean | Median | Sigma |
| A | 15 | 222 | 568484 | 4976.58 | 568 | 558 | 114.1 |
| A | 10 | 83 | 425744 | 3725.79 | 568 | 558 | 114.1 |
| A | 9 | 143 | 54785 | 475.18 | 568 | 558 | 114.1 |
| B | 5 | 172 | 199331 | 1873.51 | 566 | 551 | 106.1 |
| B | 5 | 255 | 46577 | 433.8 | 566 | 551 | 106.1 |
| B | 0 | 230 | 17754 | 162.14 | 566 | 551 | 106.1 |
| C | 9 | 187 | 1677872 | 13204.09 | 548 | 553 | 127.0 |
| C | 15 | 208 | 726678 | 5716.16 | 548 | 553 | 127.0 |
| C | 15 | 214 | 204627 | 1606.5 | 548 | 553 | 127.0 |
| D | 12 | 227 | 2074421 | 15733.71 | 537 | 522 | 131.8 |
| D | 13 | 249 | 260431 | 1971.81 | 537 | 522 | 131.8 |
| D | 7 | 38 | 170789 | 1291.74 | 537 | 522 | 131.8 |
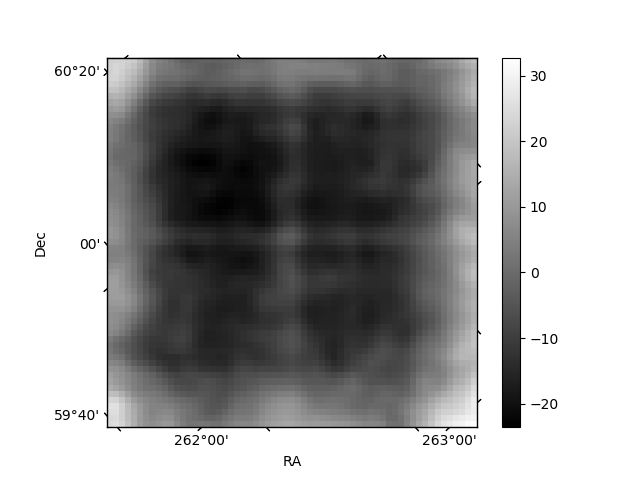
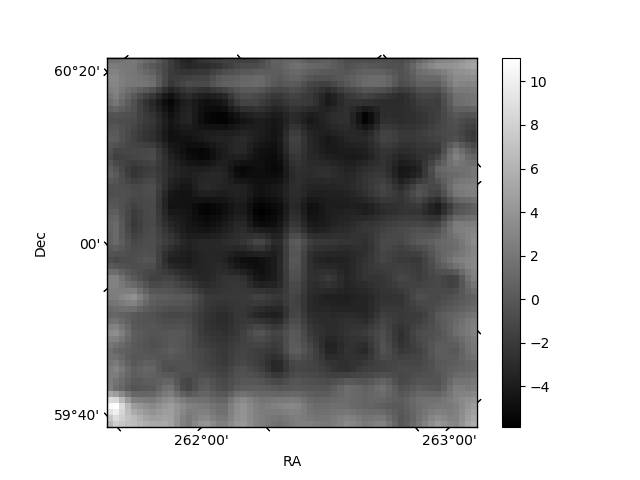
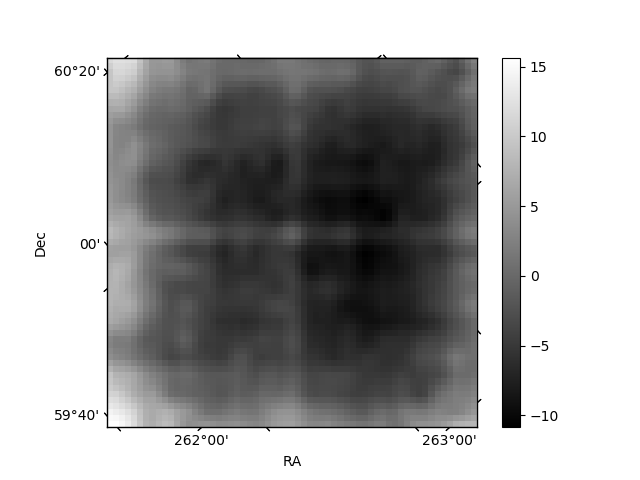
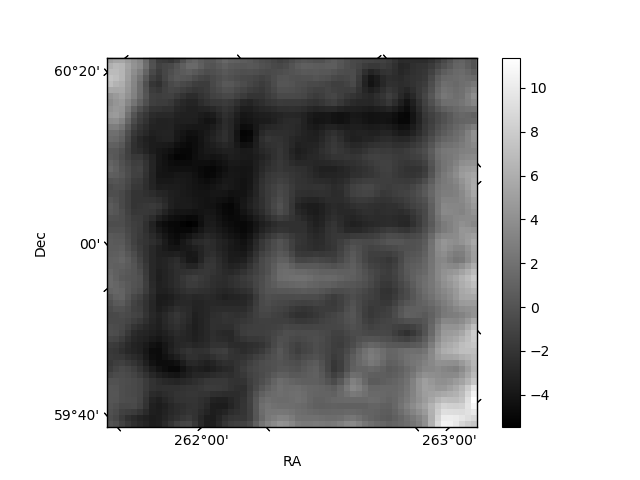
Histogram calculated using DETX and DETY for each event in the final _common_clean file
| Quadrant A | 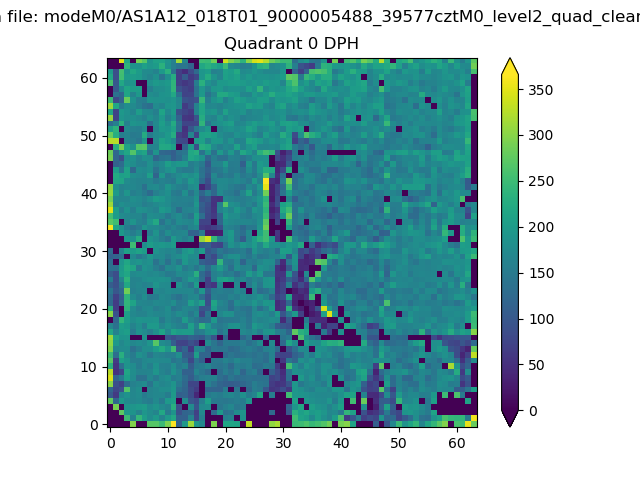 |
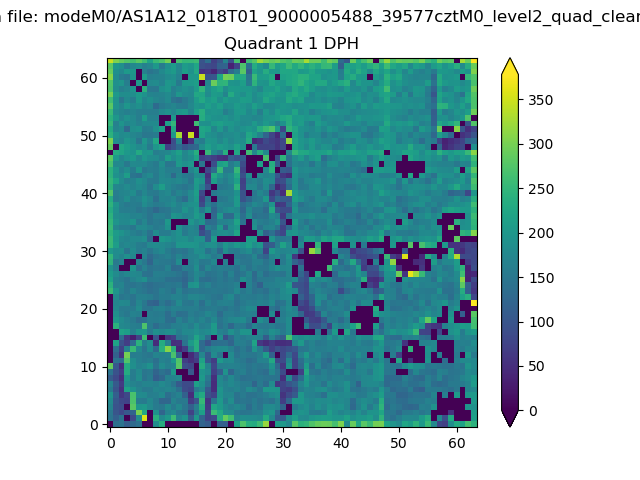 |
Quadrant B |
|---|---|---|---|
| Quadrant D | 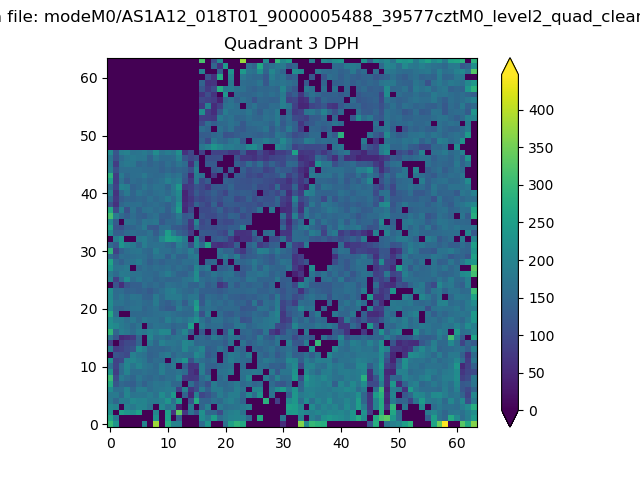 |
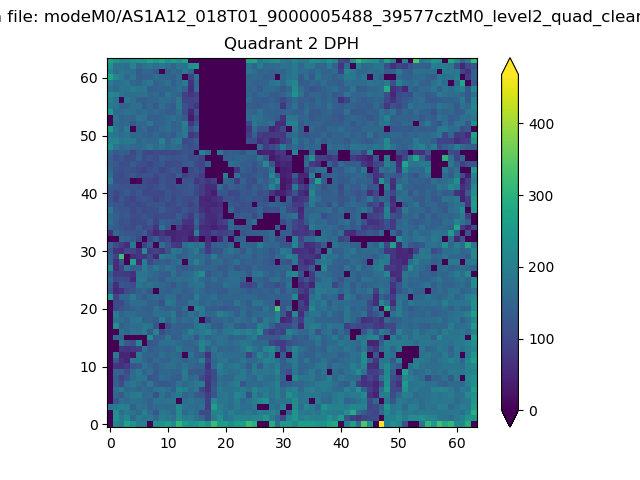 |
Quadrant C |
| Plot type | Count rate plots | Images |
|---|---|---|
| Comparison with Poisson distribution Blue bars denote a histogram of data divided into 1 sec bins. Red curve is a Poisson curve with rate = median count rate of data. |
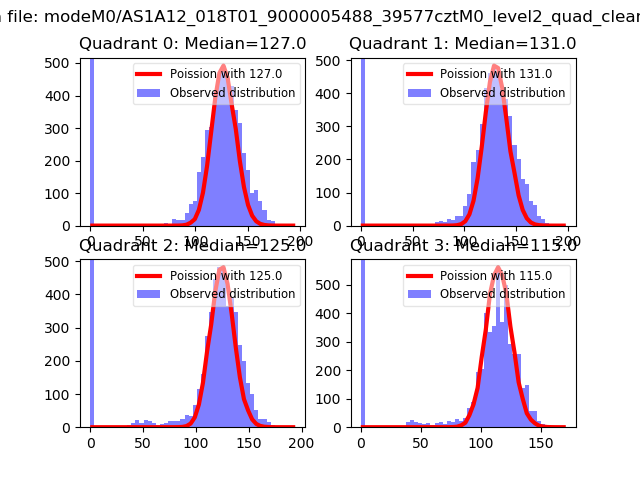 |
 |
| Quadrant-wise count rates Data is divided into 100 sec bins |
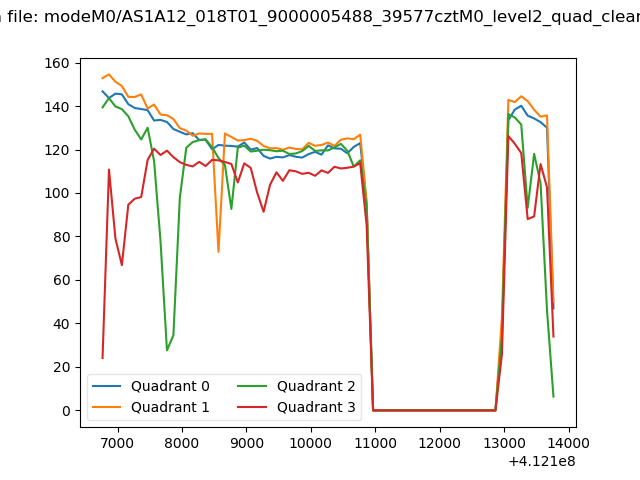 |
|
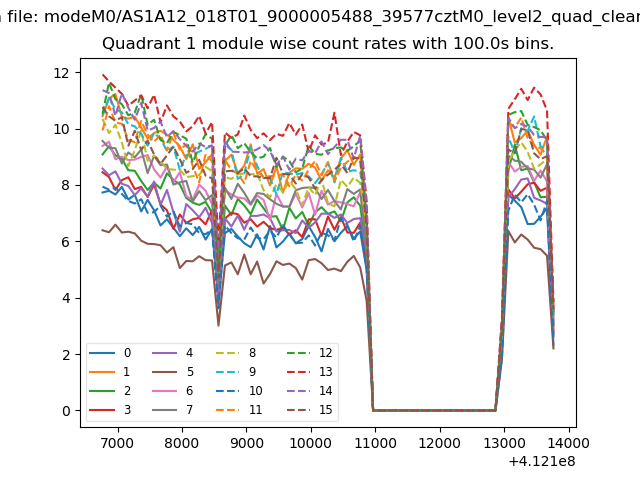
| Module-wise count rates for Quadrant A Data is divided into 100 sec bins |
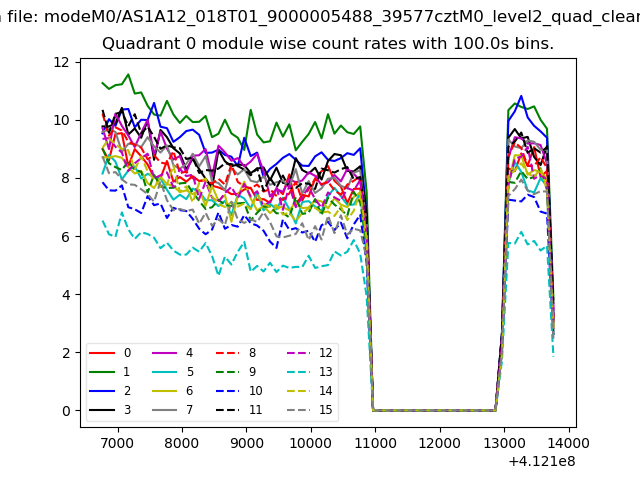 |
 |
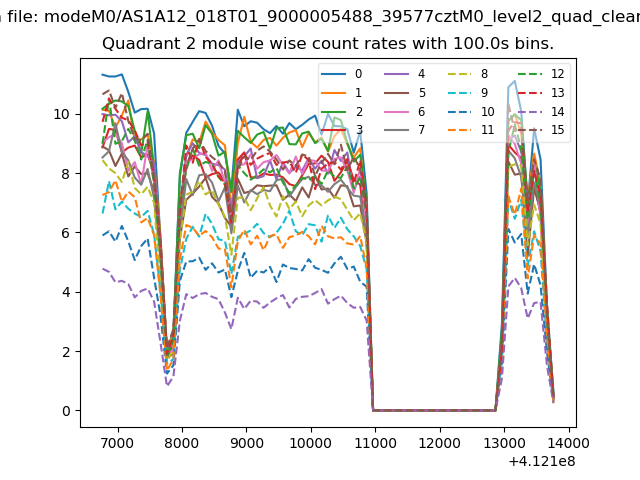
| Module-wise count rates for Quadrant B Data is divided into 100 sec bins |
 |
 |
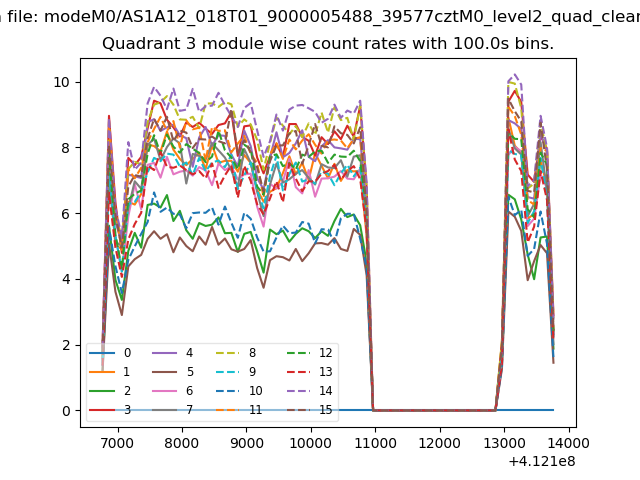
| Module-wise count rates for Quadrant C Data is divided into 100 sec bins |
 |
 |
| Module-wise count rates for Quadrant D Data is divided into 100 sec bins |
 |
 |
| Parameter | Plot |
|---|---|
| CZT HV Monitor | 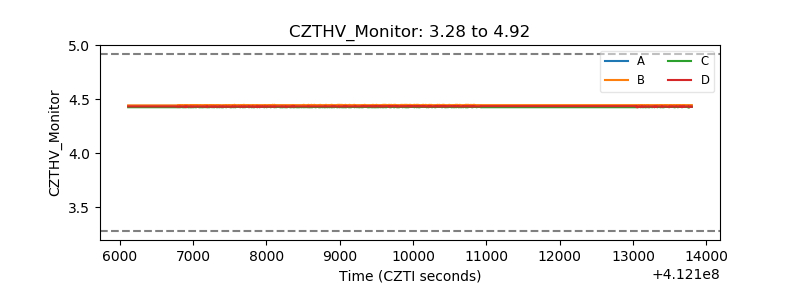 |
| D_VDD | 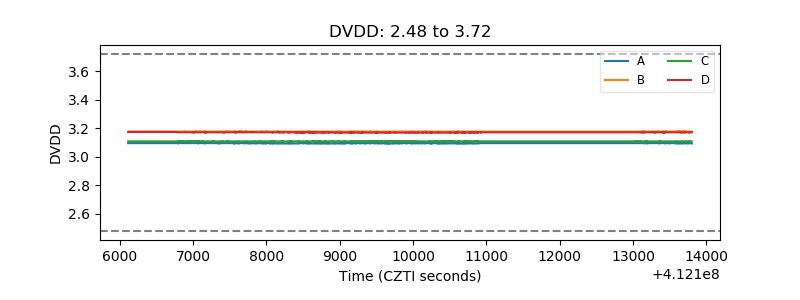 |
| Temperature 1 | 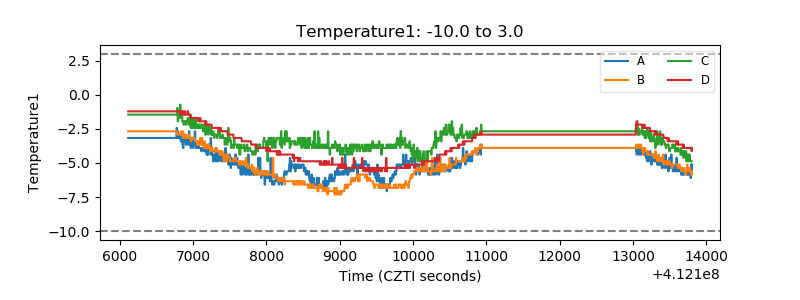 |
| Veto HV Monitor | 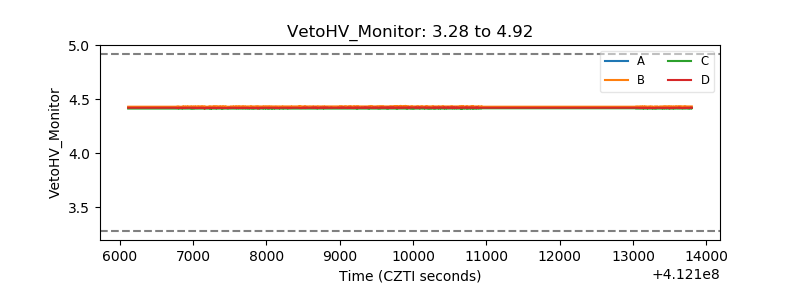 |
| Veto LLD | 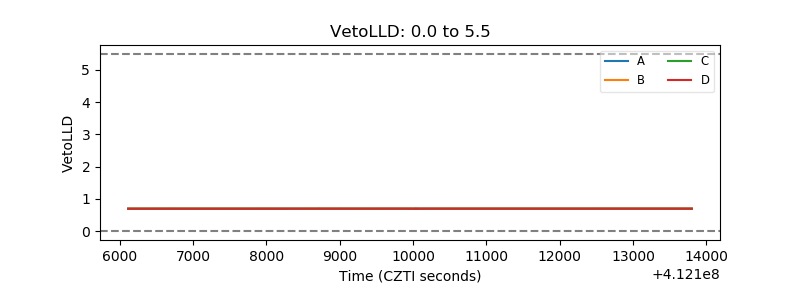 |
| Alpha Counter | 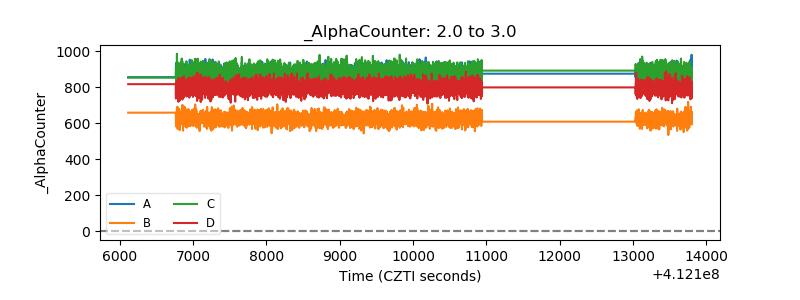 |
| _CPM_Rate | 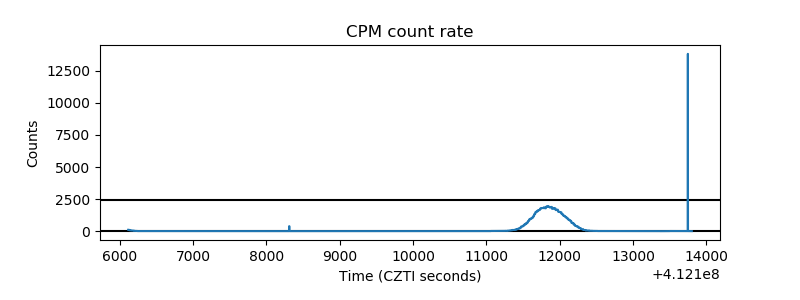 |
| CZT Counter | 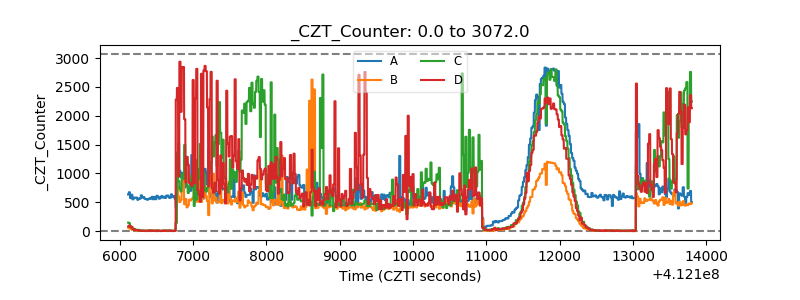 |
| +2.5 Volts monitor | 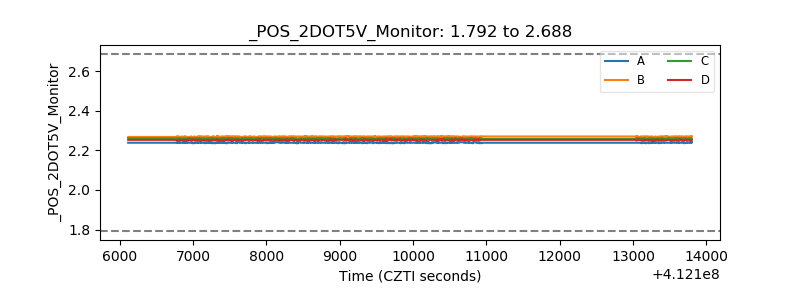 |
| +5 Volts monitor | 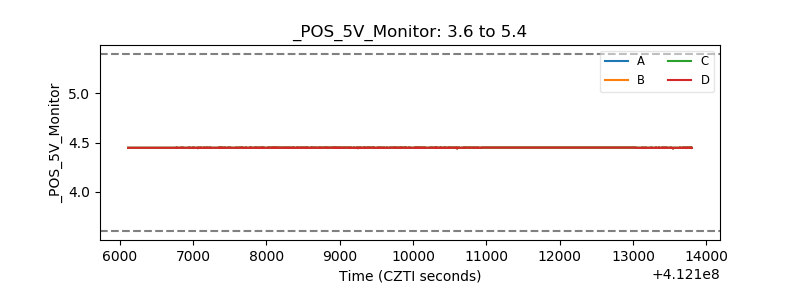 |
| _ROLL_ROT | 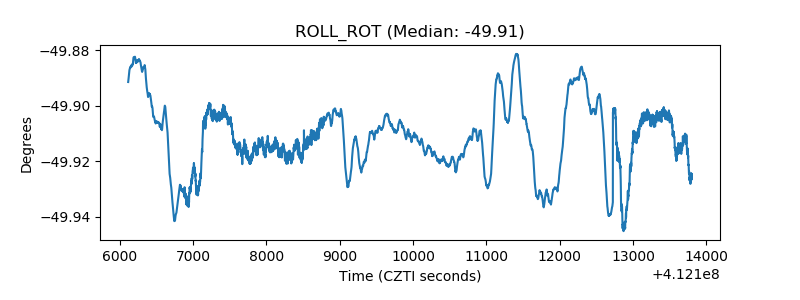 |
| _Roll_DEC | 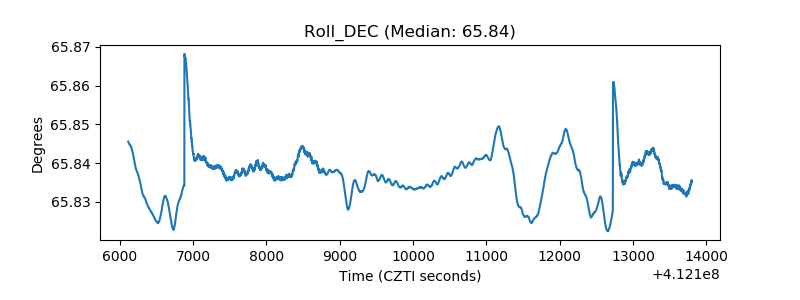 |
| _Roll_RA | 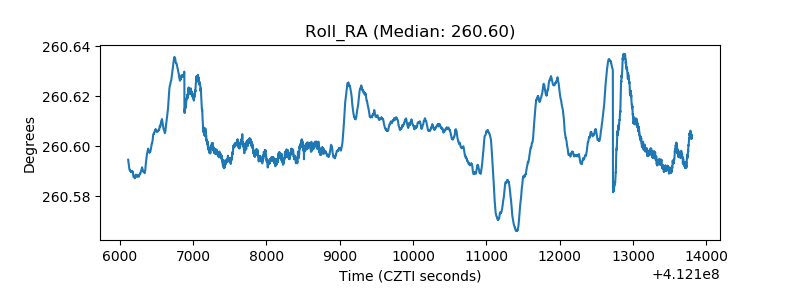 |
| Veto Counter | 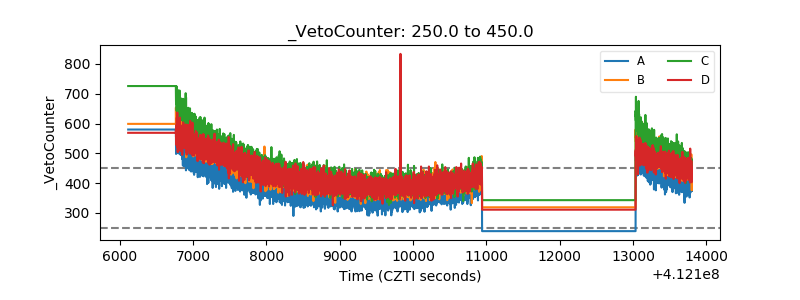 |