| Param | Original file | Final file |
|---|---|---|
| Filename | modeM0/AS1A12_018T01_9000005488_39579cztM0_level2.fits | modeM0/AS1A12_018T01_9000005488_39579cztM0_level2_quad_clean.evt |
| Size (bytes) | 400,910,400 | 80,133,120 |
| Size | 382.3 MB | 76.4 MB |
| Events in quadrant A | 3,190,360 | 560,995 |
| Events in quadrant B | 2,212,707 | 579,822 |
| Events in quadrant C | 5,894,074 | 442,912 |
| Events in quadrant D | 3,162,296 | 499,273 |
| Mode SS | |||
|---|---|---|---|
| Quadrant | BADHDUFLAG | Total packets | Discarded packets |
| A | 0 | 100 | 0 |
| B | 0 | 100 | 0 |
| C | 0 | 100 | 0 |
| D | 0 | 100 | 0 |
| Mode M0 | |||
|---|---|---|---|
| Quadrant | BADHDUFLAG | Total packets | Discarded packets |
| A | 0 | 12728 | 3 |
| B | 0 | 10182 | 2 |
| C | 0 | 21021 | 2 |
| D | 0 | 13087 | 2 |
| Mode M9 | |||
|---|---|---|---|
| Quadrant | BADHDUFLAG | Total packets | Discarded packets |
| A | 0 | 35 | 0 |
| B | 0 | 35 | 0 |
| C | 0 | 35 | 0 |
| D | 0 | 36 | 0 |
| Quadrant | Total seconds | Saturated seconds | Saturation percentage |
|---|---|---|---|
| A | 4895 | 67 | 1.368744% |
| B | 4895 | 25 | 0.510725% |
| C | 4895 | 1118 | 22.839632% |
| D | 4895 | 248 | 5.066394% |
Noise dominated data is calculated using 1-second bins in cleaned event files. If a bin has >2000 counts, and if more than 50% of those come from <1% of pixels, then it is considered to be noise-dominated and hence unusable.
| Quadrant | # 1 sec bins | Bins with >0 counts | Bins with >2000 counts | High rate bins dominated by noise | Noise dominated (total time) | Noise dominated (detector-on time) | Marked lightcurve |
|---|---|---|---|---|---|---|---|
| A | 6958 | 4896 | 53 | 53 | 0.76% | 1.08% | 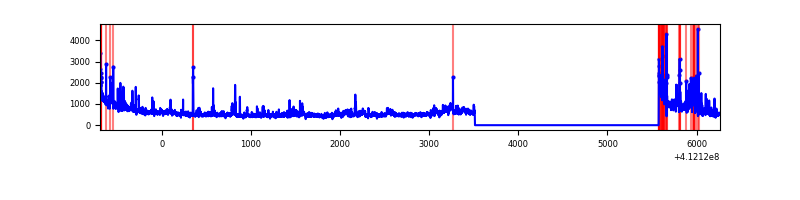 |
| B | 6958 | 4896 | 13 | 13 | 0.19% | 0.27% | 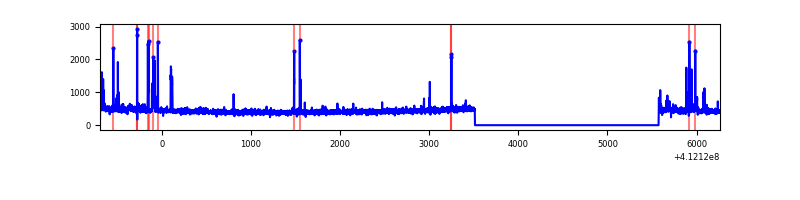 |
| C | 6958 | 4896 | 963 | 963 | 13.84% | 19.67% | 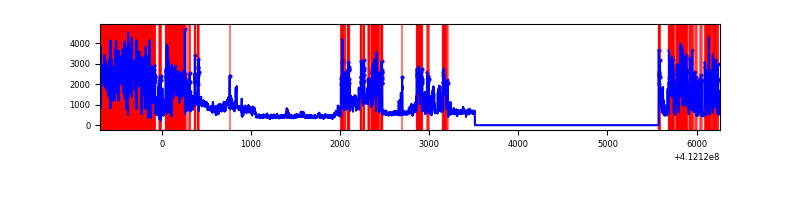 |
| D | 6958 | 4896 | 216 | 216 | 3.10% | 4.41% | 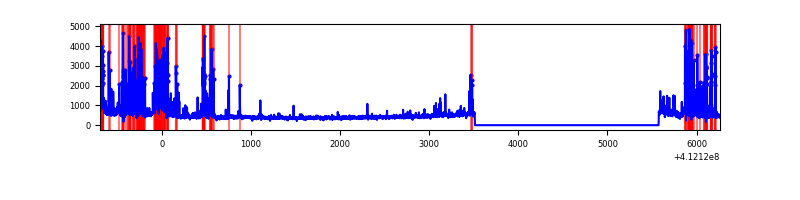 |
Top three noisy pixels from each quadrant. If the there are fewer than three noisy pixels in the level2.evt file, extra rows are filled as -1
| Pixel properties | Quadrant properties | ||||||
|---|---|---|---|---|---|---|---|
| Quadrant | DetID | PixID | Counts | Sigma | Mean | Median | Sigma |
| A | 15 | 222 | 437817 | 4106.33 | 523 | 512 | 106.5 |
| A | 10 | 83 | 401529 | 3765.58 | 523 | 512 | 106.5 |
| A | 13 | 248 | 207055 | 1939.45 | 523 | 512 | 106.5 |
| B | 5 | 172 | 121125 | 1207.77 | 526 | 512 | 99.9 |
| B | 5 | 255 | 26015 | 255.38 | 526 | 512 | 99.9 |
| B | 12 | 111 | 12529 | 120.33 | 526 | 512 | 99.9 |
| C | 9 | 187 | 2326099 | 21775.72 | 459 | 463 | 106.8 |
| C | 15 | 208 | 1561075 | 14612.54 | 459 | 463 | 106.8 |
| C | 15 | 214 | 196715 | 1837.57 | 459 | 463 | 106.8 |
| D | 12 | 227 | 1006987 | 8122.75 | 503 | 488 | 123.9 |
| D | 13 | 249 | 115500 | 928.18 | 503 | 488 | 123.9 |
| D | 1 | 52 | 63205 | 506.15 | 503 | 488 | 123.9 |
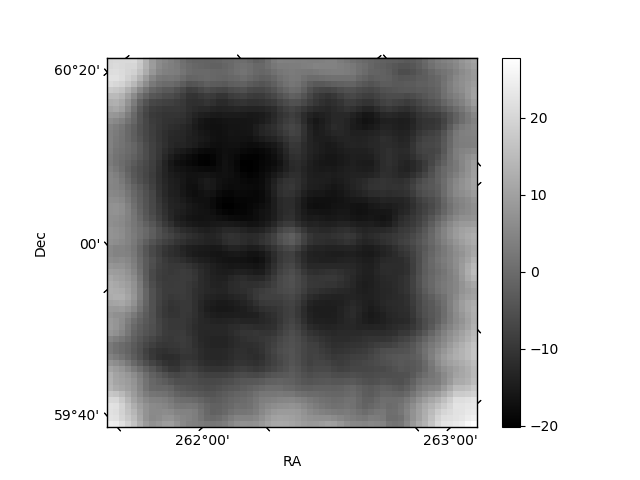
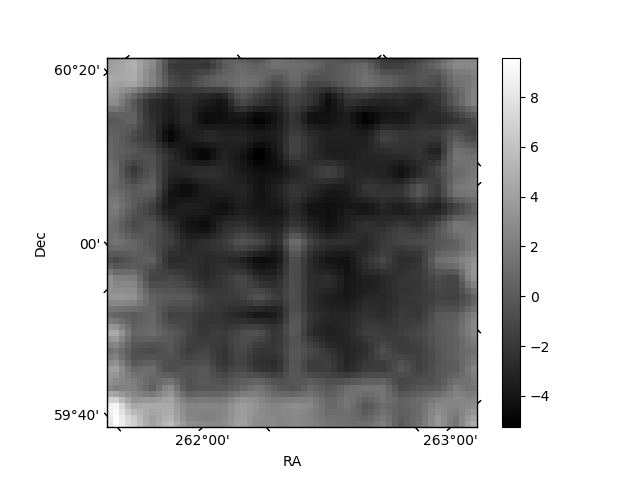
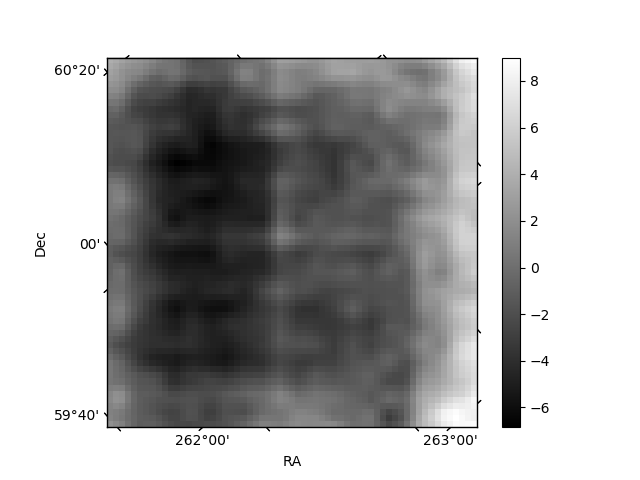
Histogram calculated using DETX and DETY for each event in the final _common_clean file
| Quadrant A | 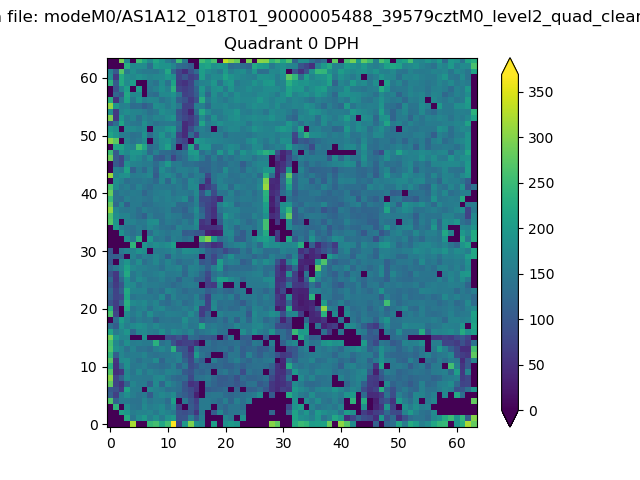 |
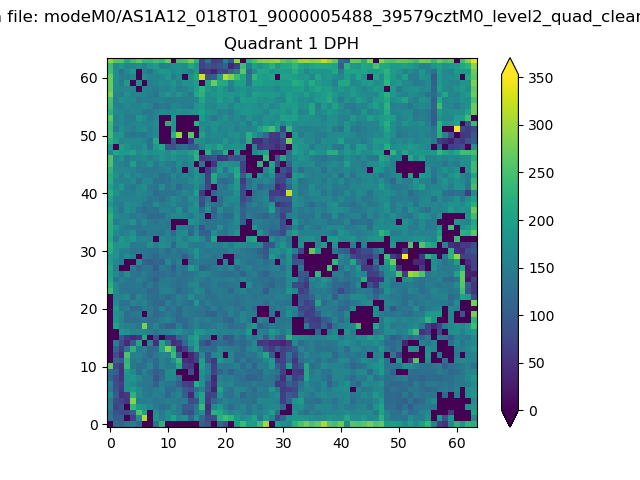 |
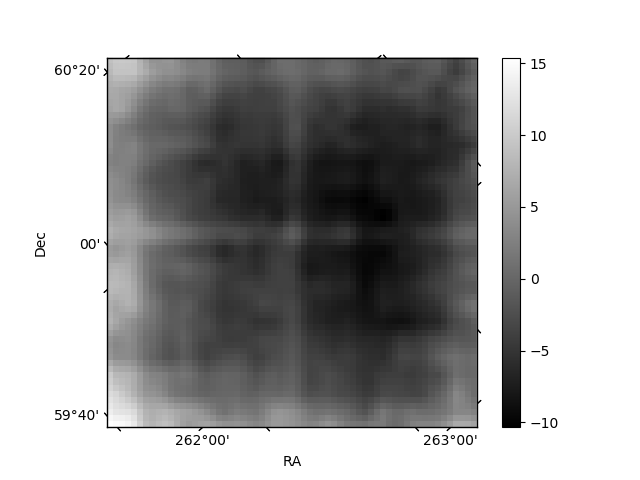
Quadrant B |
|---|---|---|---|
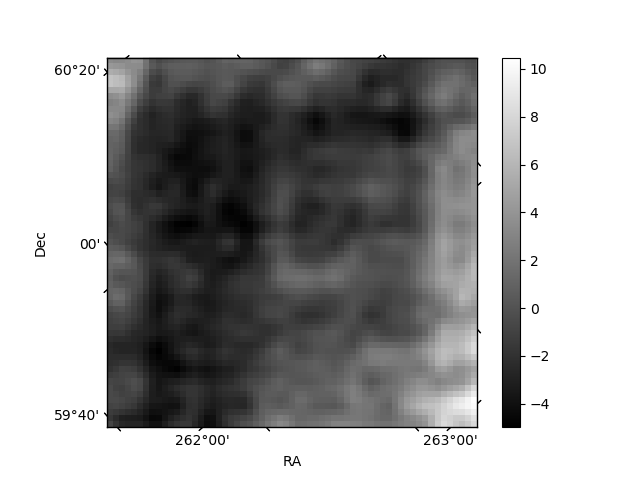
| Quadrant D | 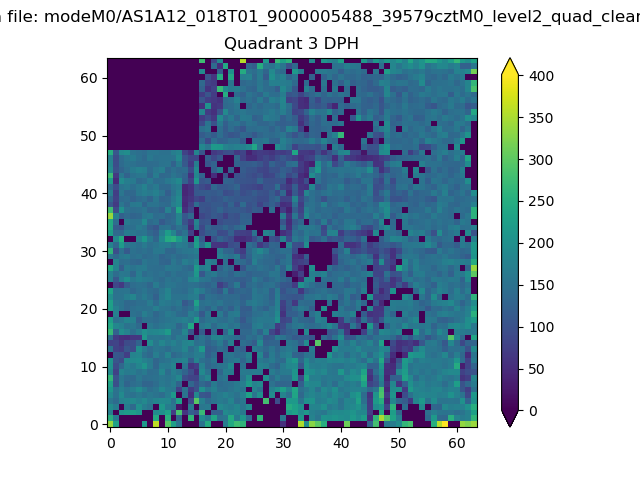 |
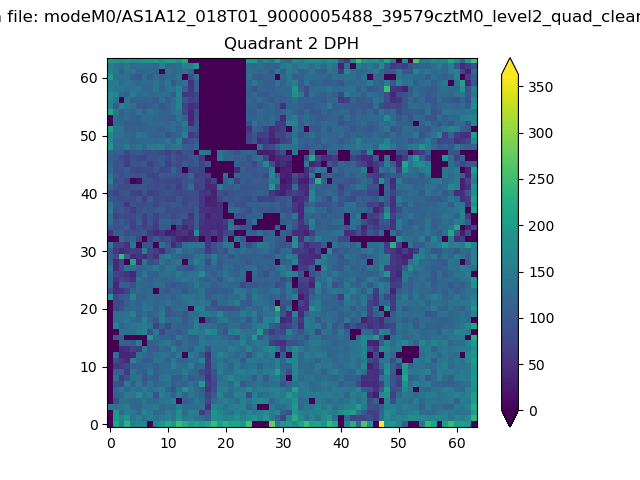 |
Quadrant C |
| Plot type | Count rate plots | Images |
|---|---|---|
| Comparison with Poisson distribution Blue bars denote a histogram of data divided into 1 sec bins. Red curve is a Poisson curve with rate = median count rate of data. |
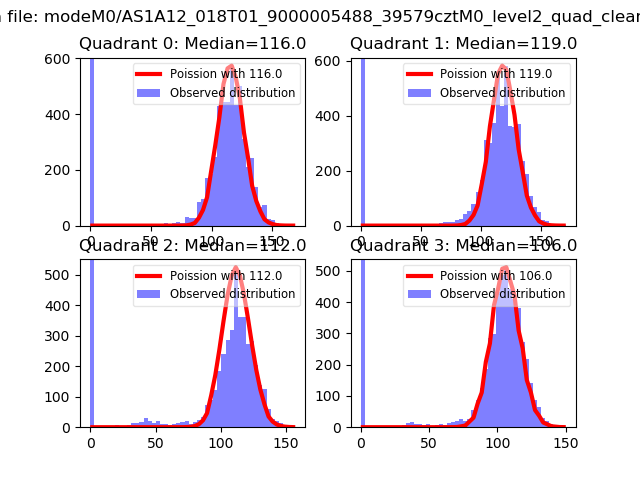 |
 |
| Quadrant-wise count rates Data is divided into 100 sec bins |
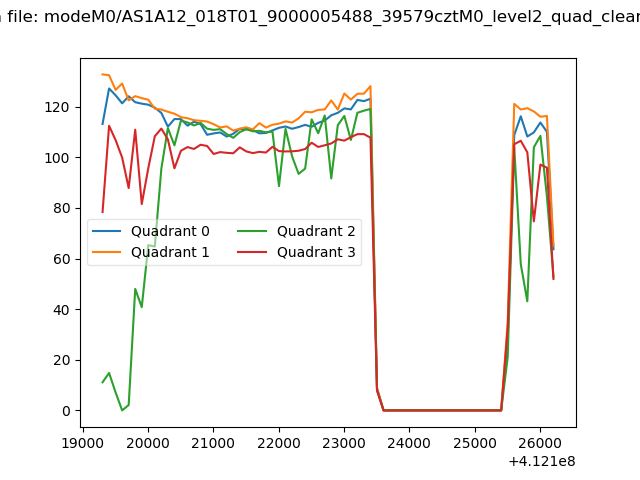 |
|
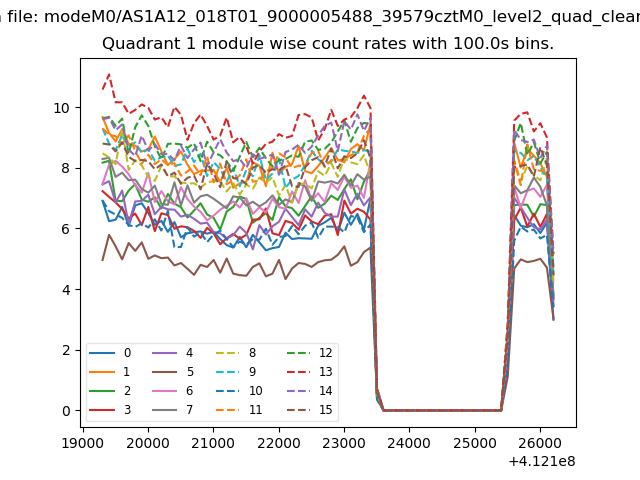
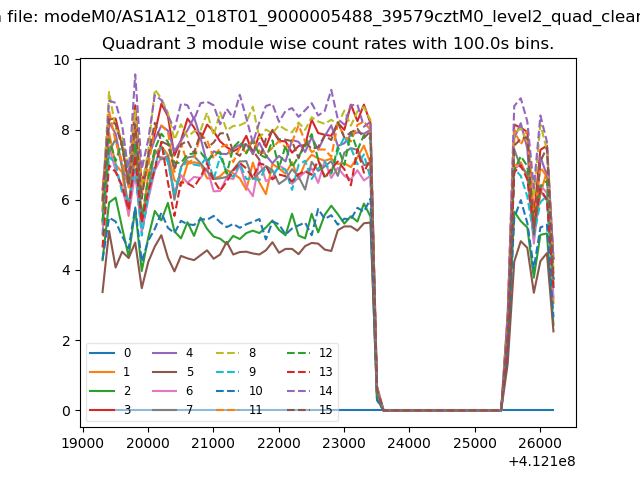
| Module-wise count rates for Quadrant A Data is divided into 100 sec bins |
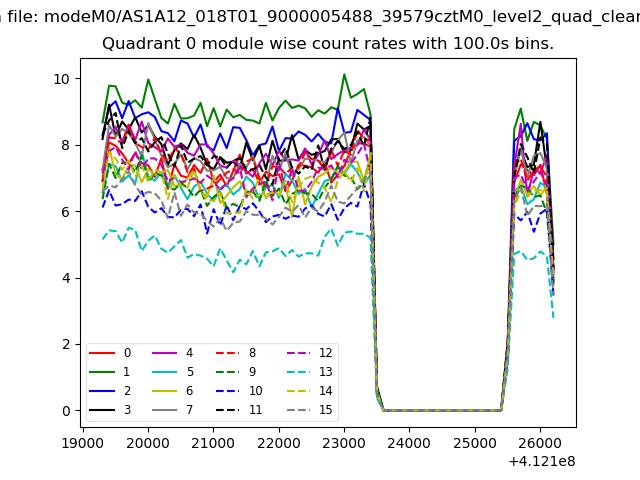 |
 |
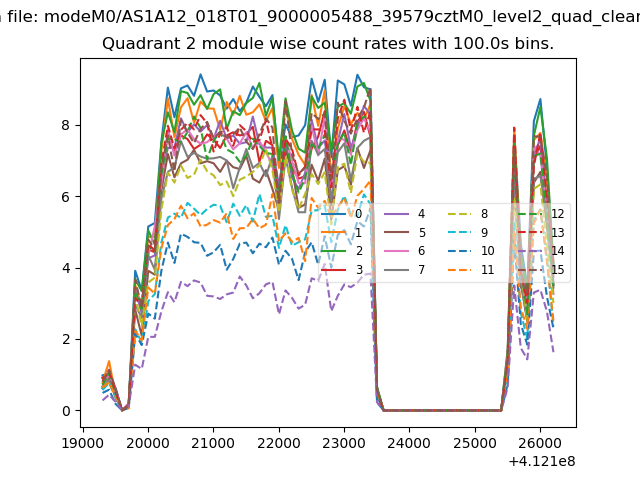
| Module-wise count rates for Quadrant B Data is divided into 100 sec bins |
 |
 |
| Module-wise count rates for Quadrant C Data is divided into 100 sec bins |
 |
 |
| Module-wise count rates for Quadrant D Data is divided into 100 sec bins |
 |
 |
| Parameter | Plot |
|---|---|
| CZT HV Monitor | 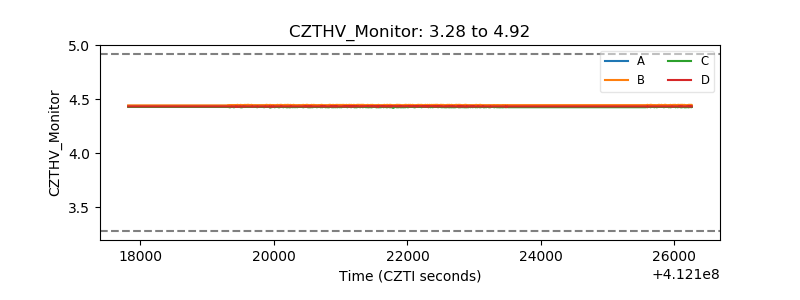 |
| D_VDD | 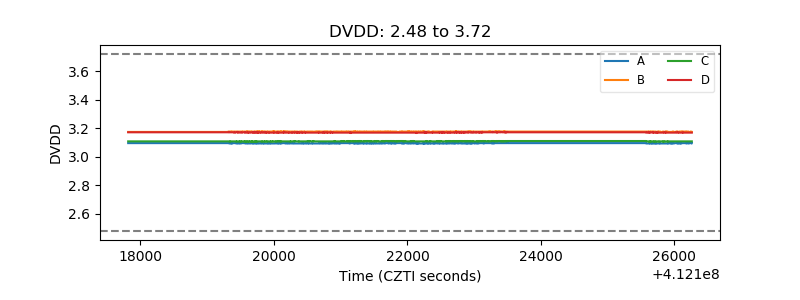 |
| Temperature 1 | 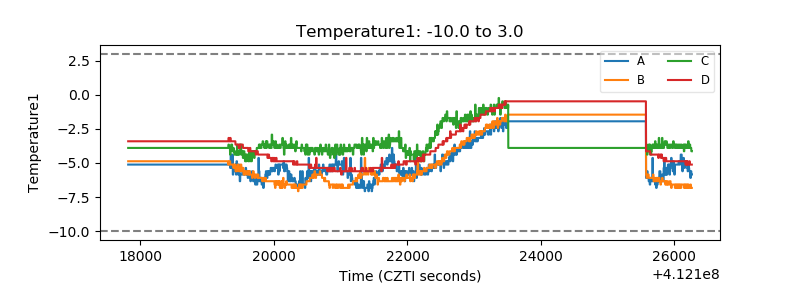 |
| Veto HV Monitor | 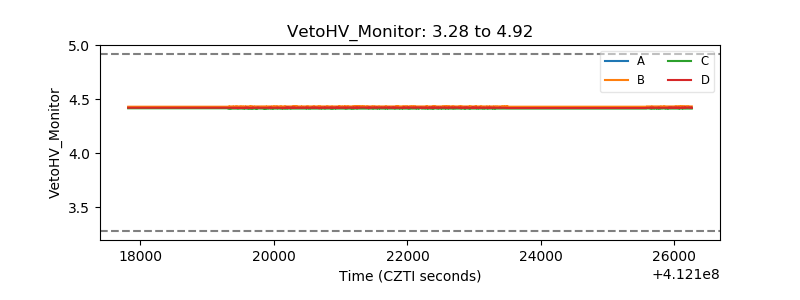 |
| Veto LLD | 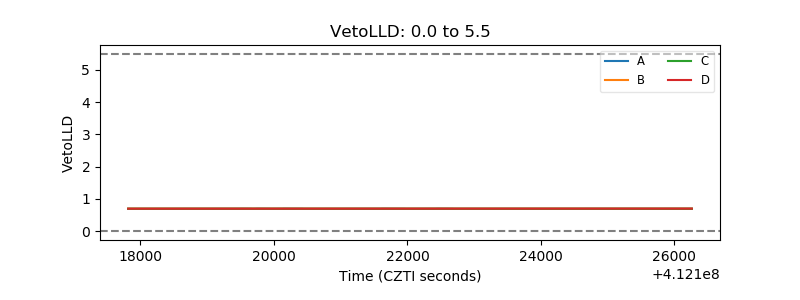 |
| Alpha Counter | 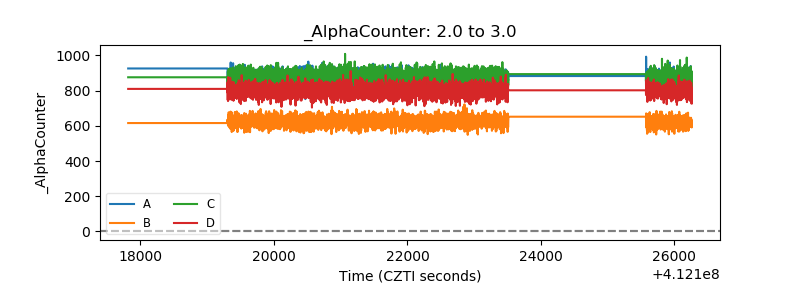 |
| _CPM_Rate | 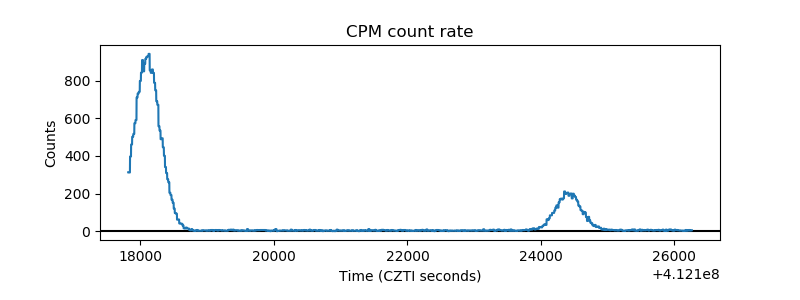 |
| CZT Counter | 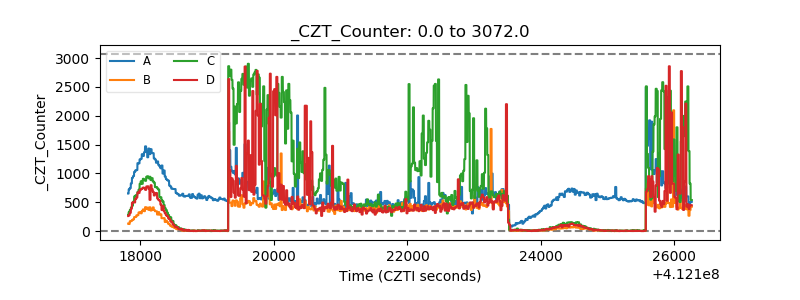 |
| +2.5 Volts monitor |  |
| +5 Volts monitor | 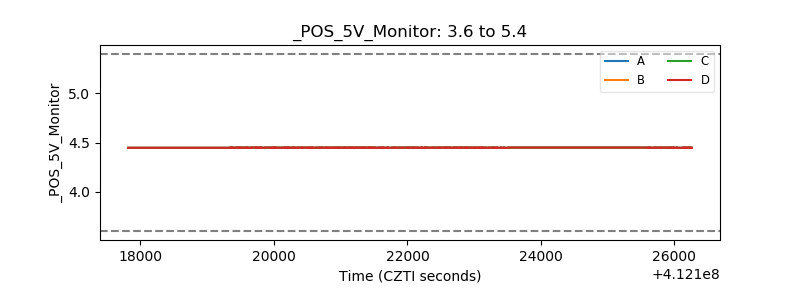 |
| _ROLL_ROT | 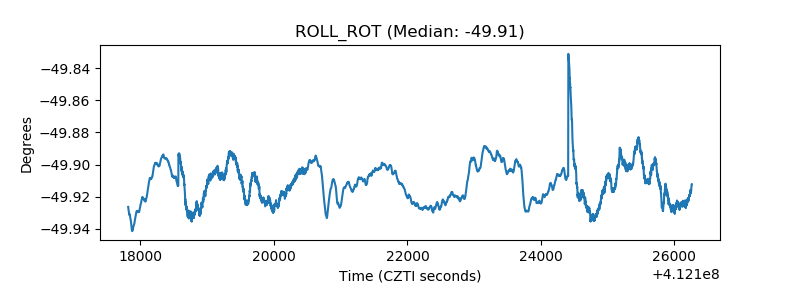 |
| _Roll_DEC | 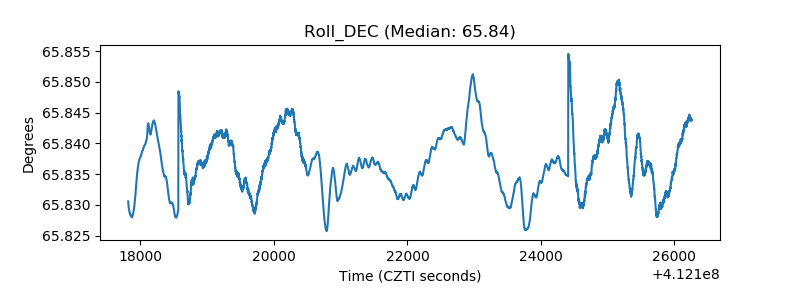 |
| _Roll_RA | 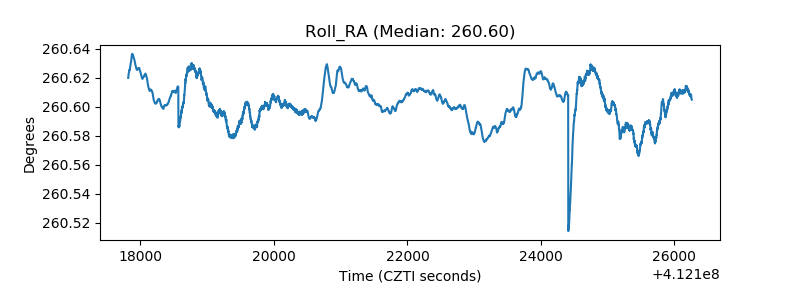 |
| Veto Counter | 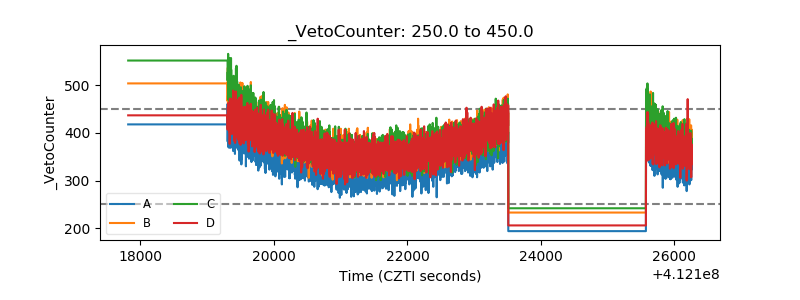 |