| Param | Original file | Final file |
|---|---|---|
| Filename | modeM0/AS1A12_018T01_9000005488_39580cztM0_level2.fits | modeM0/AS1A12_018T01_9000005488_39580cztM0_level2_quad_clean.evt |
| Size (bytes) | 435,657,600 | 88,571,520 |
| Size | 415.5 MB | 84.5 MB |
| Events in quadrant A | 3,751,133 | 603,973 |
| Events in quadrant B | 2,605,748 | 622,243 |
| Events in quadrant C | 5,733,618 | 530,951 |
| Events in quadrant D | 3,607,633 | 538,759 |
| Mode SS | |||
|---|---|---|---|
| Quadrant | BADHDUFLAG | Total packets | Discarded packets |
| A | 0 | 112 | 0 |
| B | 0 | 112 | 0 |
| C | 0 | 112 | 0 |
| D | 0 | 112 | 0 |
| Mode M0 | |||
|---|---|---|---|
| Quadrant | BADHDUFLAG | Total packets | Discarded packets |
| A | 0 | 14893 | 3 |
| B | 0 | 11839 | 2 |
| C | 0 | 20822 | 2 |
| D | 0 | 14886 | 2 |
| Mode M9 | |||
|---|---|---|---|
| Quadrant | BADHDUFLAG | Total packets | Discarded packets |
| A | 0 | 36 | 0 |
| B | 0 | 36 | 0 |
| C | 0 | 36 | 0 |
| D | 0 | 37 | 0 |
| Quadrant | Total seconds | Saturated seconds | Saturation percentage |
|---|---|---|---|
| A | 5516 | 84 | 1.522843% |
| B | 5516 | 62 | 1.124003% |
| C | 5516 | 818 | 14.829587% |
| D | 5516 | 266 | 4.822335% |
Noise dominated data is calculated using 1-second bins in cleaned event files. If a bin has >2000 counts, and if more than 50% of those come from <1% of pixels, then it is considered to be noise-dominated and hence unusable.
| Quadrant | # 1 sec bins | Bins with >0 counts | Bins with >2000 counts | High rate bins dominated by noise | Noise dominated (total time) | Noise dominated (detector-on time) | Marked lightcurve |
|---|---|---|---|---|---|---|---|
| A | 7338 | 5517 | 65 | 65 | 0.89% | 1.18% | 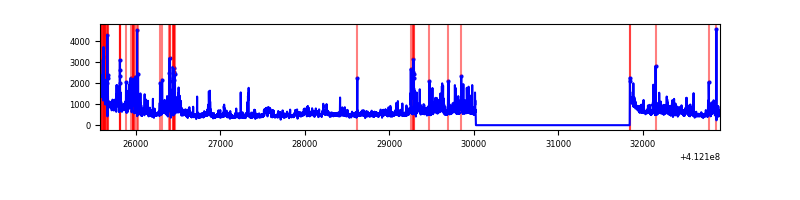 |
| B | 7338 | 5517 | 38 | 38 | 0.52% | 0.69% | 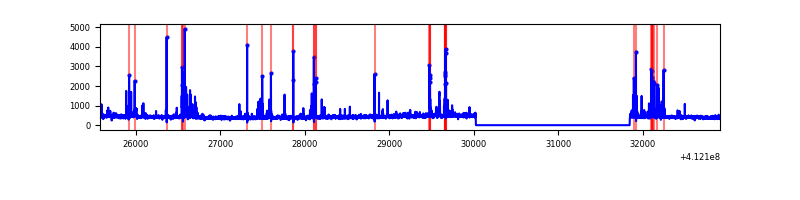 |
| C | 7338 | 5517 | 736 | 736 | 10.03% | 13.34% | 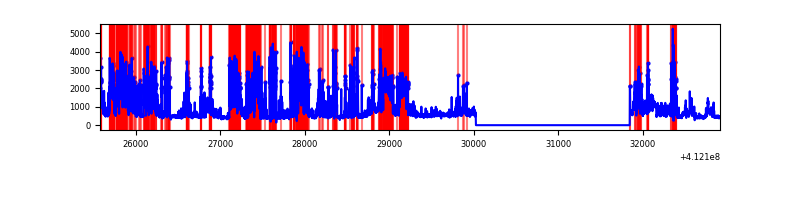 |
| D | 7338 | 5517 | 222 | 222 | 3.03% | 4.02% | 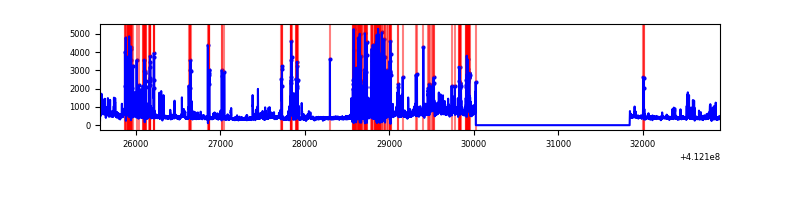 |
Top three noisy pixels from each quadrant. If the there are fewer than three noisy pixels in the level2.evt file, extra rows are filled as -1
| Pixel properties | Quadrant properties | ||||||
|---|---|---|---|---|---|---|---|
| Quadrant | DetID | PixID | Counts | Sigma | Mean | Median | Sigma |
| A | 13 | 248 | 528066 | 4453.19 | 577 | 565 | 118.5 |
| A | 10 | 83 | 435399 | 3670.89 | 577 | 565 | 118.5 |
| A | 15 | 222 | 382373 | 3223.24 | 577 | 565 | 118.5 |
| B | 5 | 255 | 221119 | 2003.88 | 576 | 560 | 110.1 |
| B | 5 | 172 | 112283 | 1015.05 | 576 | 560 | 110.1 |
| B | 12 | 111 | 14155 | 123.52 | 576 | 560 | 110.1 |
| C | 9 | 187 | 1971782 | 15568.1 | 539 | 541 | 126.6 |
| C | 15 | 208 | 1400882 | 11059.35 | 539 | 541 | 126.6 |
| C | 15 | 214 | 235701 | 1857.2 | 539 | 541 | 126.6 |
| D | 12 | 227 | 1239594 | 9154.47 | 550 | 533 | 135.4 |
| D | 13 | 249 | 122613 | 901.95 | 550 | 533 | 135.4 |
| D | 1 | 52 | 107811 | 792.59 | 550 | 533 | 135.4 |
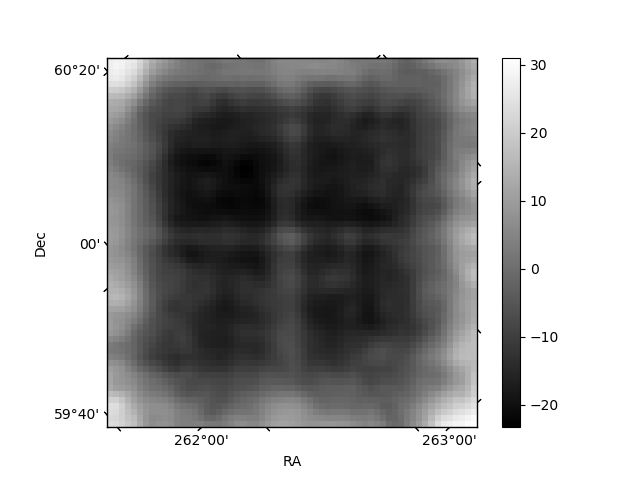
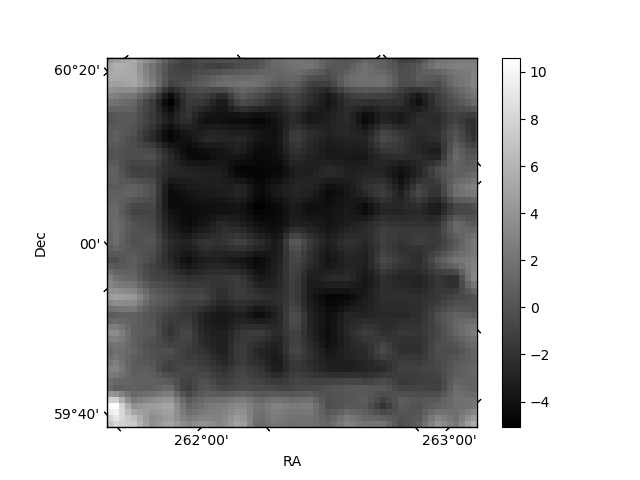
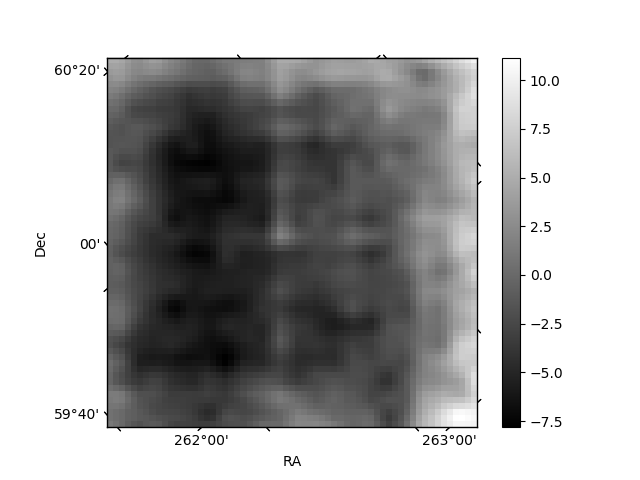
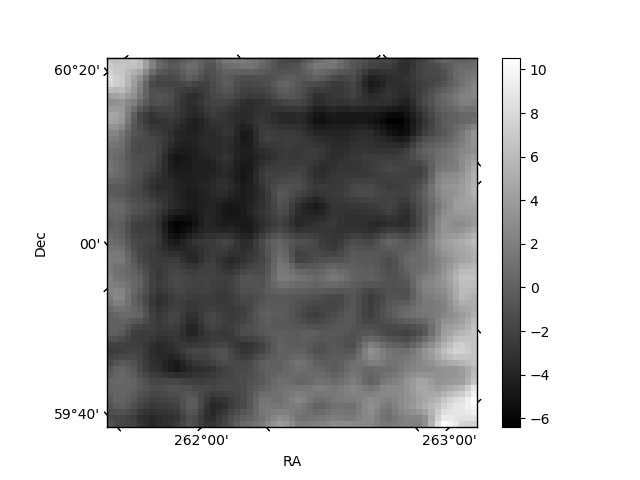
Histogram calculated using DETX and DETY for each event in the final _common_clean file
| Quadrant A | 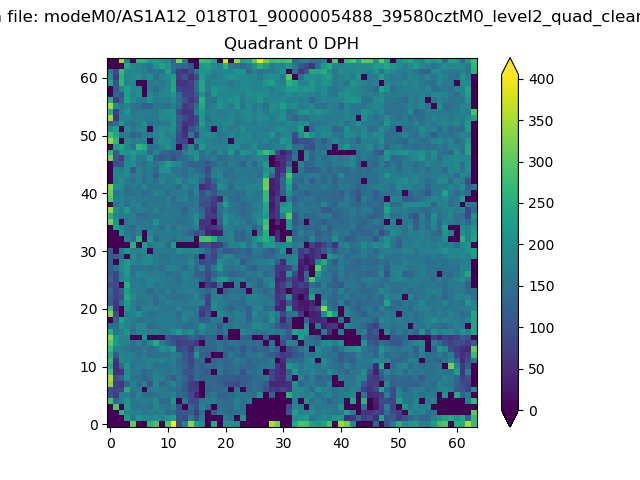 |
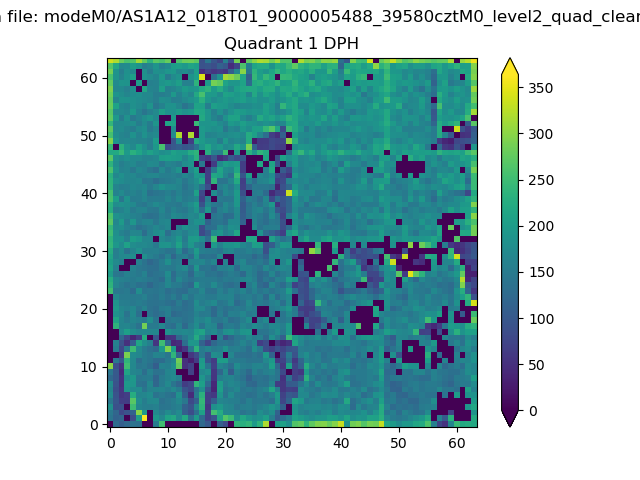 |
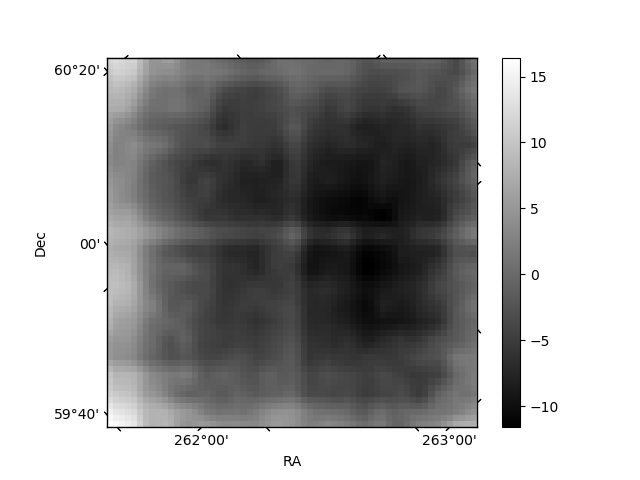
Quadrant B |
|---|---|---|---|
| Quadrant D | 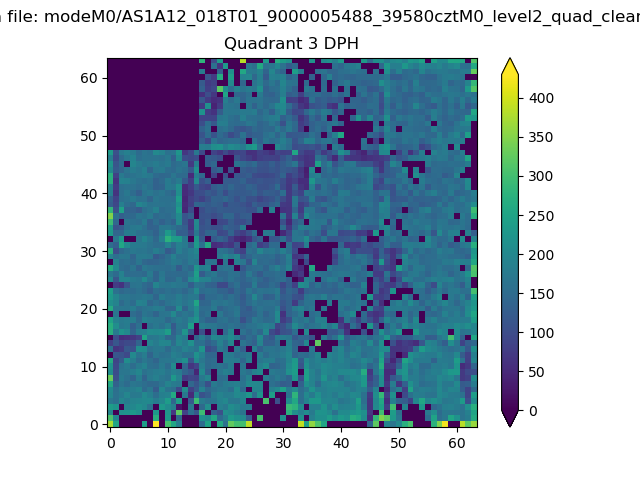 |
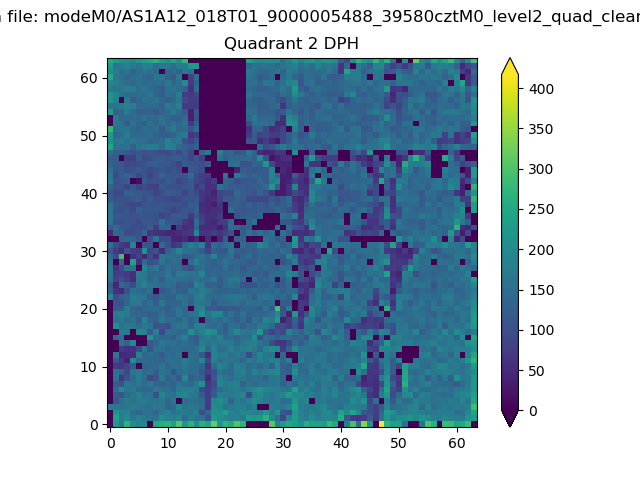 |
Quadrant C |
| Plot type | Count rate plots | Images |
|---|---|---|
| Comparison with Poisson distribution Blue bars denote a histogram of data divided into 1 sec bins. Red curve is a Poisson curve with rate = median count rate of data. |
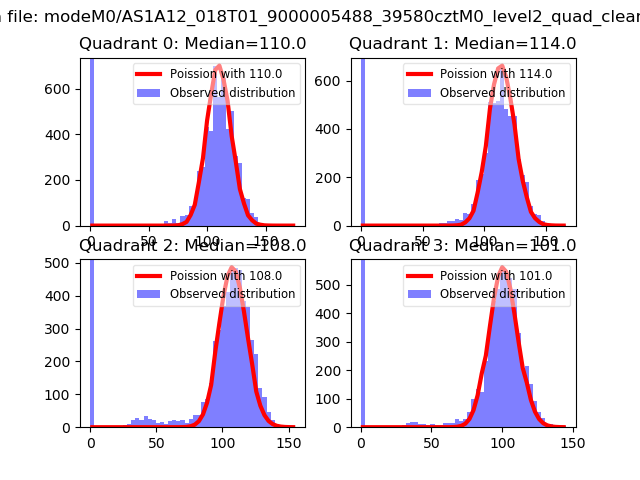 |
 |
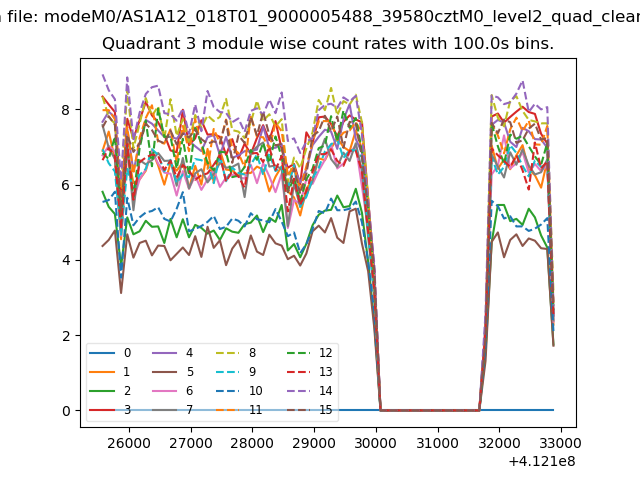
| Quadrant-wise count rates Data is divided into 100 sec bins |
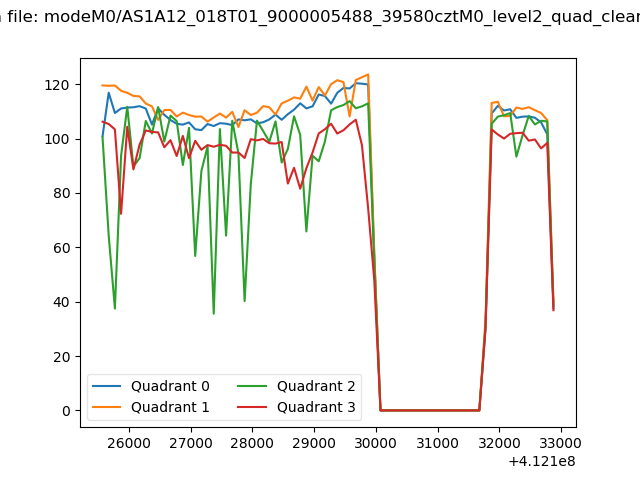 |
|
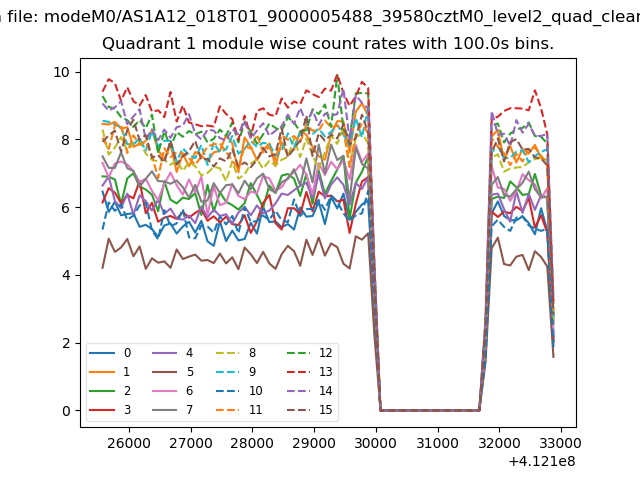
| Module-wise count rates for Quadrant A Data is divided into 100 sec bins |
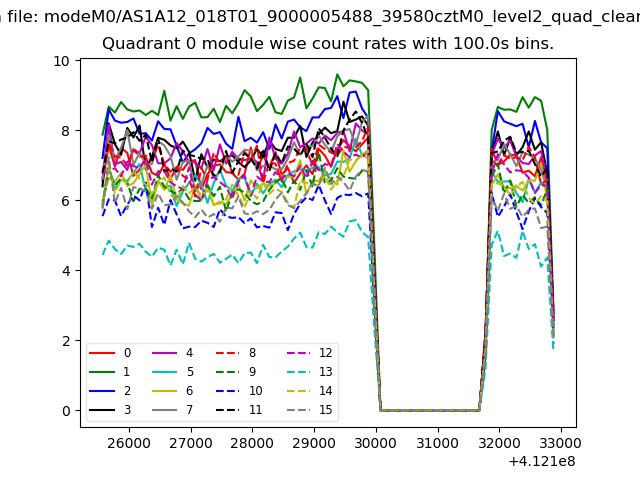 |
 |
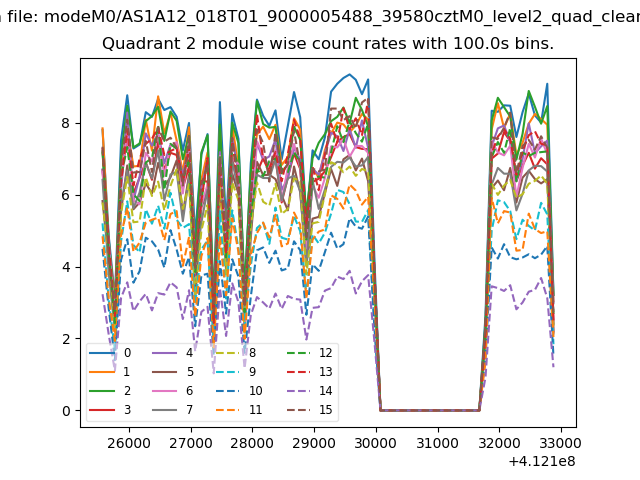
| Module-wise count rates for Quadrant B Data is divided into 100 sec bins |
 |
 |
| Module-wise count rates for Quadrant C Data is divided into 100 sec bins |
 |
 |
| Module-wise count rates for Quadrant D Data is divided into 100 sec bins |
 |
 |
| Parameter | Plot |
|---|---|
| CZT HV Monitor | 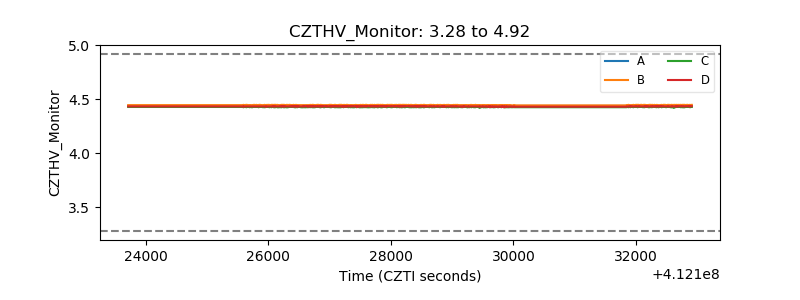 |
| D_VDD | 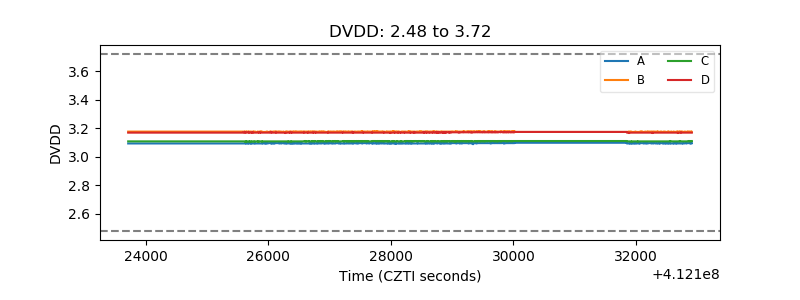 |
| Temperature 1 | 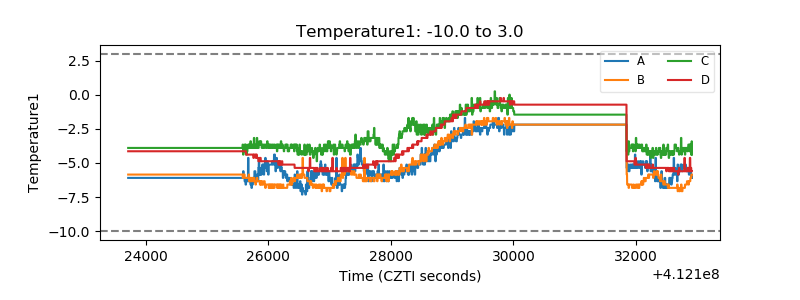 |
| Veto HV Monitor | 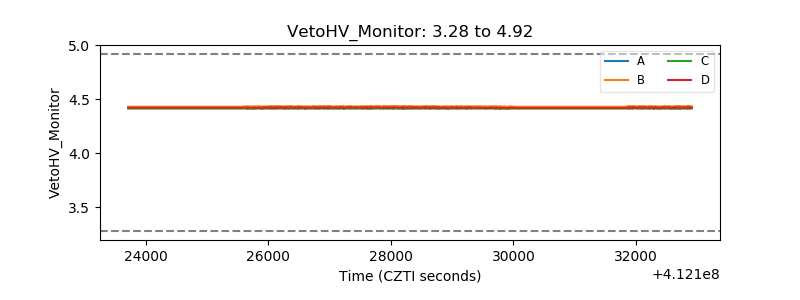 |
| Veto LLD | 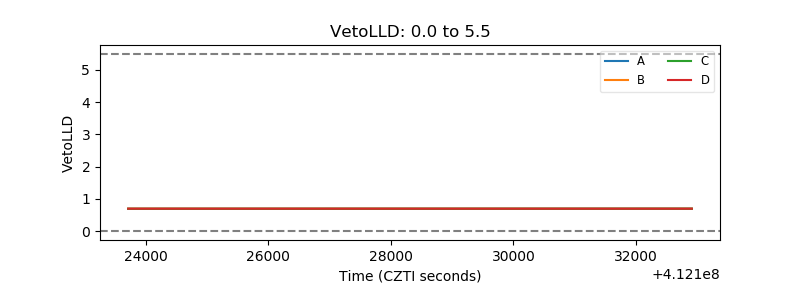 |
| Alpha Counter | 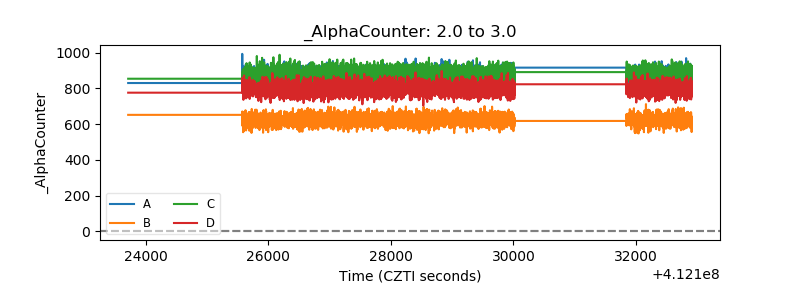 |
| _CPM_Rate | 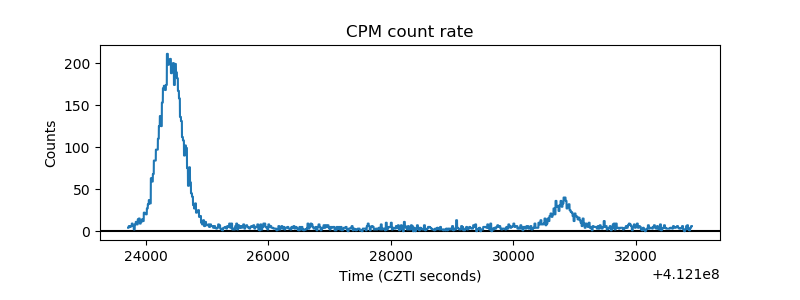 |
| CZT Counter | 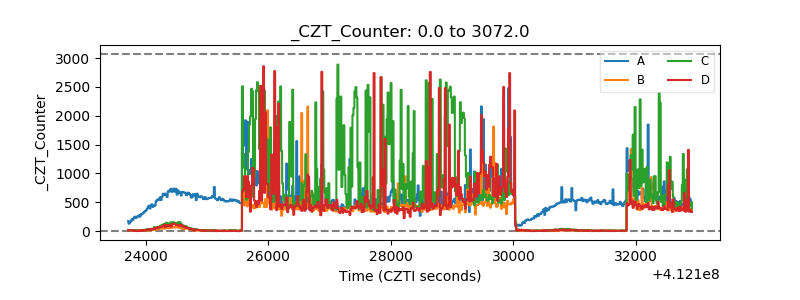 |
| +2.5 Volts monitor |  |
| +5 Volts monitor | 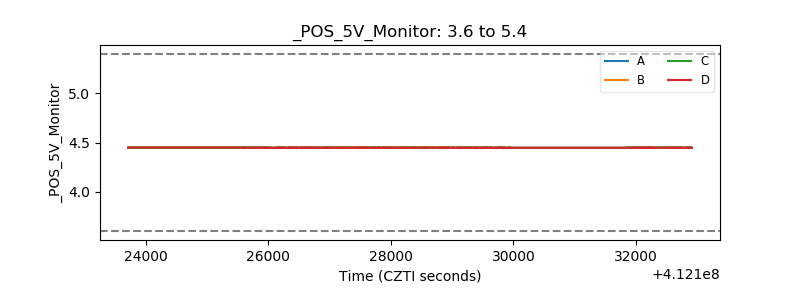 |
| _ROLL_ROT | 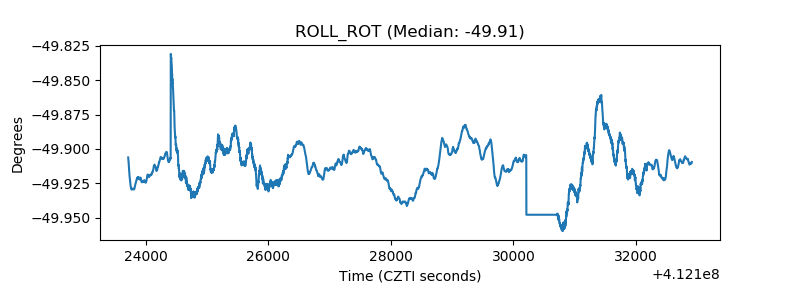 |
| _Roll_DEC | 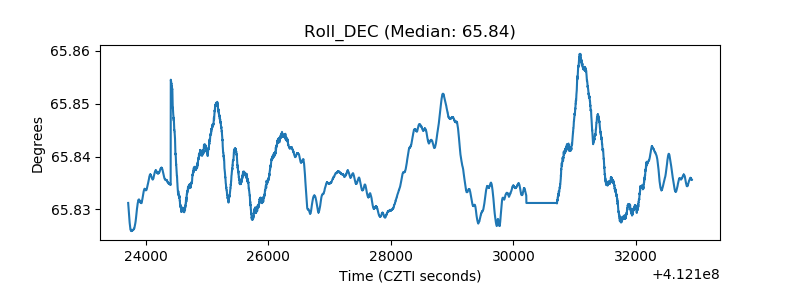 |
| _Roll_RA | 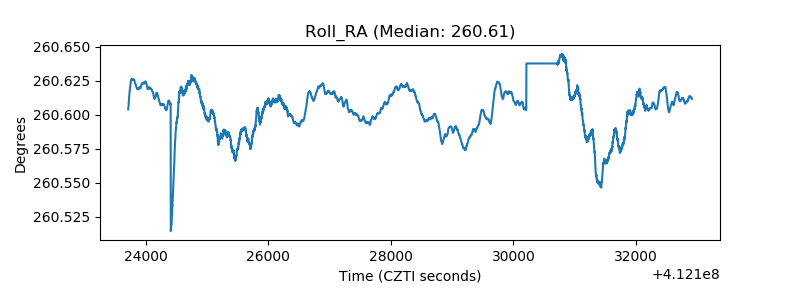 |
| Veto Counter | 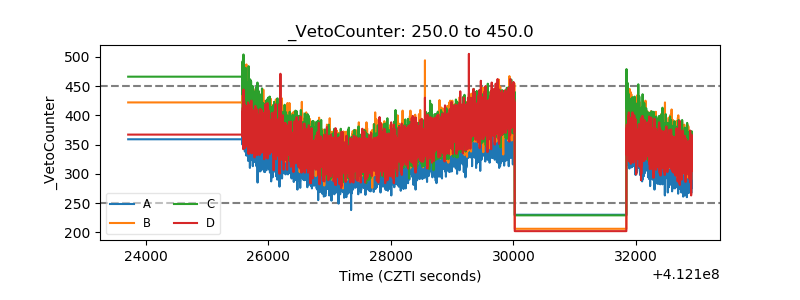 |