| Param | Original file | Final file |
|---|---|---|
| Filename | modeM0/AS1A12_018T01_9000005488_39581cztM0_level2.fits | modeM0/AS1A12_018T01_9000005488_39581cztM0_level2_quad_clean.evt |
| Size (bytes) | 471,902,400 | 90,601,920 |
| Size | 450.0 MB | 86.4 MB |
| Events in quadrant A | 5,410,867 | 595,726 |
| Events in quadrant B | 2,544,112 | 637,598 |
| Events in quadrant C | 5,490,942 | 556,370 |
| Events in quadrant D | 3,580,519 | 555,278 |
| Mode SS | |||
|---|---|---|---|
| Quadrant | BADHDUFLAG | Total packets | Discarded packets |
| A | 0 | 116 | 0 |
| B | 0 | 116 | 0 |
| C | 0 | 116 | 0 |
| D | 0 | 116 | 0 |
| Mode M0 | |||
|---|---|---|---|
| Quadrant | BADHDUFLAG | Total packets | Discarded packets |
| A | 0 | 20046 | 2 |
| B | 0 | 11824 | 1 |
| C | 0 | 20297 | 1 |
| D | 0 | 14881 | 1 |
| Mode M9 | |||
|---|---|---|---|
| Quadrant | BADHDUFLAG | Total packets | Discarded packets |
| A | 0 | 26 | 0 |
| B | 0 | 26 | 0 |
| C | 0 | 26 | 0 |
| D | 0 | 27 | 0 |
| Quadrant | Total seconds | Saturated seconds | Saturation percentage |
|---|---|---|---|
| A | 5692 | 403 | 7.080112% |
| B | 5692 | 21 | 0.368939% |
| C | 5692 | 643 | 11.296557% |
| D | 5692 | 180 | 3.162333% |
Noise dominated data is calculated using 1-second bins in cleaned event files. If a bin has >2000 counts, and if more than 50% of those come from <1% of pixels, then it is considered to be noise-dominated and hence unusable.
| Quadrant | # 1 sec bins | Bins with >0 counts | Bins with >2000 counts | High rate bins dominated by noise | Noise dominated (total time) | Noise dominated (detector-on time) | Marked lightcurve |
|---|---|---|---|---|---|---|---|
| A | 7185 | 5693 | 344 | 344 | 4.79% | 6.04% | 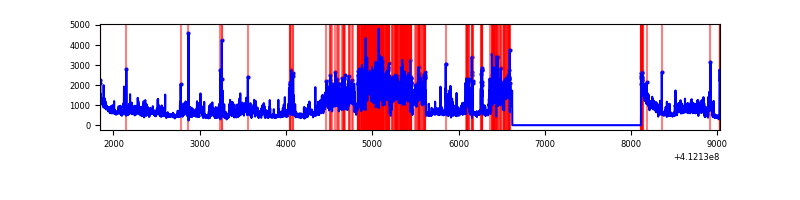 |
| B | 7185 | 5693 | 14 | 14 | 0.19% | 0.25% | 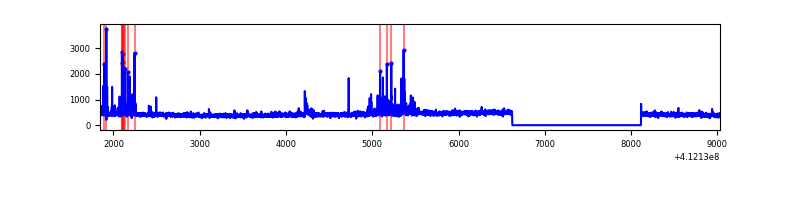 |
| C | 7185 | 5693 | 603 | 603 | 8.39% | 10.59% | 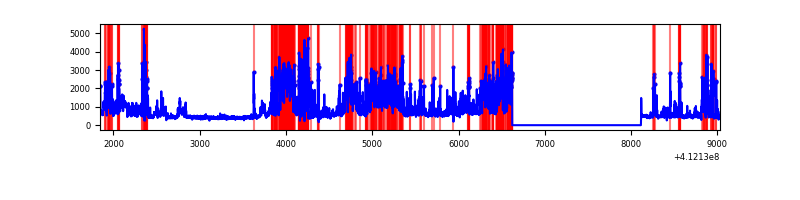 |
| D | 7185 | 5693 | 131 | 131 | 1.82% | 2.30% | 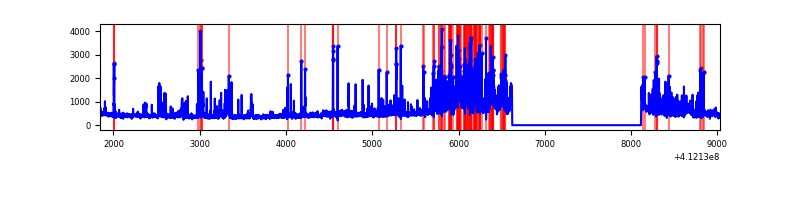 |
Top three noisy pixels from each quadrant. If the there are fewer than three noisy pixels in the level2.evt file, extra rows are filled as -1
| Pixel properties | Quadrant properties | ||||||
|---|---|---|---|---|---|---|---|
| Quadrant | DetID | PixID | Counts | Sigma | Mean | Median | Sigma |
| A | 15 | 222 | 2082510 | 17273.23 | 590 | 576 | 120.5 |
| A | 10 | 83 | 450776 | 3735.19 | 590 | 576 | 120.5 |
| A | 13 | 248 | 384510 | 3185.4 | 590 | 576 | 120.5 |
| B | 5 | 255 | 149936 | 1273.43 | 600 | 582 | 117.3 |
| B | 0 | 230 | 17370 | 143.14 | 600 | 582 | 117.3 |
| B | 5 | 172 | 16570 | 136.32 | 600 | 582 | 117.3 |
| C | 9 | 187 | 1835227 | 14023.38 | 563 | 567 | 130.8 |
| C | 15 | 208 | 1193982 | 9121.97 | 563 | 567 | 130.8 |
| C | 15 | 214 | 243249 | 1854.96 | 563 | 567 | 130.8 |
| D | 12 | 227 | 1159295 | 8179.99 | 579 | 562 | 141.7 |
| D | 13 | 249 | 53869 | 376.32 | 579 | 562 | 141.7 |
| D | 12 | 233 | 53246 | 371.92 | 579 | 562 | 141.7 |
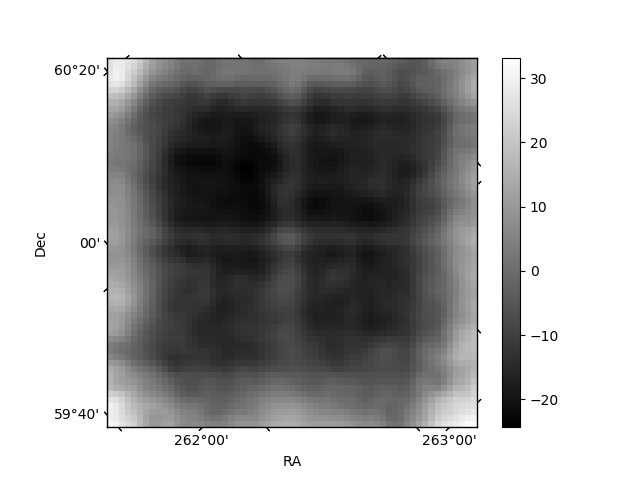
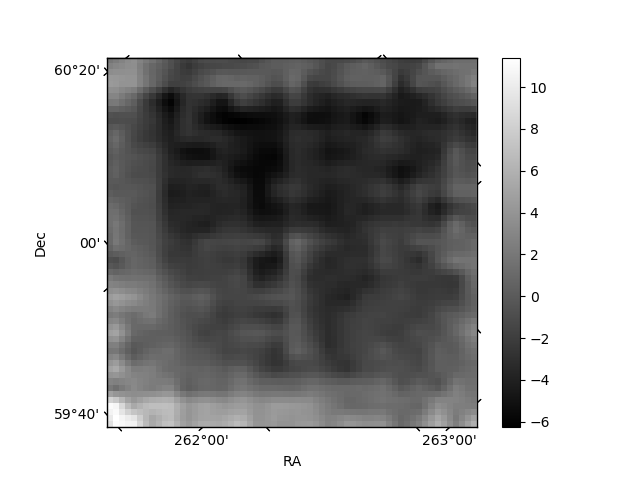
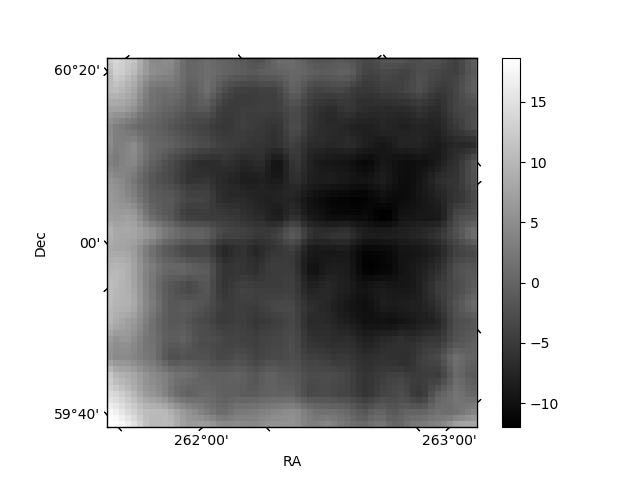
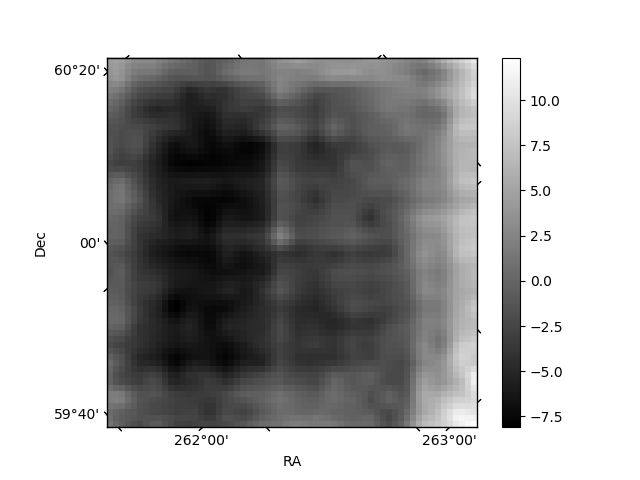
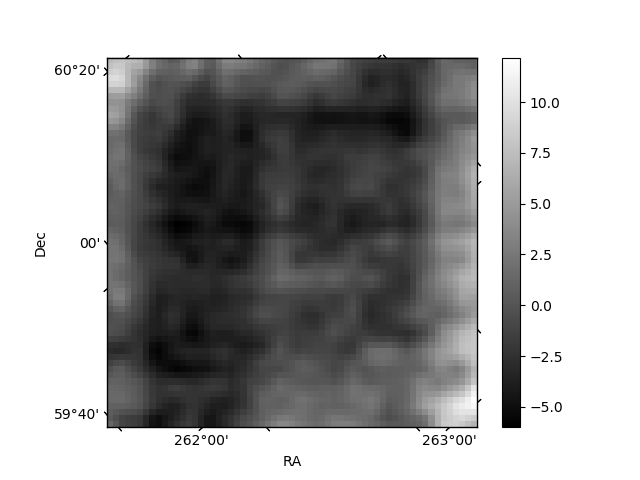
Histogram calculated using DETX and DETY for each event in the final _common_clean file
| Quadrant A | 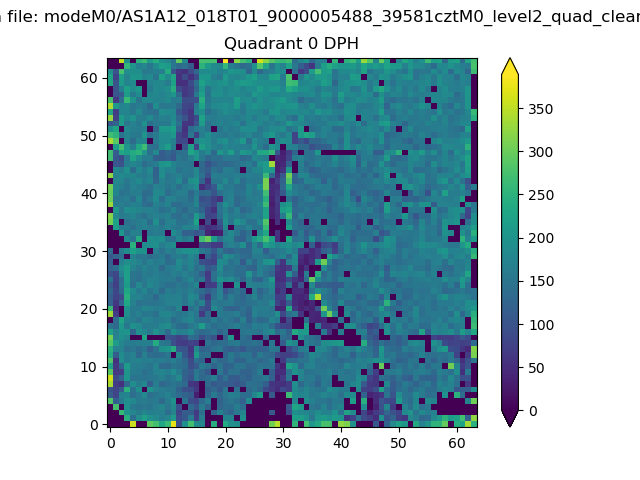 |
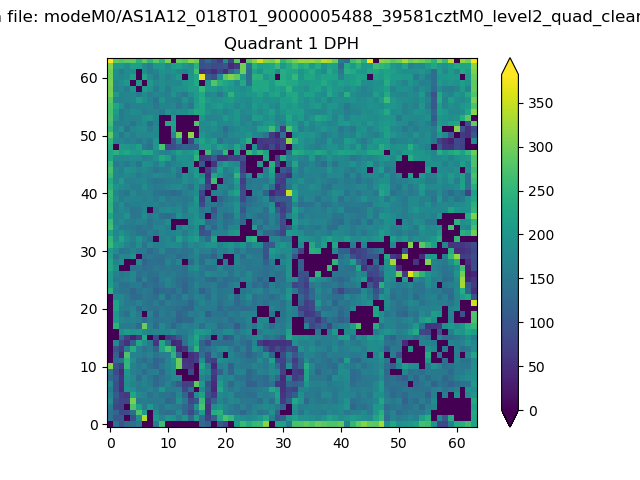 |
Quadrant B |
|---|---|---|---|
| Quadrant D | 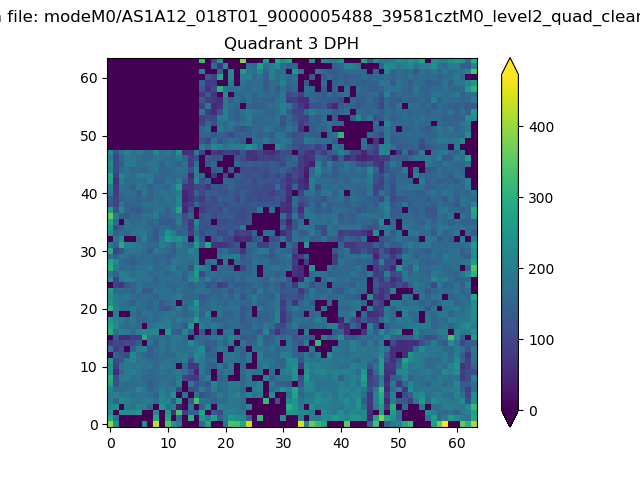 |
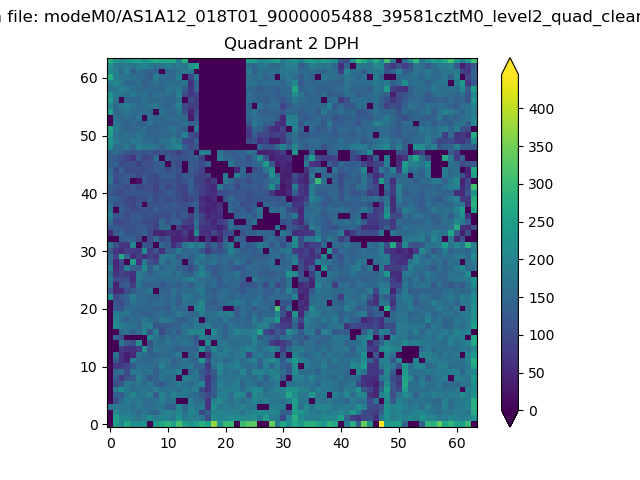 |
Quadrant C |
| Plot type | Count rate plots | Images |
|---|---|---|
| Comparison with Poisson distribution Blue bars denote a histogram of data divided into 1 sec bins. Red curve is a Poisson curve with rate = median count rate of data. |
 |
 |
| Quadrant-wise count rates Data is divided into 100 sec bins |
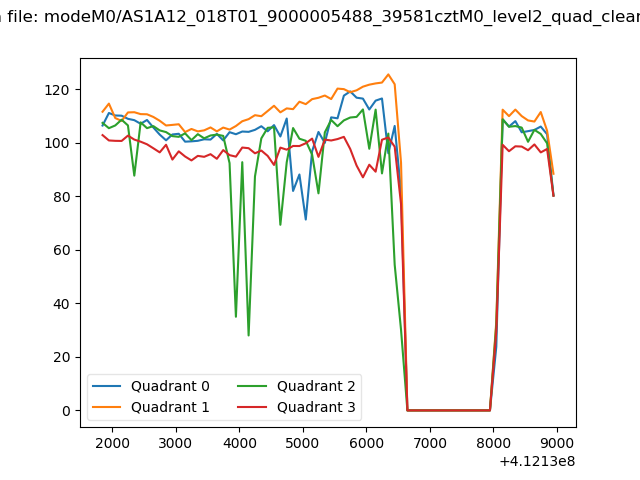 |
|
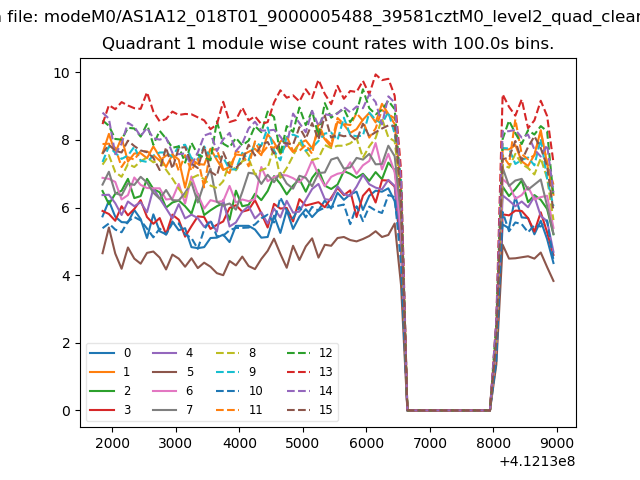
| Module-wise count rates for Quadrant A Data is divided into 100 sec bins |
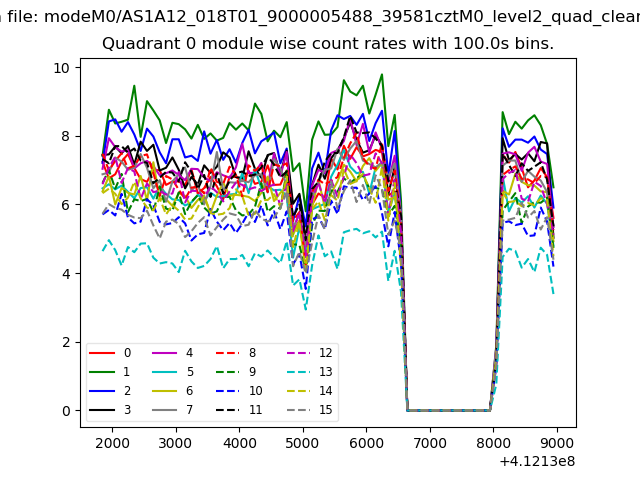 |
 |
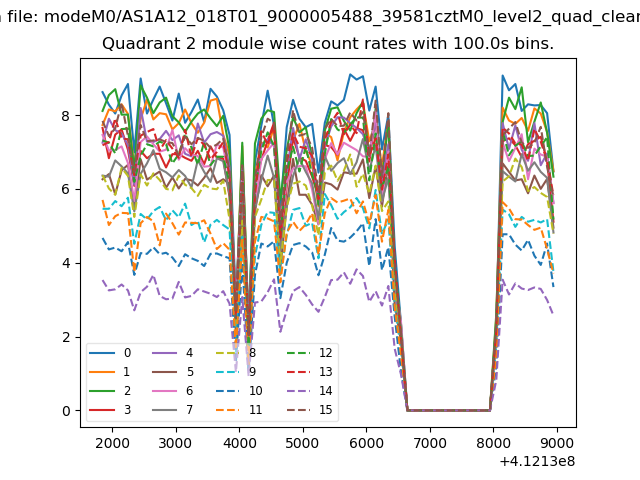
| Module-wise count rates for Quadrant B Data is divided into 100 sec bins |
 |
 |
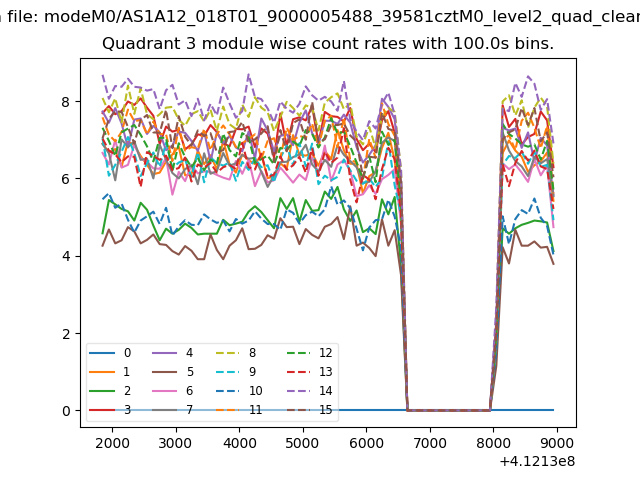
| Module-wise count rates for Quadrant C Data is divided into 100 sec bins |
 |
 |
| Module-wise count rates for Quadrant D Data is divided into 100 sec bins |
 |
 |
| Parameter | Plot |
|---|---|
| CZT HV Monitor | 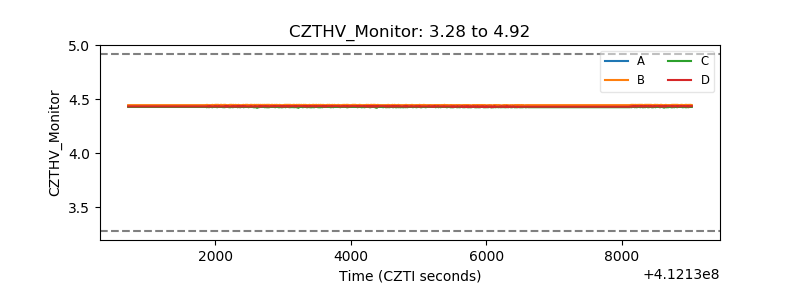 |
| D_VDD | 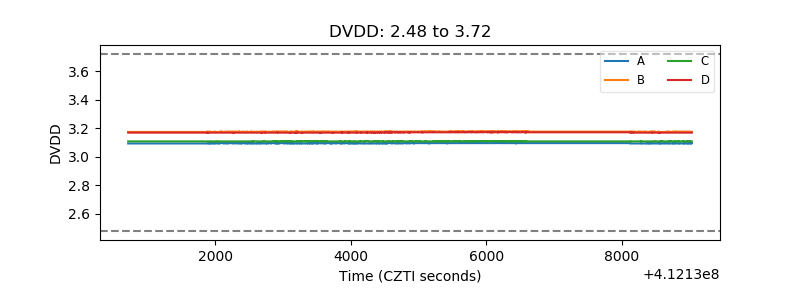 |
| Temperature 1 | 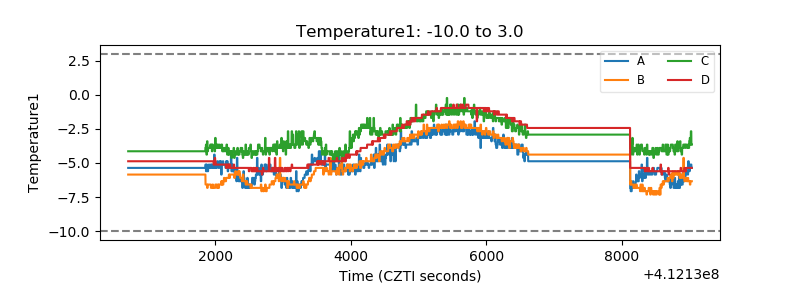 |
| Veto HV Monitor | 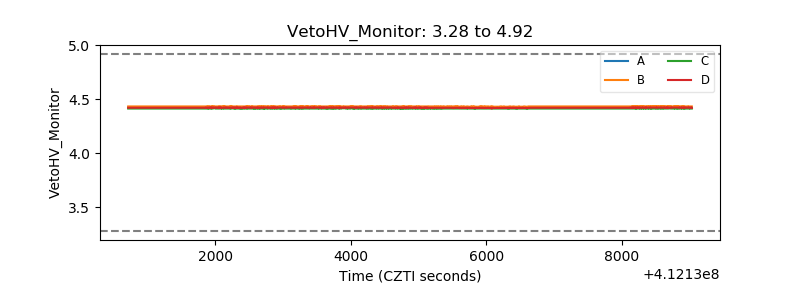 |
| Veto LLD | 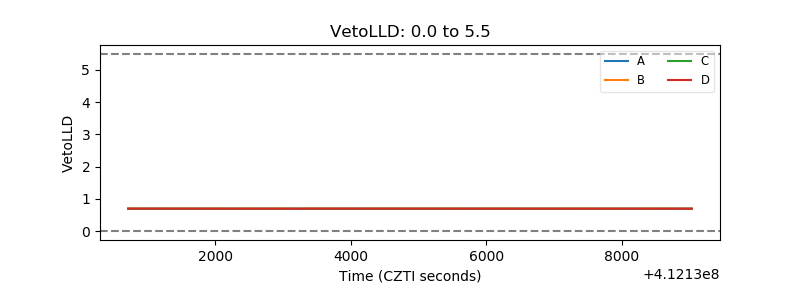 |
| Alpha Counter | 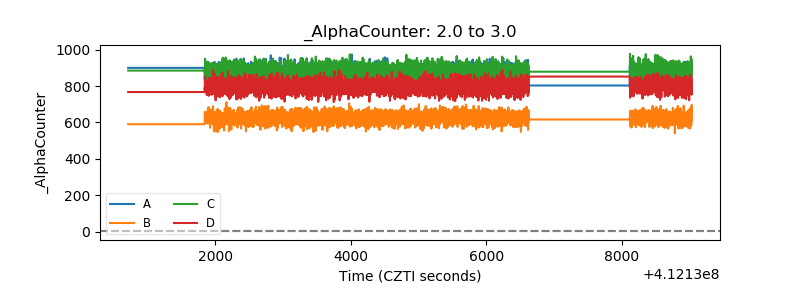 |
| _CPM_Rate | 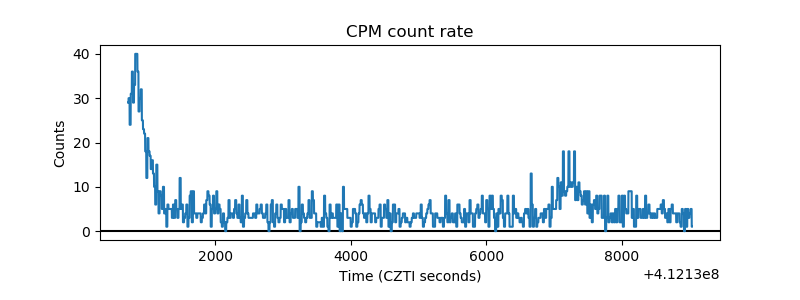 |
| CZT Counter | 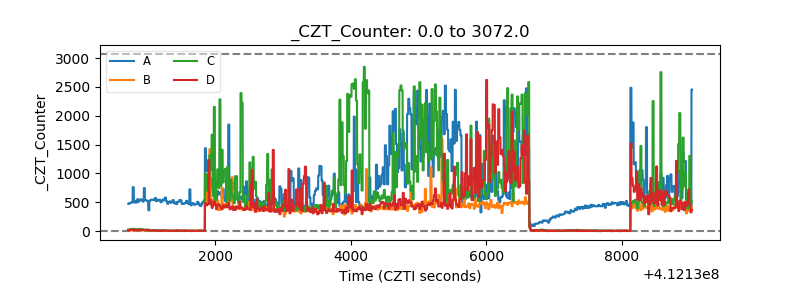 |
| +2.5 Volts monitor | 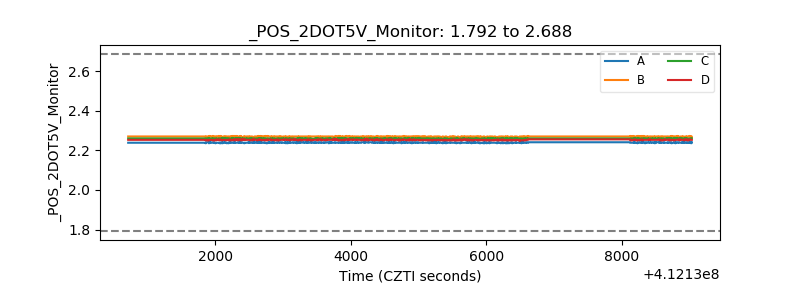 |
| +5 Volts monitor | 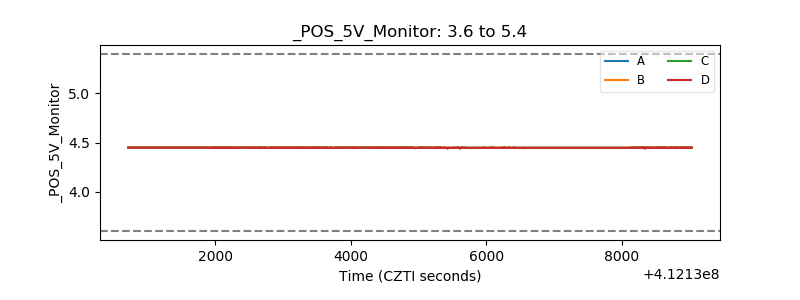 |
| _ROLL_ROT | 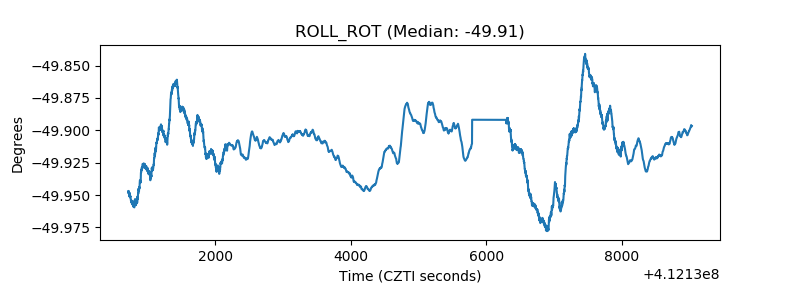 |
| _Roll_DEC | 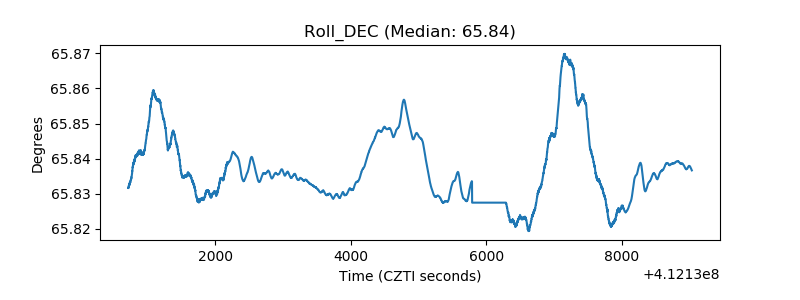 |
| _Roll_RA | 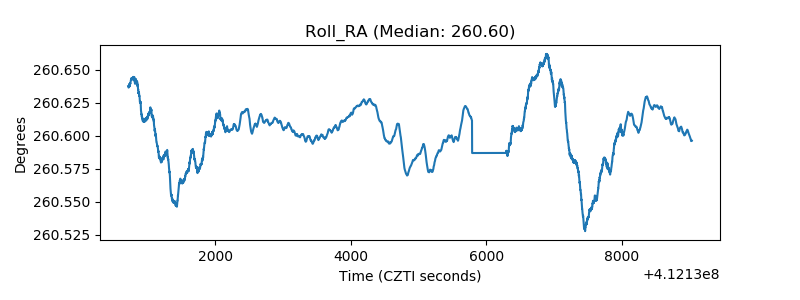 |
| Veto Counter | 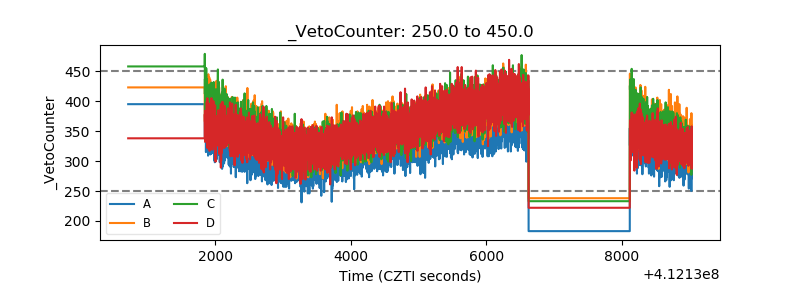 |