| Param | Original file | Final file |
|---|---|---|
| Filename | modeM0/AS1A12_018T01_9000005488_39582cztM0_level2.fits | modeM0/AS1A12_018T01_9000005488_39582cztM0_level2_quad_clean.evt |
| Size (bytes) | 589,849,920 | 94,867,200 |
| Size | 562.5 MB | 90.5 MB |
| Events in quadrant A | 6,434,823 | 654,669 |
| Events in quadrant B | 2,967,711 | 685,711 |
| Events in quadrant C | 8,391,065 | 491,541 |
| Events in quadrant D | 3,560,132 | 606,941 |
| Mode SS | |||
|---|---|---|---|
| Quadrant | BADHDUFLAG | Total packets | Discarded packets |
| A | 0 | 130 | 0 |
| B | 0 | 130 | 0 |
| C | 0 | 130 | 0 |
| D | 0 | 130 | 0 |
| Mode M0 | |||
|---|---|---|---|
| Quadrant | BADHDUFLAG | Total packets | Discarded packets |
| A | 0 | 23457 | 2 |
| B | 0 | 13342 | 1 |
| C | 0 | 29203 | 1 |
| D | 0 | 15028 | 1 |
| Mode M9 | |||
|---|---|---|---|
| Quadrant | BADHDUFLAG | Total packets | Discarded packets |
| A | 0 | 28 | 0 |
| B | 0 | 28 | 0 |
| C | 0 | 28 | 0 |
| D | 0 | 28 | 0 |
| Quadrant | Total seconds | Saturated seconds | Saturation percentage |
|---|---|---|---|
| A | 6200 | 349 | 5.629032% |
| B | 6200 | 95 | 1.532258% |
| C | 6200 | 1817 | 29.306452% |
| D | 6200 | 97 | 1.564516% |
Noise dominated data is calculated using 1-second bins in cleaned event files. If a bin has >2000 counts, and if more than 50% of those come from <1% of pixels, then it is considered to be noise-dominated and hence unusable.
| Quadrant | # 1 sec bins | Bins with >0 counts | Bins with >2000 counts | High rate bins dominated by noise | Noise dominated (total time) | Noise dominated (detector-on time) | Marked lightcurve |
|---|---|---|---|---|---|---|---|
| A | 9035 | 6202 | 246 | 246 | 2.72% | 3.97% | 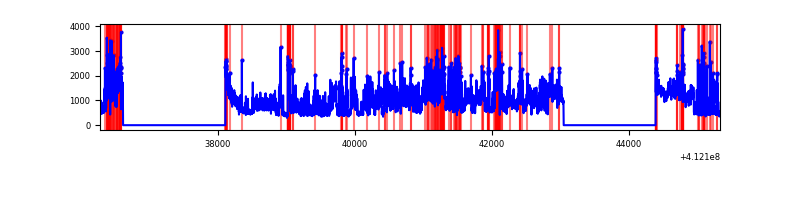 |
| B | 9035 | 6202 | 57 | 57 | 0.63% | 0.92% | 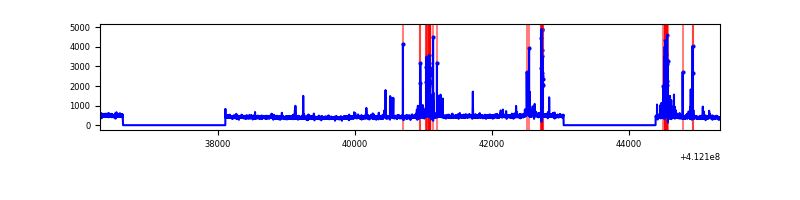 |
| C | 9035 | 6202 | 1565 | 1565 | 17.32% | 25.23% | 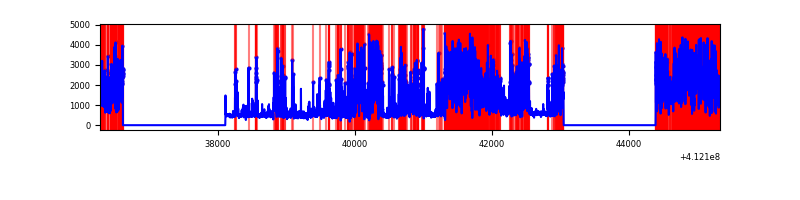 |
| D | 9035 | 6202 | 79 | 79 | 0.87% | 1.27% | 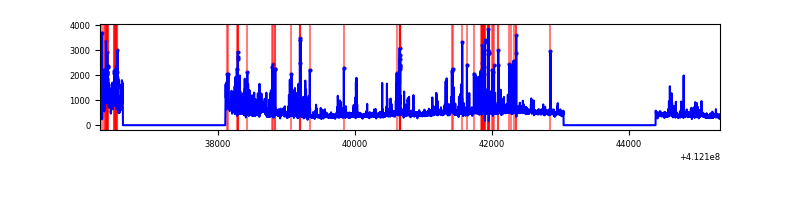 |
Top three noisy pixels from each quadrant. If the there are fewer than three noisy pixels in the level2.evt file, extra rows are filled as -1
| Pixel properties | Quadrant properties | ||||||
|---|---|---|---|---|---|---|---|
| Quadrant | DetID | PixID | Counts | Sigma | Mean | Median | Sigma |
| A | 15 | 222 | 3168705 | 23770.52 | 653 | 639 | 133.3 |
| A | 10 | 83 | 472615 | 3541.31 | 653 | 639 | 133.3 |
| A | 9 | 143 | 177682 | 1328.38 | 653 | 639 | 133.3 |
| B | 5 | 255 | 305792 | 2386.23 | 655 | 634 | 127.9 |
| B | 5 | 172 | 73222 | 567.61 | 655 | 634 | 127.9 |
| B | 12 | 111 | 15937 | 119.66 | 655 | 634 | 127.9 |
| C | 9 | 187 | 3208744 | 24623.24 | 561 | 565 | 130.3 |
| C | 15 | 208 | 2721511 | 20883.66 | 561 | 565 | 130.3 |
| C | 15 | 214 | 241764 | 1851.24 | 561 | 565 | 130.3 |
| D | 12 | 227 | 697216 | 4443.18 | 643 | 622 | 156.8 |
| D | 1 | 52 | 101388 | 642.73 | 643 | 622 | 156.8 |
| D | 13 | 249 | 89997 | 570.07 | 643 | 622 | 156.8 |
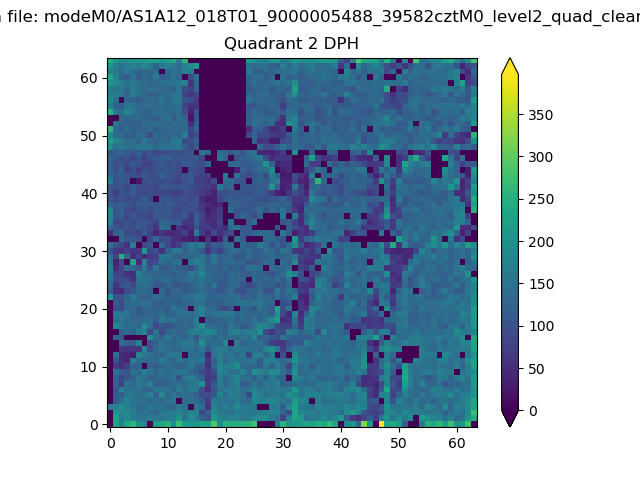
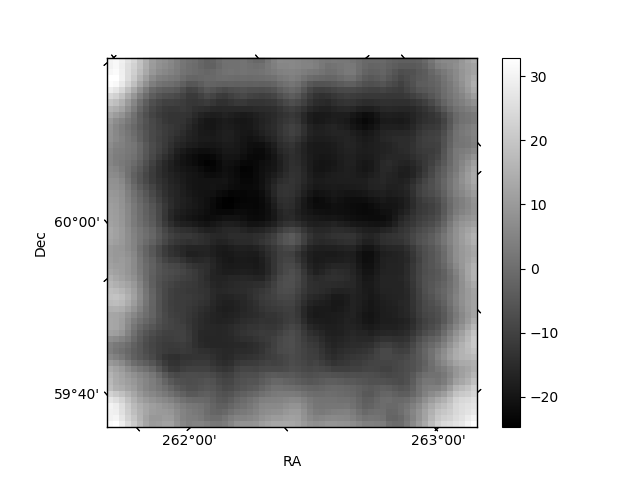
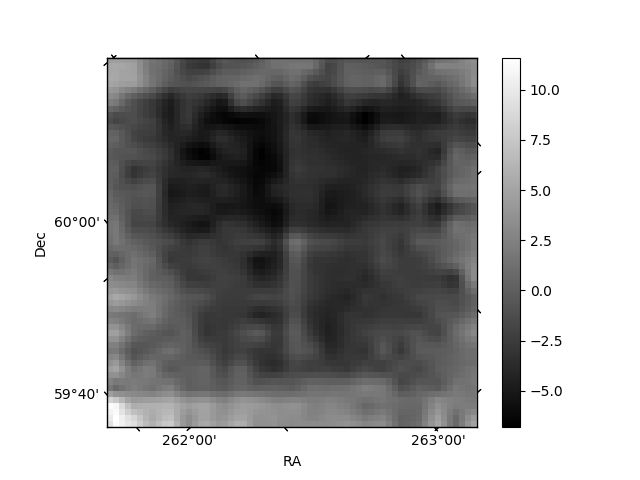
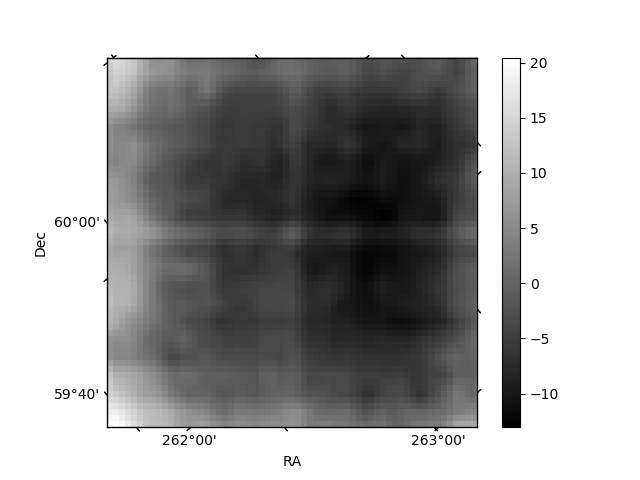
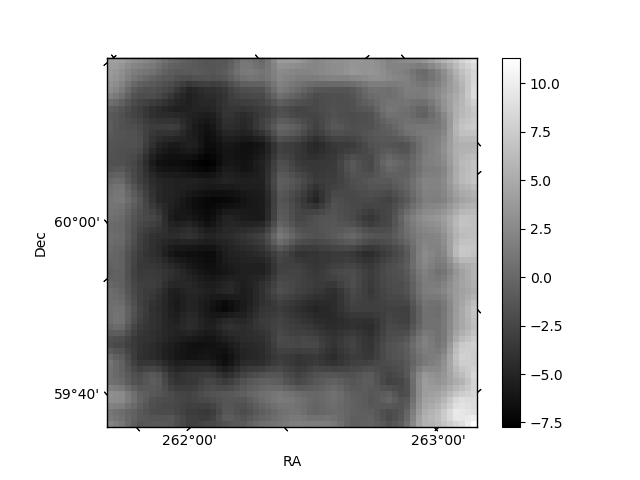
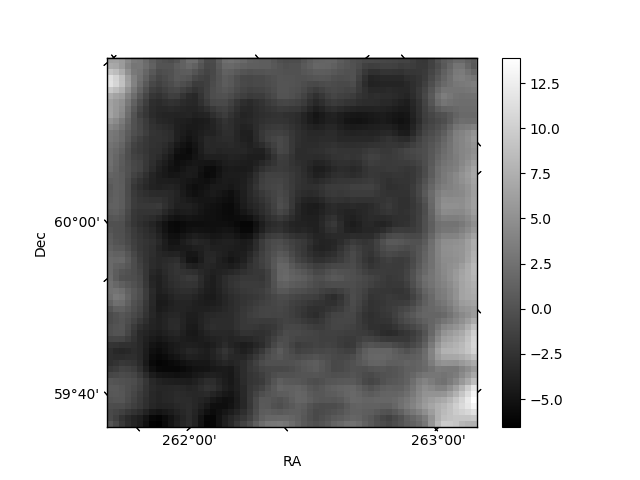
Histogram calculated using DETX and DETY for each event in the final _common_clean file
| Quadrant A | 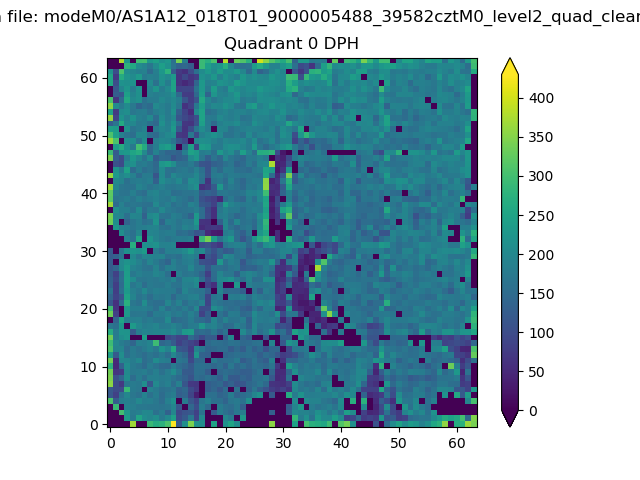 |
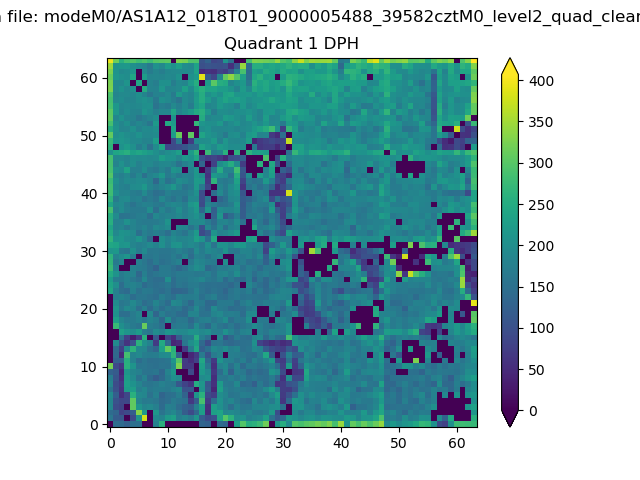 |
Quadrant B |
|---|---|---|---|
| Quadrant D | 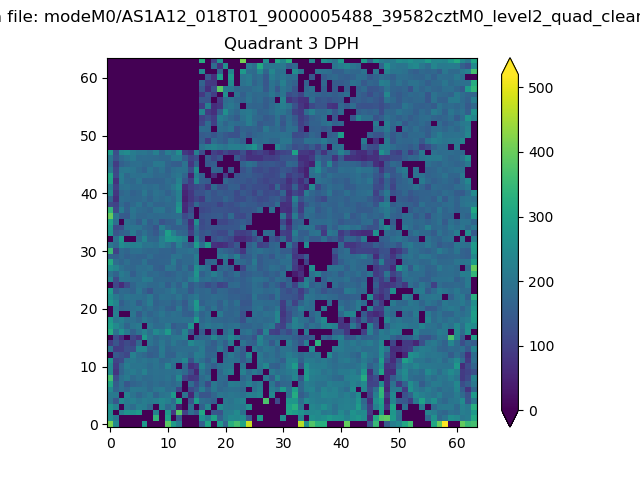 |
 |
Quadrant C |
| Plot type | Count rate plots | Images |
|---|---|---|
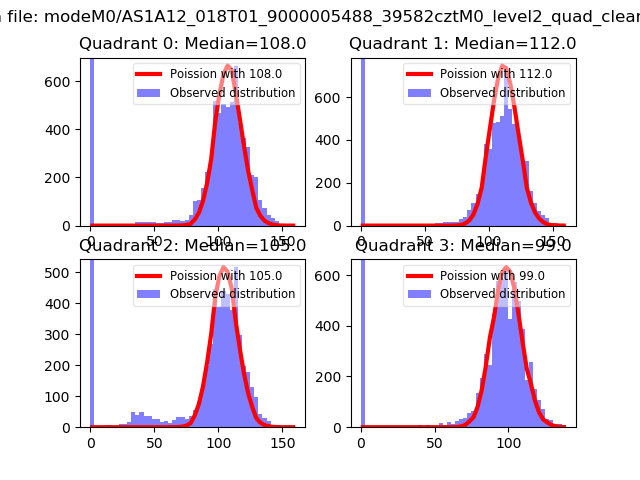
| Comparison with Poisson distribution Blue bars denote a histogram of data divided into 1 sec bins. Red curve is a Poisson curve with rate = median count rate of data. |
 |
 |
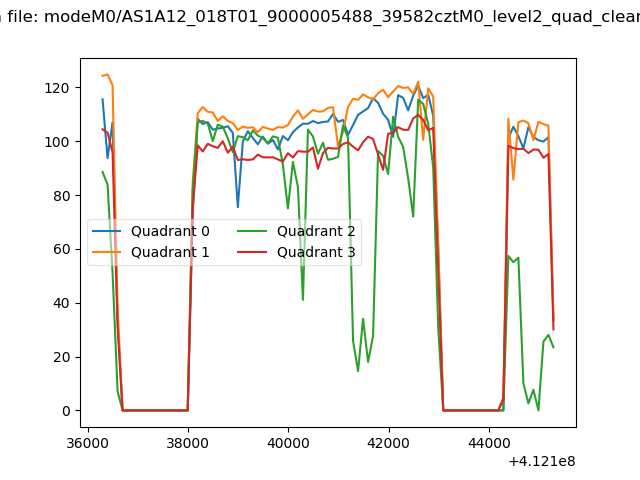
| Quadrant-wise count rates Data is divided into 100 sec bins |
 |
|
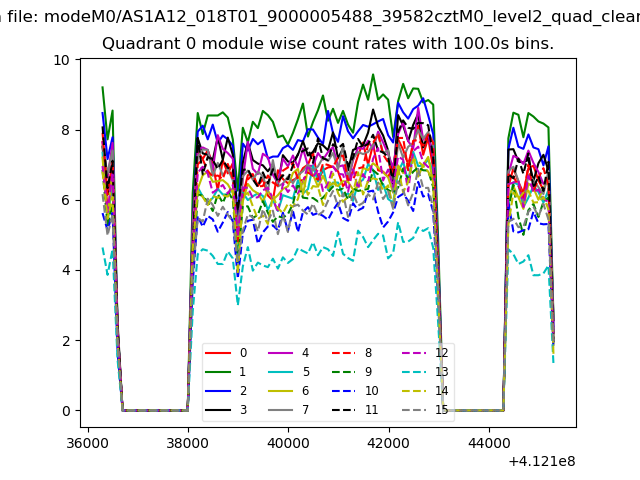
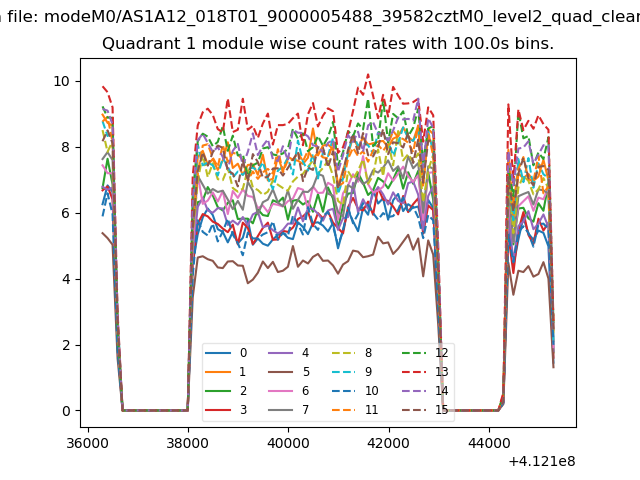
| Module-wise count rates for Quadrant A Data is divided into 100 sec bins |
 |
 |
| Module-wise count rates for Quadrant B Data is divided into 100 sec bins |
 |
 |
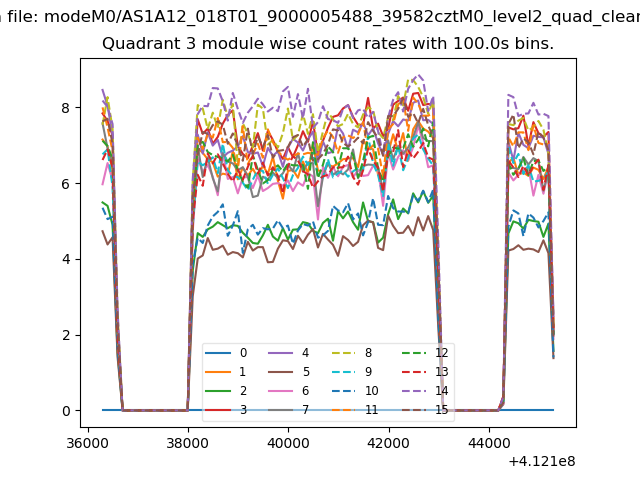
| Module-wise count rates for Quadrant C Data is divided into 100 sec bins |
 |
 |
| Module-wise count rates for Quadrant D Data is divided into 100 sec bins |
 |
 |
| Parameter | Plot |
|---|---|
| CZT HV Monitor | 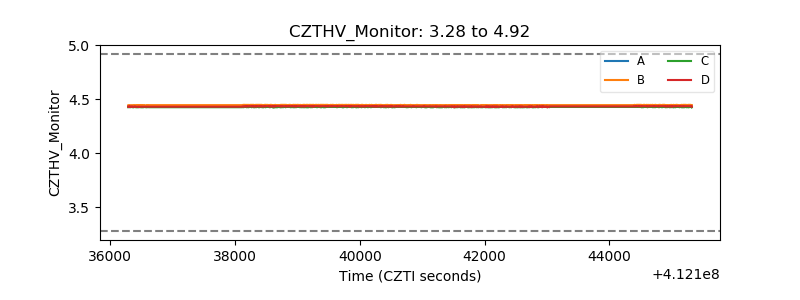 |
| D_VDD | 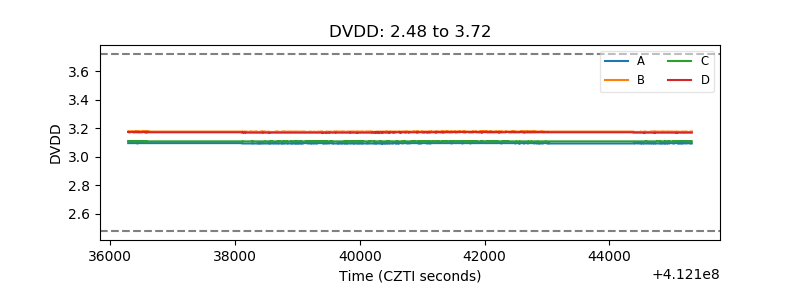 |
| Temperature 1 | 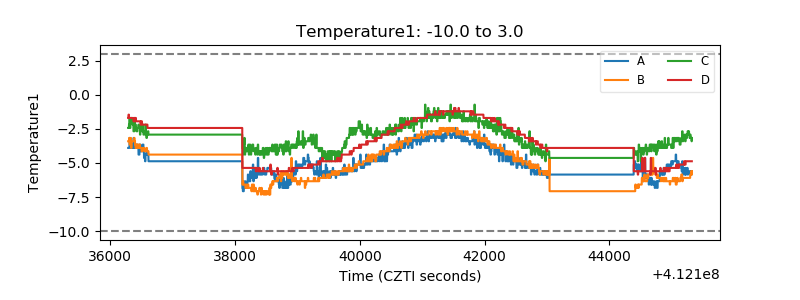 |
| Veto HV Monitor | 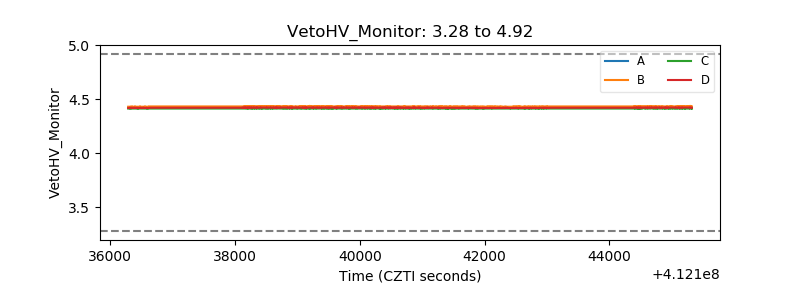 |
| Veto LLD | 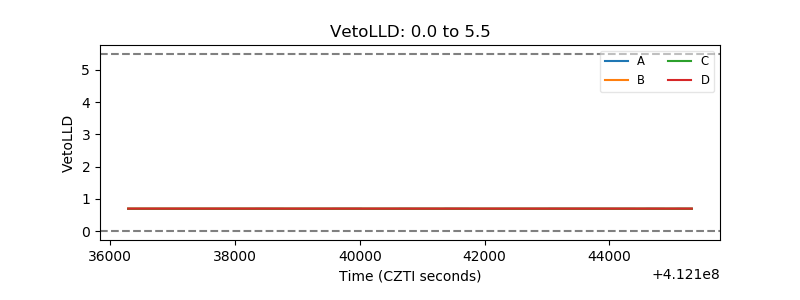 |
| Alpha Counter | 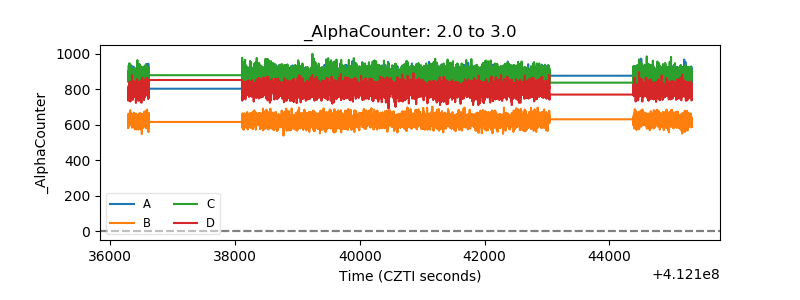 |
| _CPM_Rate | 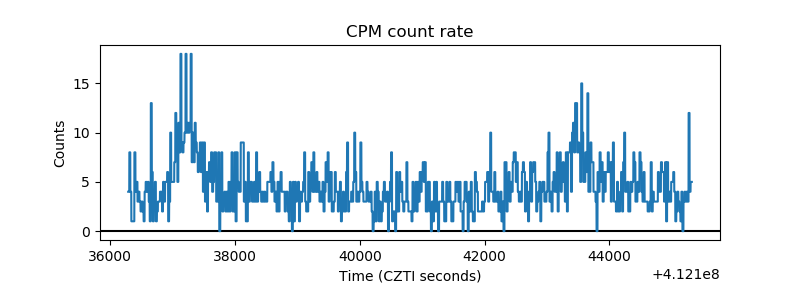 |
| CZT Counter | 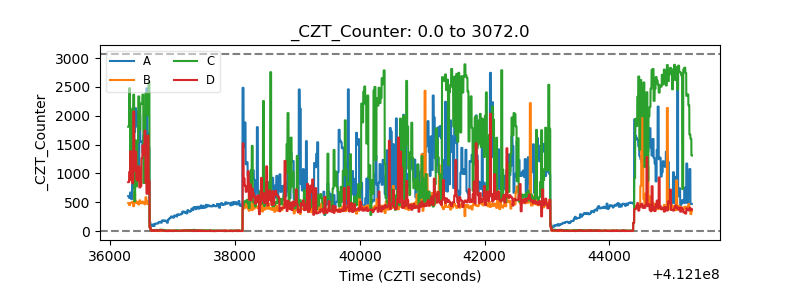 |
| +2.5 Volts monitor | 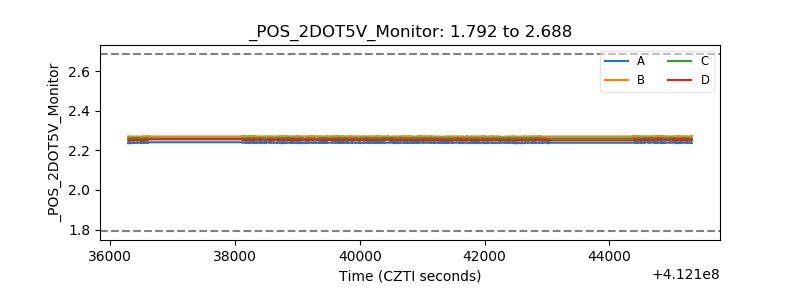 |
| +5 Volts monitor | 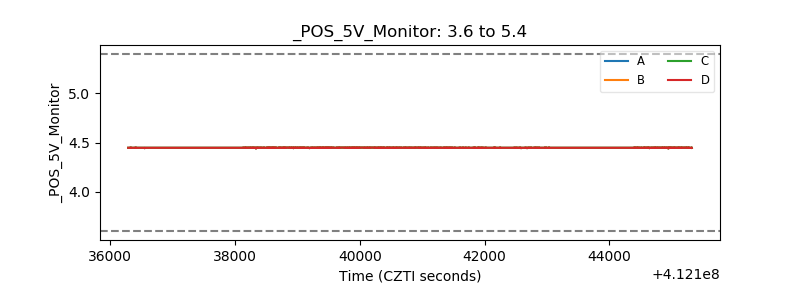 |
| _ROLL_ROT | 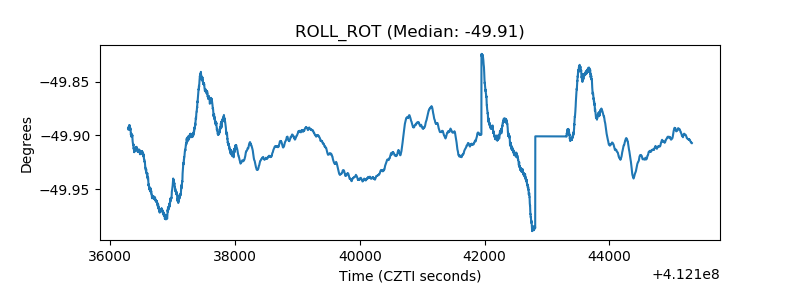 |
| _Roll_DEC | 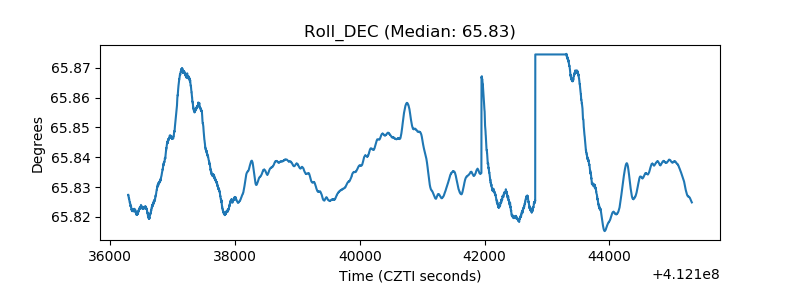 |
| _Roll_RA | 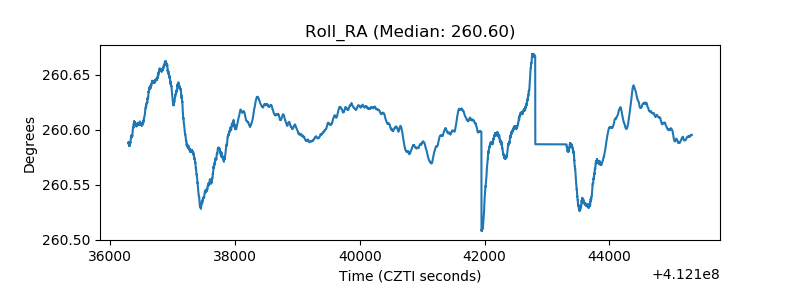 |
| Veto Counter | 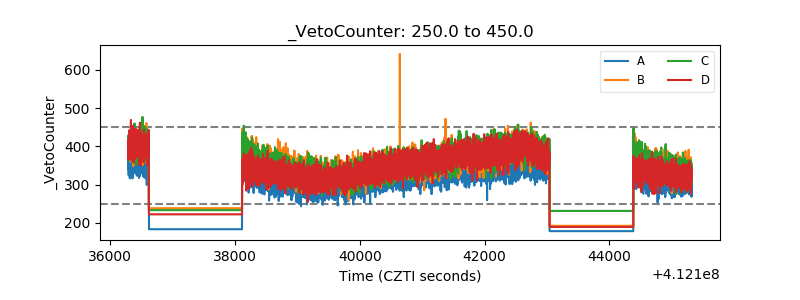 |