| Param | Original file | Final file |
|---|---|---|
| Filename | modeM0/AS1A12_018T01_9000005488_39583cztM0_level2.fits | modeM0/AS1A12_018T01_9000005488_39583cztM0_level2_quad_clean.evt |
| Size (bytes) | 612,506,880 | 83,761,920 |
| Size | 584.1 MB | 79.9 MB |
| Events in quadrant A | 4,384,914 | 636,728 |
| Events in quadrant B | 2,663,881 | 660,789 |
| Events in quadrant C | 12,277,268 | 236,234 |
| Events in quadrant D | 2,881,931 | 584,576 |
| Mode SS | |||
|---|---|---|---|
| Quadrant | BADHDUFLAG | Total packets | Discarded packets |
| A | 0 | 122 | 0 |
| B | 0 | 122 | 0 |
| C | 0 | 122 | 0 |
| D | 0 | 122 | 0 |
| Mode M0 | |||
|---|---|---|---|
| Quadrant | BADHDUFLAG | Total packets | Discarded packets |
| A | 0 | 16857 | 3 |
| B | 0 | 12352 | 2 |
| C | 0 | 40543 | 2 |
| D | 0 | 12905 | 2 |
| Mode M9 | |||
|---|---|---|---|
| Quadrant | BADHDUFLAG | Total packets | Discarded packets |
| A | 0 | 23 | 0 |
| B | 0 | 23 | 0 |
| C | 0 | 23 | 0 |
| D | 0 | 24 | 0 |
| Quadrant | Total seconds | Saturated seconds | Saturation percentage |
|---|---|---|---|
| A | 5980 | 169 | 2.826087% |
| B | 5980 | 39 | 0.652174% |
| C | 5980 | 3992 | 66.755853% |
| D | 5980 | 22 | 0.367893% |
Noise dominated data is calculated using 1-second bins in cleaned event files. If a bin has >2000 counts, and if more than 50% of those come from <1% of pixels, then it is considered to be noise-dominated and hence unusable.
| Quadrant | # 1 sec bins | Bins with >0 counts | Bins with >2000 counts | High rate bins dominated by noise | Noise dominated (total time) | Noise dominated (detector-on time) | Marked lightcurve |
|---|---|---|---|---|---|---|---|
| A | 7293 | 5981 | 131 | 131 | 1.80% | 2.19% | 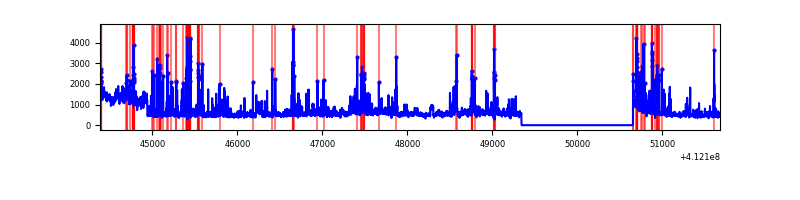 |
| B | 7293 | 5981 | 21 | 21 | 0.29% | 0.35% | 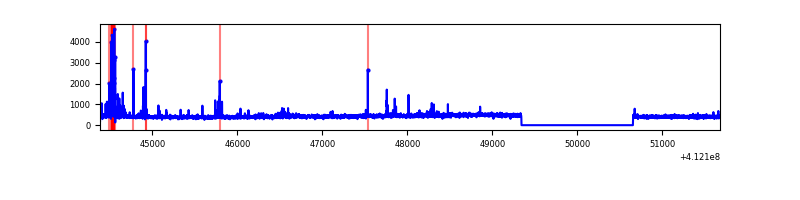 |
| C | 7293 | 5981 | 3404 | 3404 | 46.67% | 56.91% | 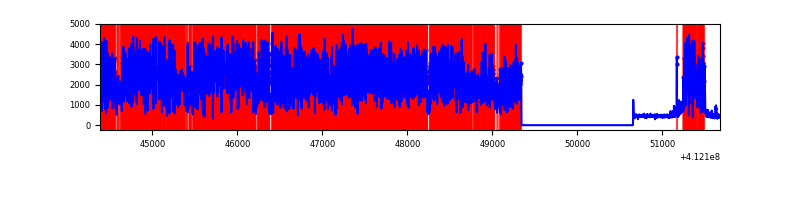 |
| D | 7293 | 5981 | 19 | 19 | 0.26% | 0.32% | 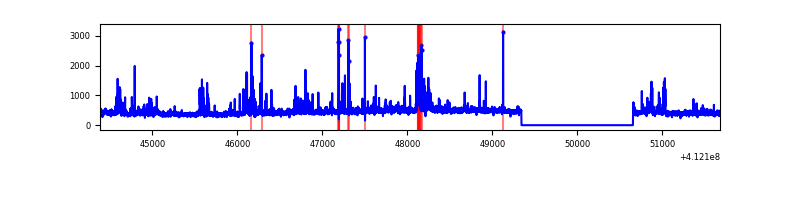 |
Top three noisy pixels from each quadrant. If the there are fewer than three noisy pixels in the level2.evt file, extra rows are filled as -1
| Pixel properties | Quadrant properties | ||||||
|---|---|---|---|---|---|---|---|
| Quadrant | DetID | PixID | Counts | Sigma | Mean | Median | Sigma |
| A | 15 | 222 | 754475 | 5879.82 | 629 | 615 | 128.2 |
| A | 9 | 143 | 601979 | 4690.41 | 629 | 615 | 128.2 |
| A | 10 | 83 | 461272 | 3592.95 | 629 | 615 | 128.2 |
| B | 5 | 255 | 169977 | 1365.38 | 632 | 613 | 124.0 |
| B | 12 | 111 | 15765 | 122.15 | 632 | 613 | 124.0 |
| B | 11 | 111 | 14255 | 109.98 | 632 | 613 | 124.0 |
| C | 15 | 208 | 6523150 | 64913.59 | 429 | 432 | 100.5 |
| C | 9 | 187 | 3810507 | 37917.58 | 429 | 432 | 100.5 |
| C | 15 | 214 | 190753 | 1894.06 | 429 | 432 | 100.5 |
| D | 12 | 0 | 124303 | 822.07 | 619 | 600 | 150.5 |
| D | 1 | 52 | 83221 | 549.06 | 619 | 600 | 150.5 |
| D | 12 | 233 | 80020 | 527.78 | 619 | 600 | 150.5 |
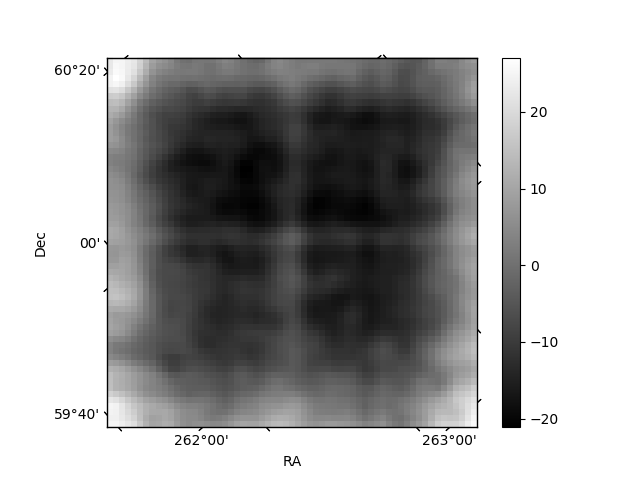
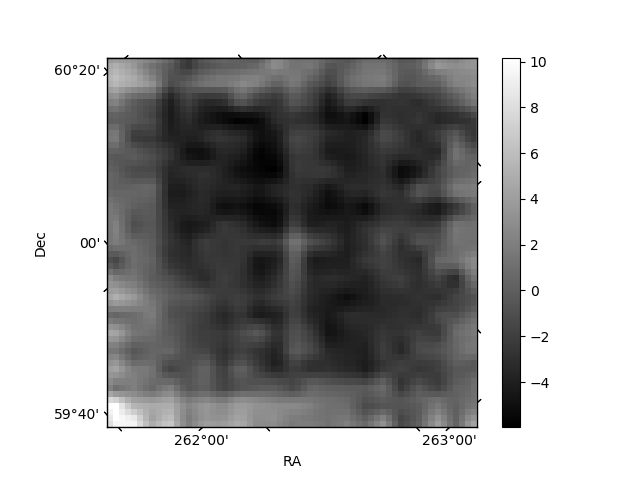
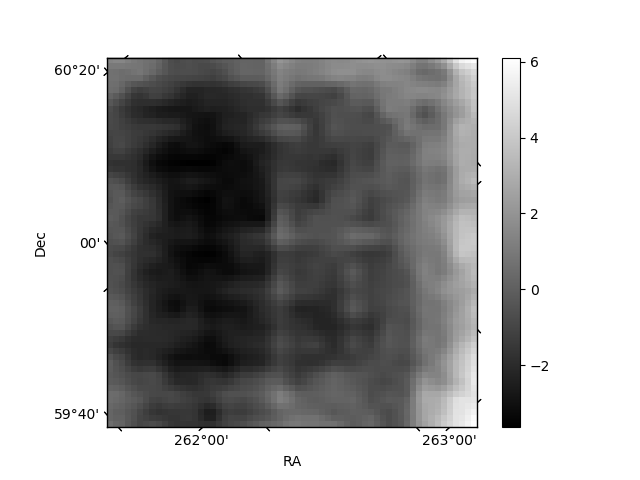
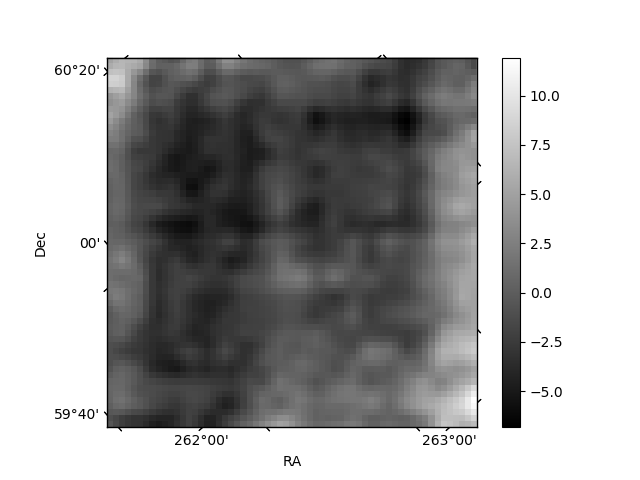
Histogram calculated using DETX and DETY for each event in the final _common_clean file
| Quadrant A | 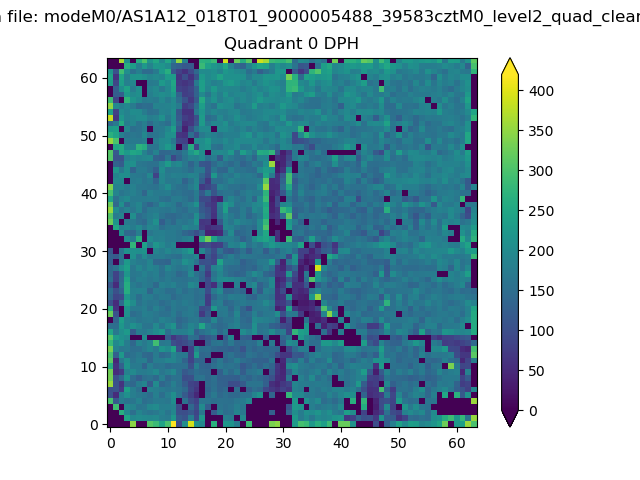 |
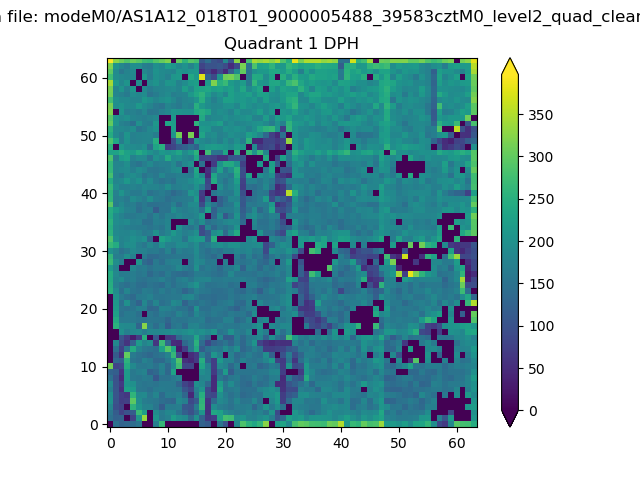 |
Quadrant B |
|---|---|---|---|
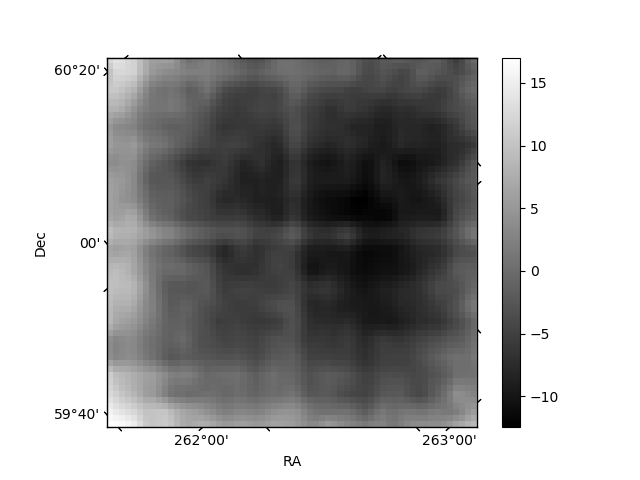
| Quadrant D | 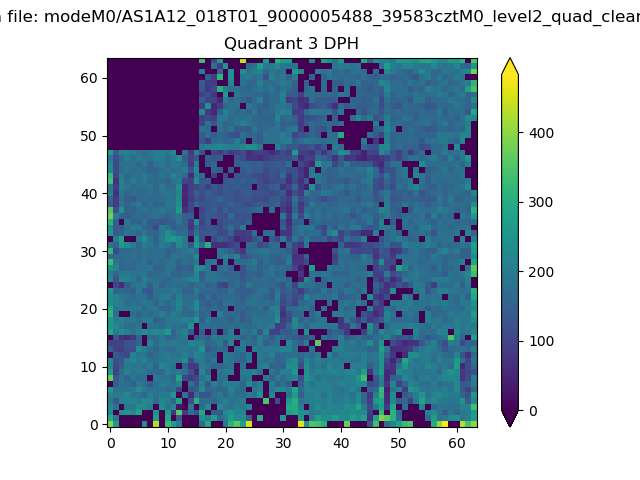 |
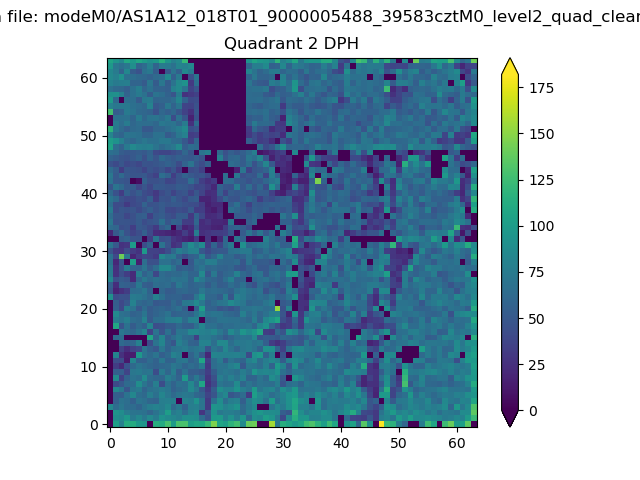 |
Quadrant C |
| Plot type | Count rate plots | Images |
|---|---|---|
| Comparison with Poisson distribution Blue bars denote a histogram of data divided into 1 sec bins. Red curve is a Poisson curve with rate = median count rate of data. |
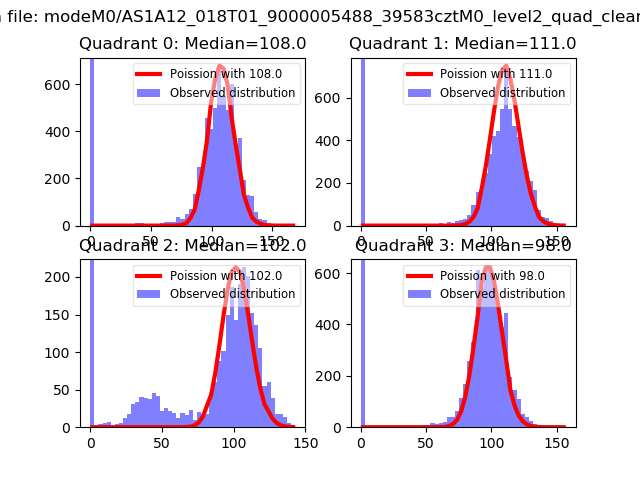 |
 |
| Quadrant-wise count rates Data is divided into 100 sec bins |
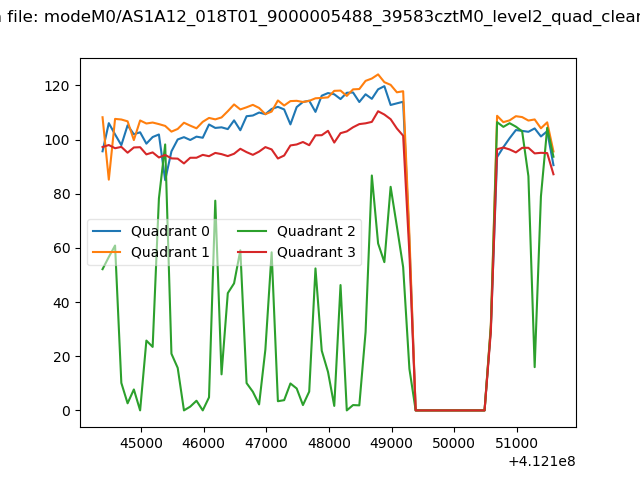 |
|
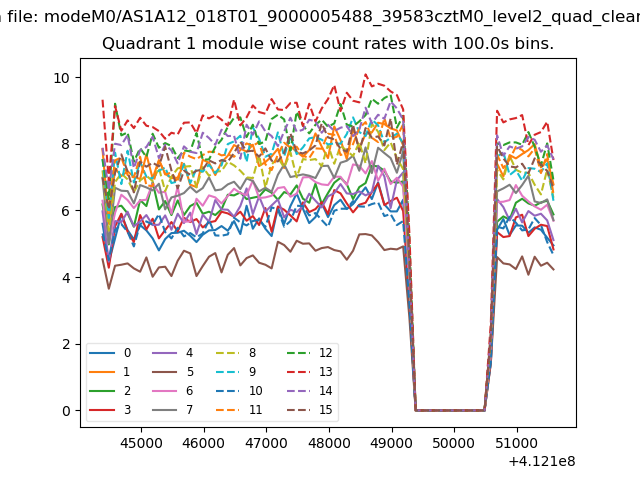
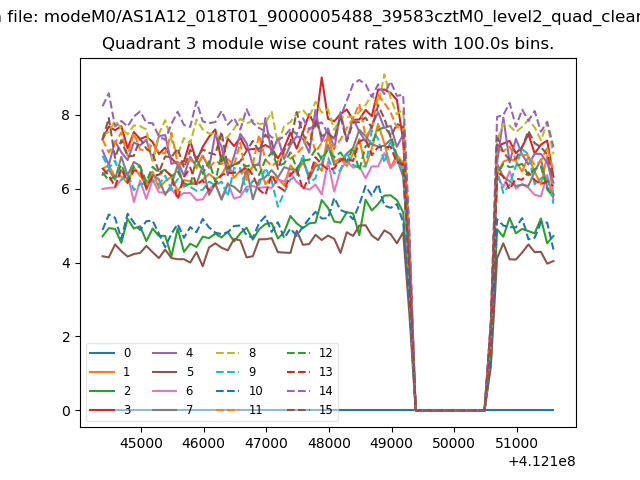
| Module-wise count rates for Quadrant A Data is divided into 100 sec bins |
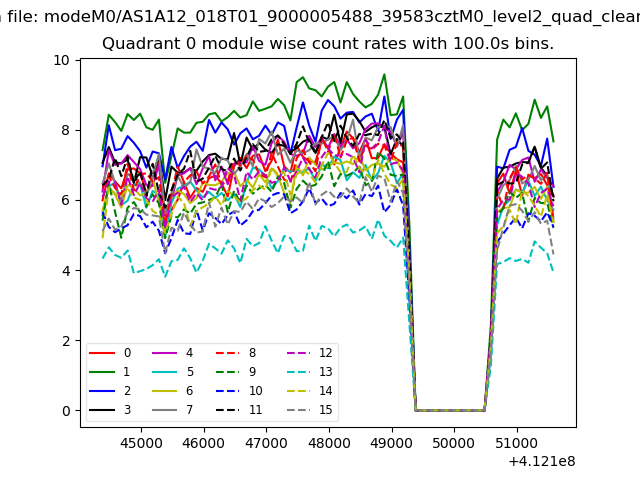 |
 |
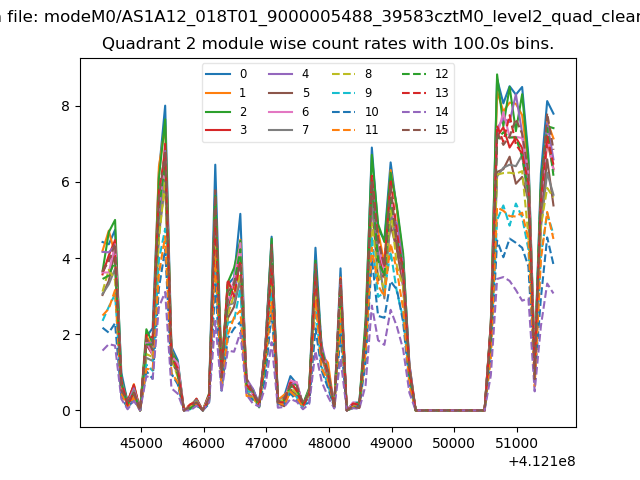
| Module-wise count rates for Quadrant B Data is divided into 100 sec bins |
 |
 |
| Module-wise count rates for Quadrant C Data is divided into 100 sec bins |
 |
 |
| Module-wise count rates for Quadrant D Data is divided into 100 sec bins |
 |
 |
| Parameter | Plot |
|---|---|
| CZT HV Monitor | 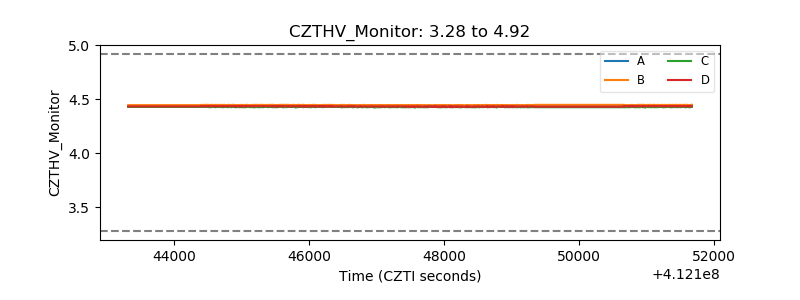 |
| D_VDD | 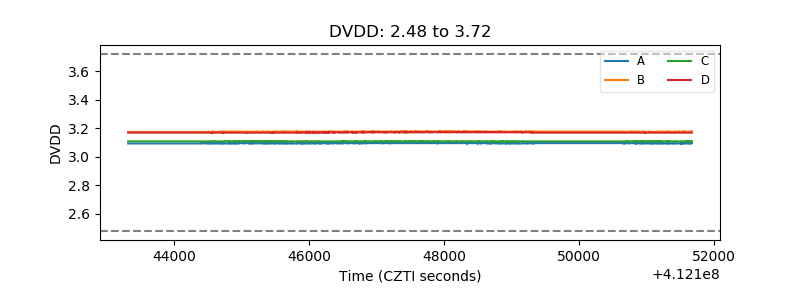 |
| Temperature 1 | 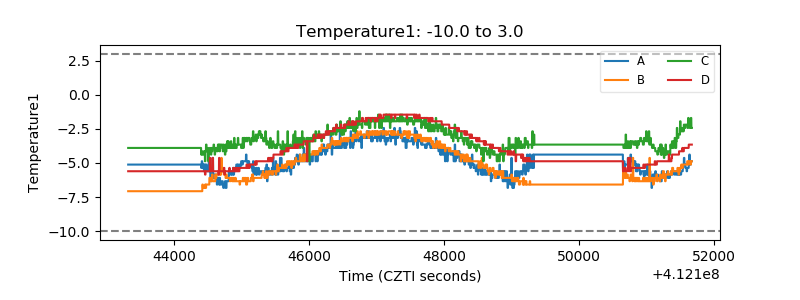 |
| Veto HV Monitor | 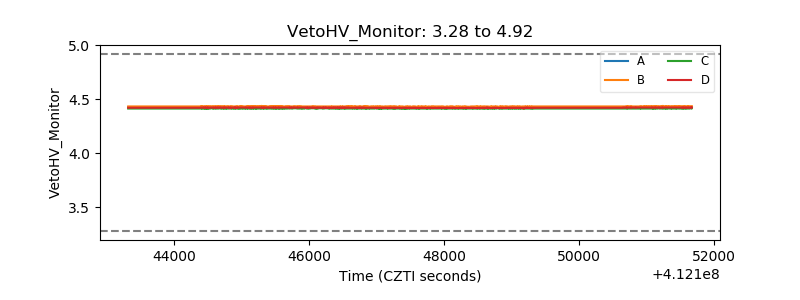 |
| Veto LLD | 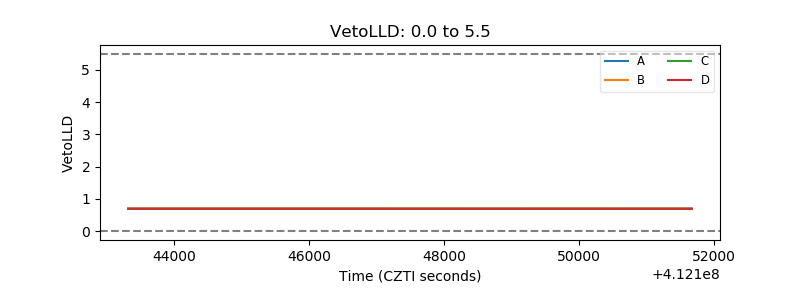 |
| Alpha Counter | 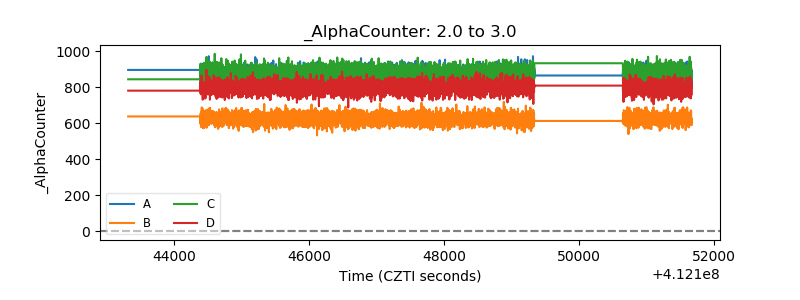 |
| _CPM_Rate | 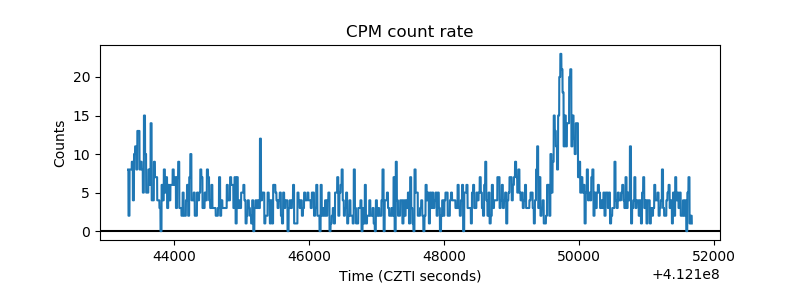 |
| CZT Counter | 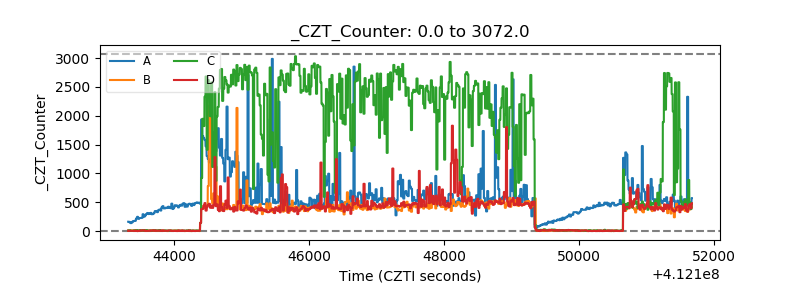 |
| +2.5 Volts monitor | 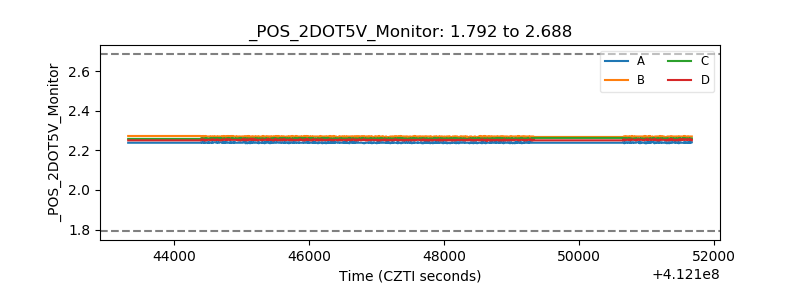 |
| +5 Volts monitor | 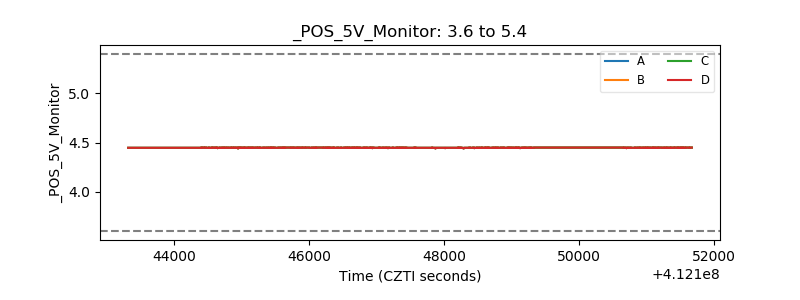 |
| _ROLL_ROT | 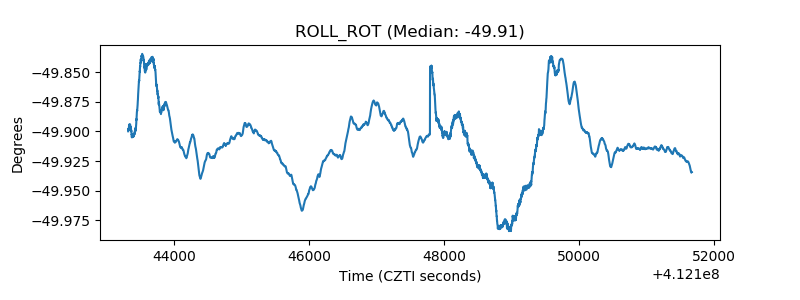 |
| _Roll_DEC | 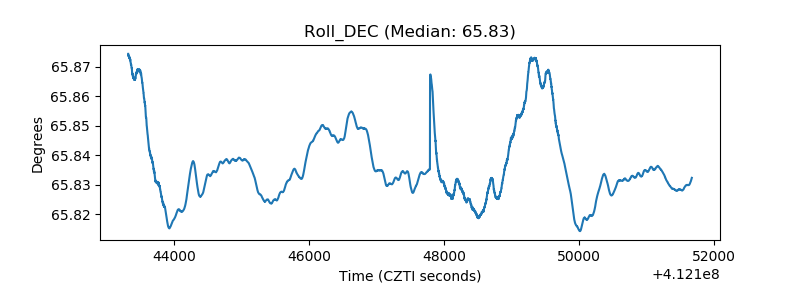 |
| _Roll_RA | 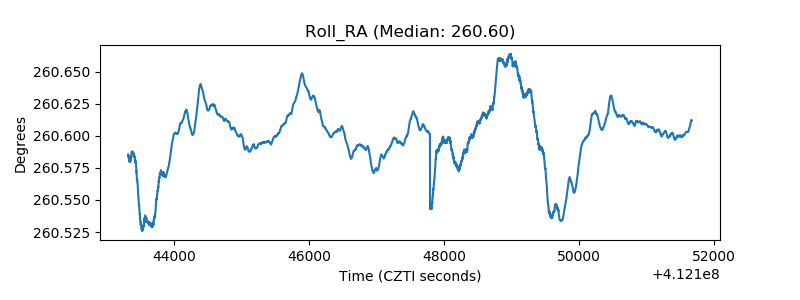 |
| Veto Counter | 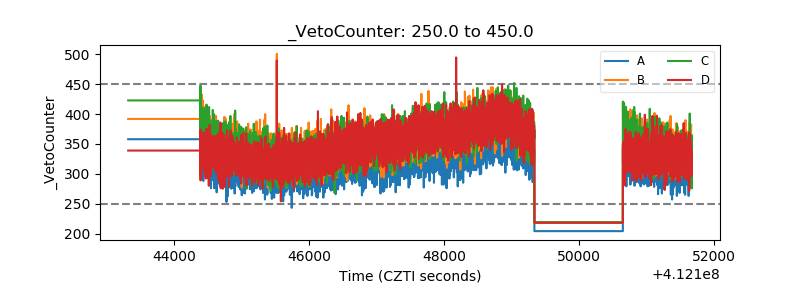 |