| Param | Original file | Final file |
|---|---|---|
| Filename | modeM0/AS1A12_018T01_9000005488_39585cztM0_level2.fits | modeM0/AS1A12_018T01_9000005488_39585cztM0_level2_quad_clean.evt |
| Size (bytes) | 971,400,960 | 154,120,320 |
| Size | 926.4 MB | 147.0 MB |
| Events in quadrant A | 7,403,082 | 1,121,306 |
| Events in quadrant B | 4,692,481 | 1,166,533 |
| Events in quadrant C | 17,336,074 | 643,655 |
| Events in quadrant D | 5,717,134 | 1,010,949 |
| Mode SS | |||
|---|---|---|---|
| Quadrant | BADHDUFLAG | Total packets | Discarded packets |
| A | 0 | 212 | 0 |
| B | 0 | 212 | 0 |
| C | 0 | 212 | 0 |
| D | 0 | 212 | 0 |
| Mode M0 | |||
|---|---|---|---|
| Quadrant | BADHDUFLAG | Total packets | Discarded packets |
| A | 0 | 28910 | 3 |
| B | 0 | 21574 | 2 |
| C | 0 | 58588 | 2 |
| D | 0 | 24214 | 2 |
| Mode M9 | |||
|---|---|---|---|
| Quadrant | BADHDUFLAG | Total packets | Discarded packets |
| A | 0 | 29 | 0 |
| B | 0 | 29 | 0 |
| C | 0 | 29 | 0 |
| D | 0 | 29 | 0 |
| Quadrant | Total seconds | Saturated seconds | Saturation percentage |
|---|---|---|---|
| A | 10451 | 236 | 2.258157% |
| B | 10451 | 45 | 0.430581% |
| C | 10451 | 4714 | 45.105732% |
| D | 10451 | 178 | 1.703186% |
Noise dominated data is calculated using 1-second bins in cleaned event files. If a bin has >2000 counts, and if more than 50% of those come from <1% of pixels, then it is considered to be noise-dominated and hence unusable.
| Quadrant | # 1 sec bins | Bins with >0 counts | Bins with >2000 counts | High rate bins dominated by noise | Noise dominated (total time) | Noise dominated (detector-on time) | Marked lightcurve |
|---|---|---|---|---|---|---|---|
| A | 13287 | 10453 | 170 | 170 | 1.28% | 1.63% | 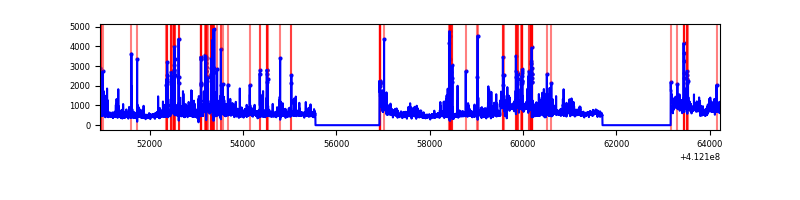 |
| B | 13287 | 10453 | 20 | 20 | 0.15% | 0.19% | 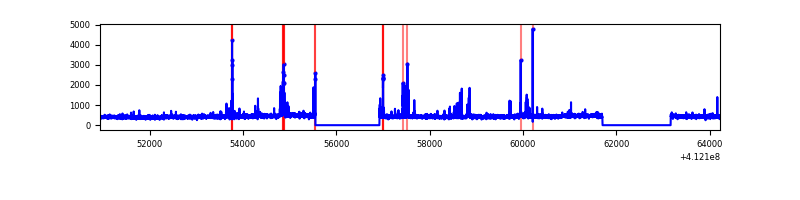 |
| C | 13287 | 10453 | 4162 | 4162 | 31.32% | 39.82% | 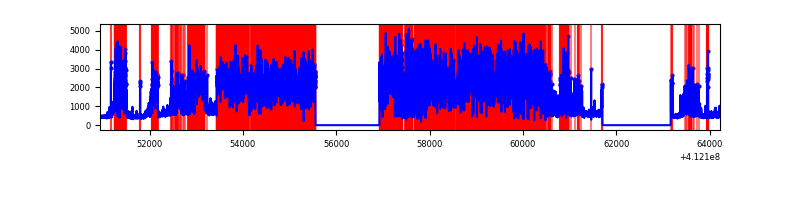 |
| D | 13287 | 10453 | 147 | 147 | 1.11% | 1.41% | 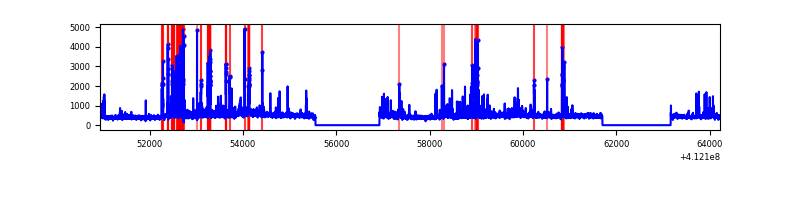 |
Top three noisy pixels from each quadrant. If the there are fewer than three noisy pixels in the level2.evt file, extra rows are filled as -1
| Pixel properties | Quadrant properties | ||||||
|---|---|---|---|---|---|---|---|
| Quadrant | DetID | PixID | Counts | Sigma | Mean | Median | Sigma |
| A | 15 | 222 | 1489014 | 6599.03 | 1118 | 1097 | 225.5 |
| A | 9 | 143 | 751253 | 3327.0 | 1118 | 1097 | 225.5 |
| A | 10 | 83 | 697588 | 3088.99 | 1118 | 1097 | 225.5 |
| B | 5 | 255 | 148446 | 681.78 | 1120 | 1087 | 216.1 |
| B | 5 | 172 | 82846 | 378.27 | 1120 | 1087 | 216.1 |
| B | 12 | 111 | 27499 | 122.2 | 1120 | 1087 | 216.1 |
| C | 15 | 208 | 7964645 | 38932.29 | 878 | 882 | 204.6 |
| C | 9 | 187 | 5569917 | 27225.23 | 878 | 882 | 204.6 |
| C | 15 | 214 | 369187 | 1800.53 | 878 | 882 | 204.6 |
| D | 12 | 227 | 431748 | 1606.77 | 1097 | 1066 | 268.0 |
| D | 13 | 249 | 416342 | 1549.3 | 1097 | 1066 | 268.0 |
| D | 13 | 174 | 254016 | 943.7 | 1097 | 1066 | 268.0 |
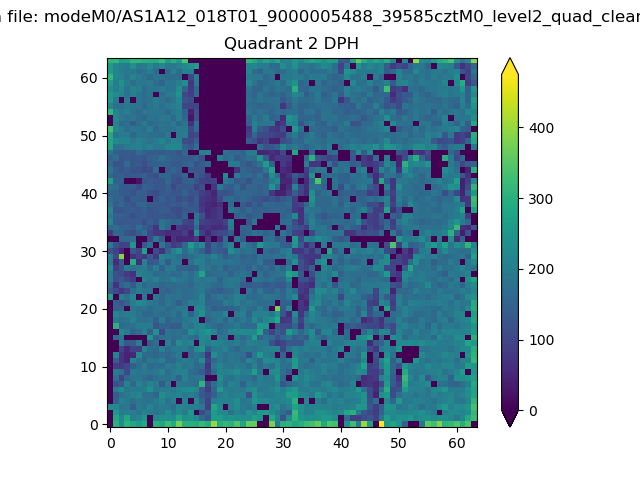
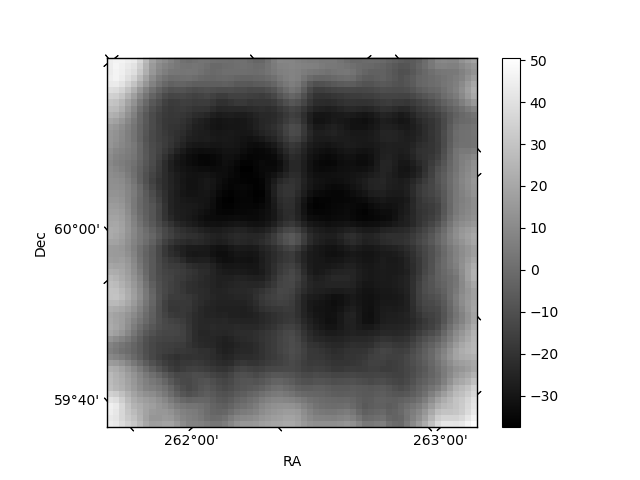
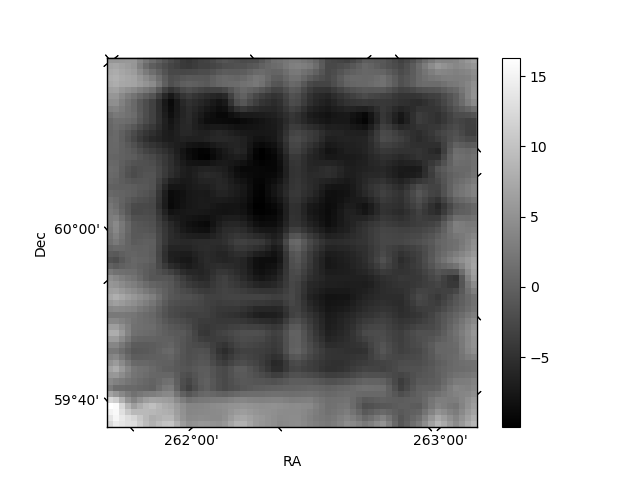
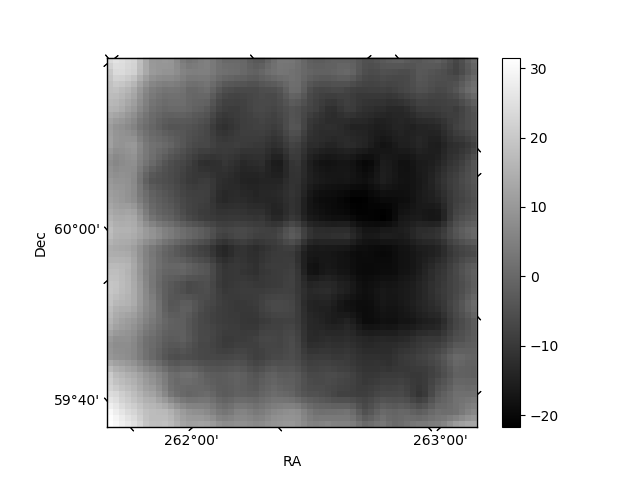
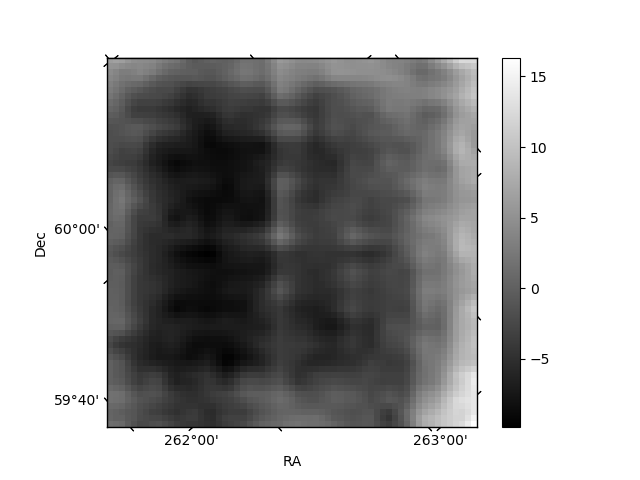
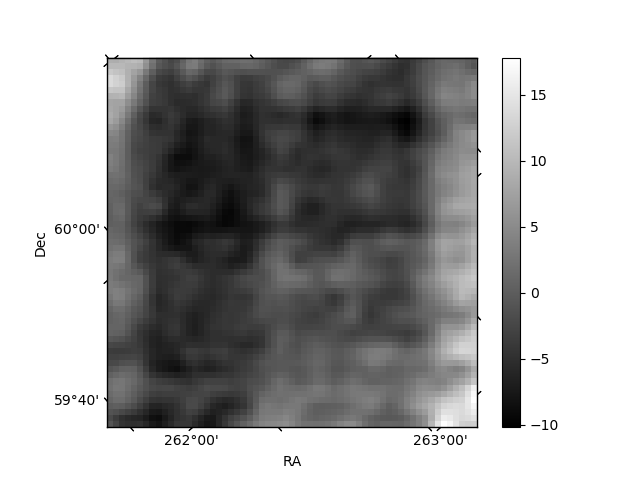
Histogram calculated using DETX and DETY for each event in the final _common_clean file
| Quadrant A | 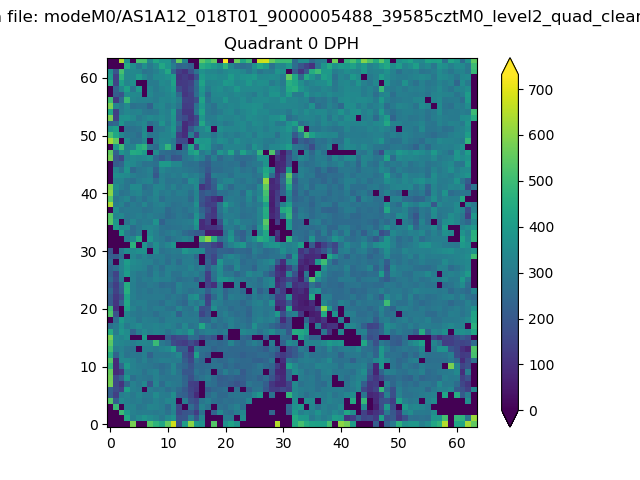 |
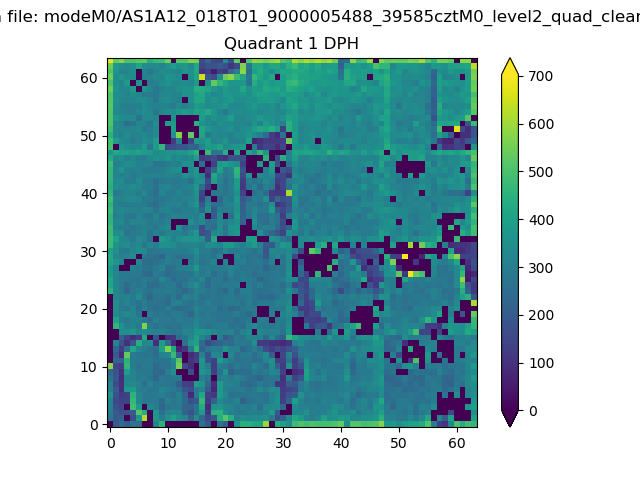 |
Quadrant B |
|---|---|---|---|
| Quadrant D | 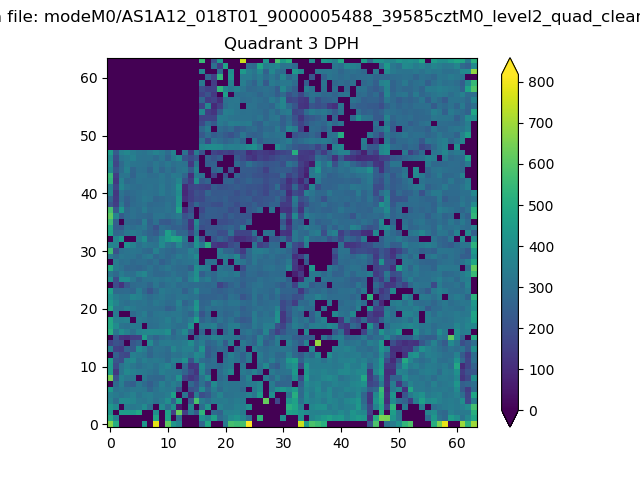 |
 |
Quadrant C |
| Plot type | Count rate plots | Images |
|---|---|---|
| Comparison with Poisson distribution Blue bars denote a histogram of data divided into 1 sec bins. Red curve is a Poisson curve with rate = median count rate of data. |
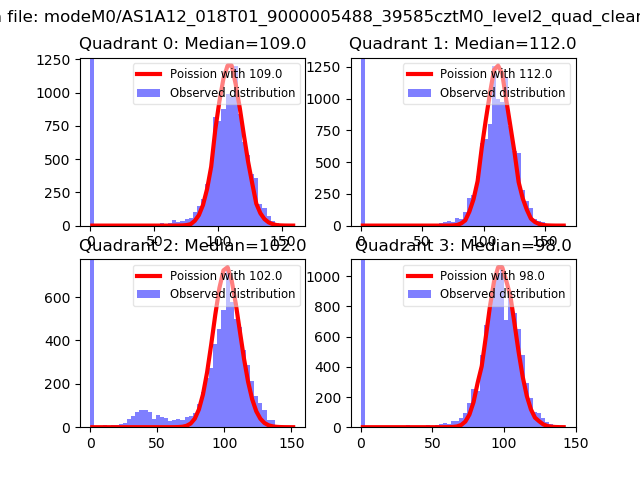 |
 |
| Quadrant-wise count rates Data is divided into 100 sec bins |
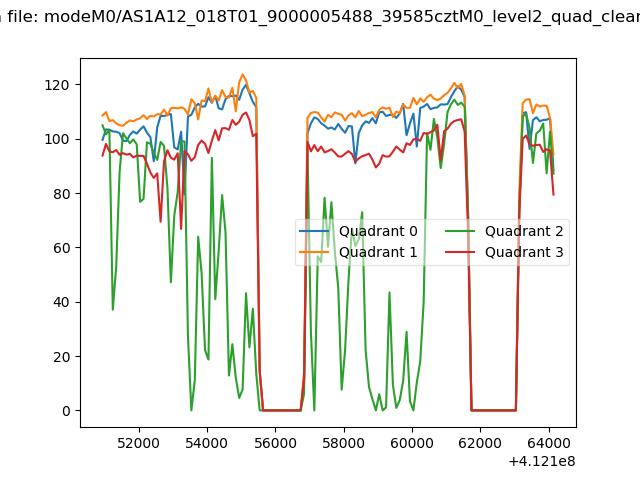 |
|
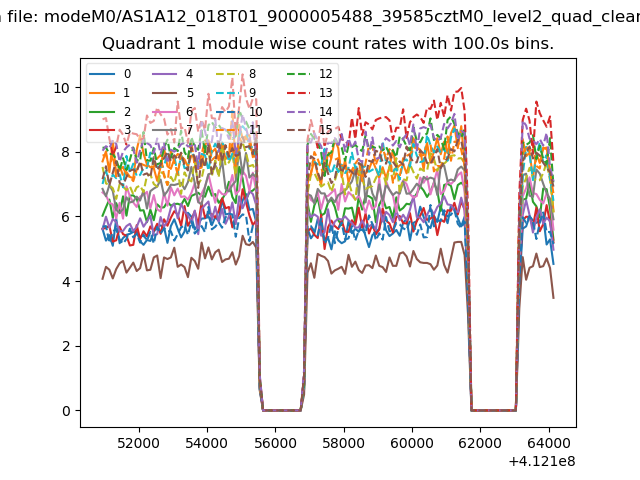
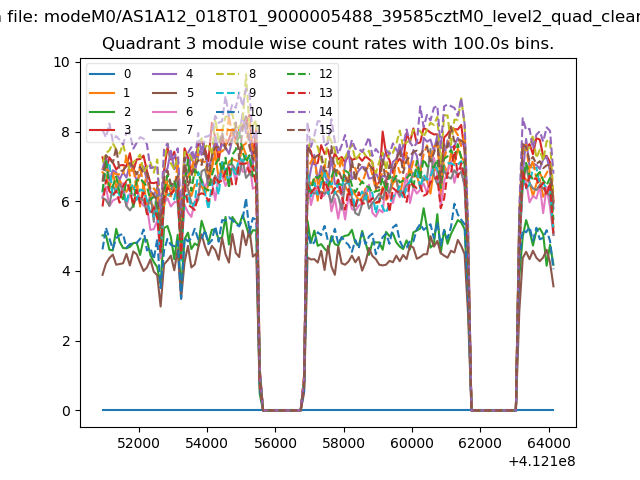
| Module-wise count rates for Quadrant A Data is divided into 100 sec bins |
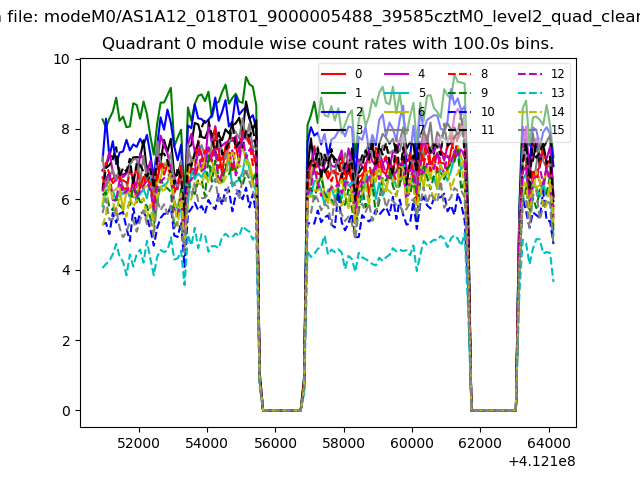 |
 |
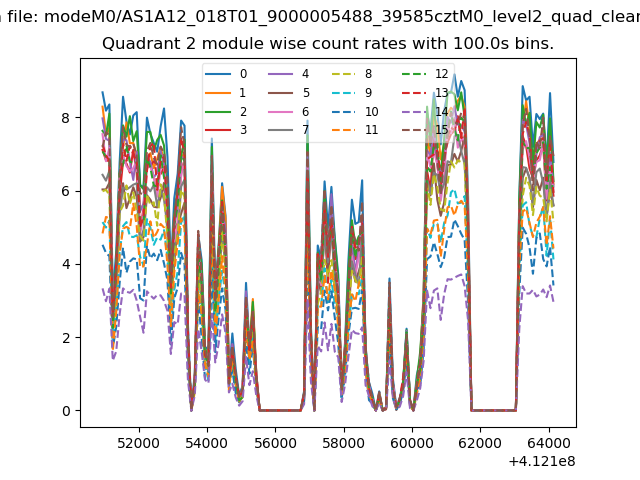
| Module-wise count rates for Quadrant B Data is divided into 100 sec bins |
 |
 |
| Module-wise count rates for Quadrant C Data is divided into 100 sec bins |
 |
 |
| Module-wise count rates for Quadrant D Data is divided into 100 sec bins |
 |
 |
| Parameter | Plot |
|---|---|
| CZT HV Monitor | 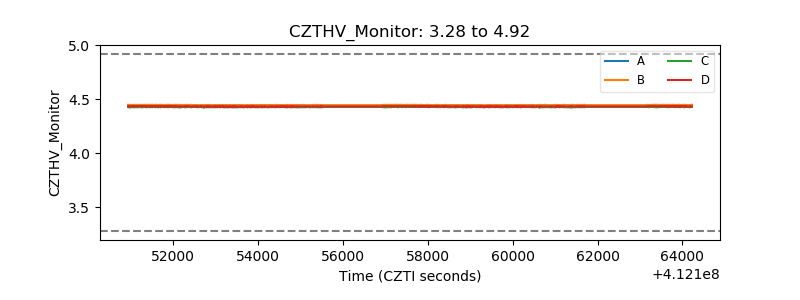 |
| D_VDD | 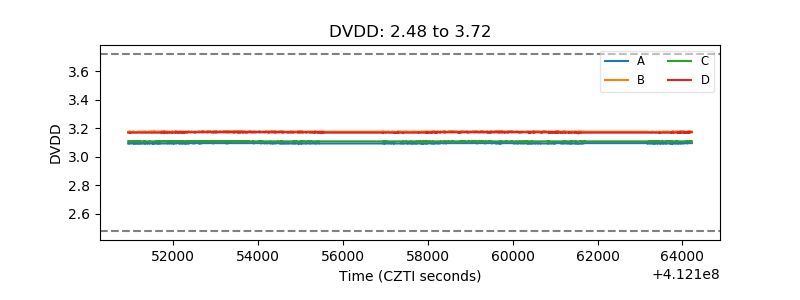 |
| Temperature 1 | 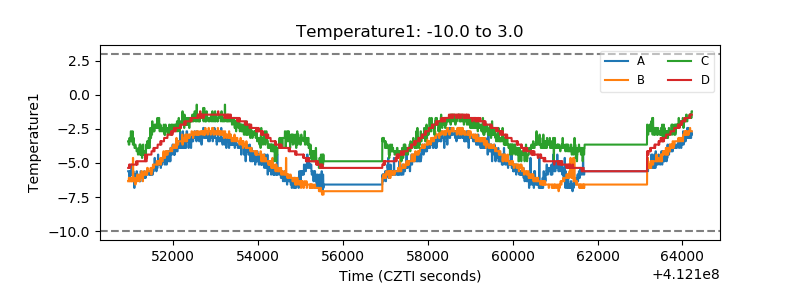 |
| Veto HV Monitor | 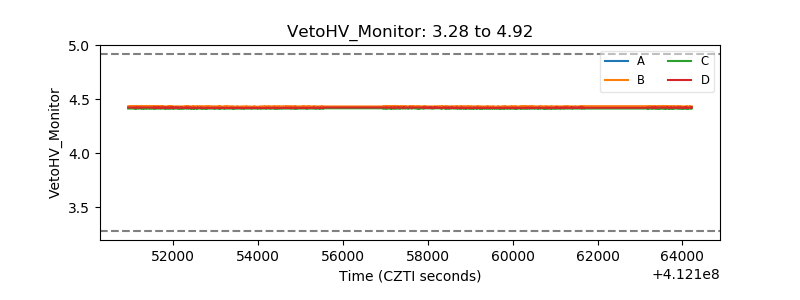 |
| Veto LLD | 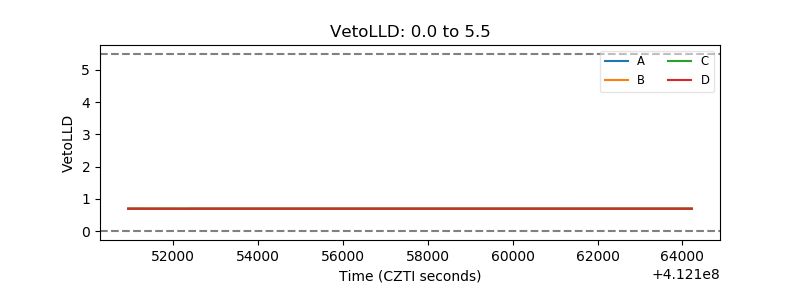 |
| Alpha Counter | 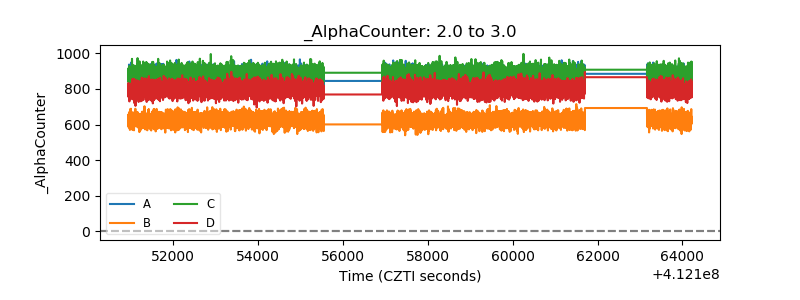 |
| _CPM_Rate | 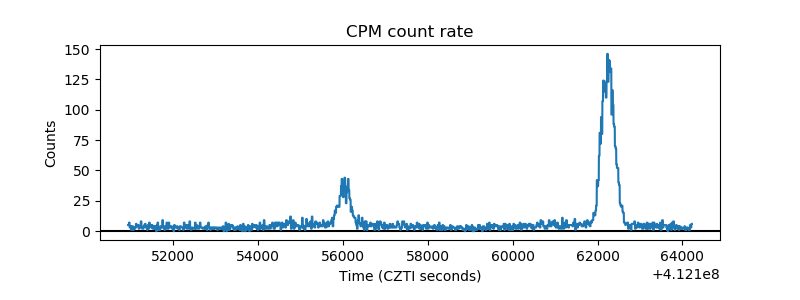 |
| CZT Counter | 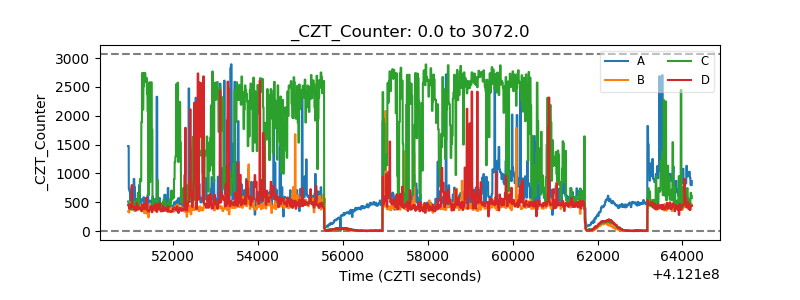 |
| +2.5 Volts monitor | 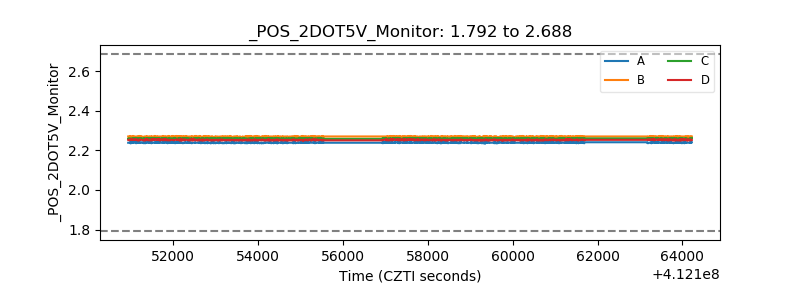 |
| +5 Volts monitor | 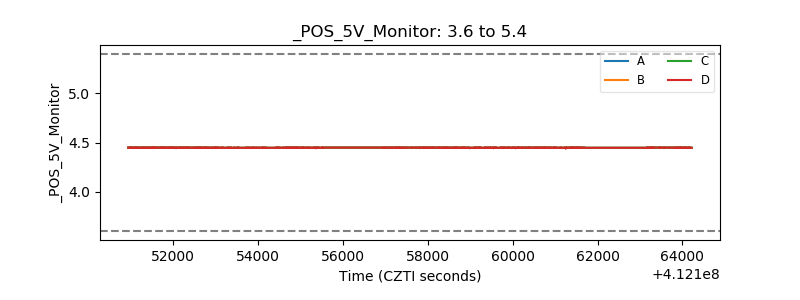 |
| _ROLL_ROT | 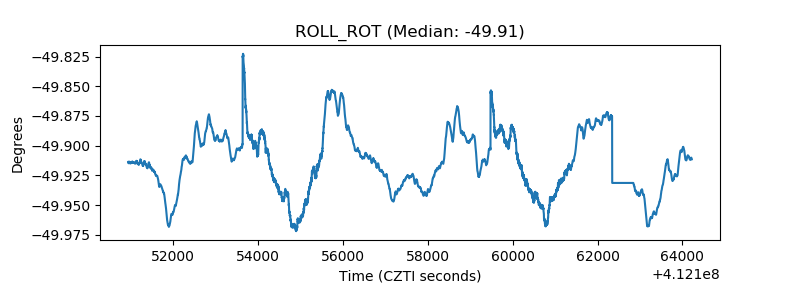 |
| _Roll_DEC | 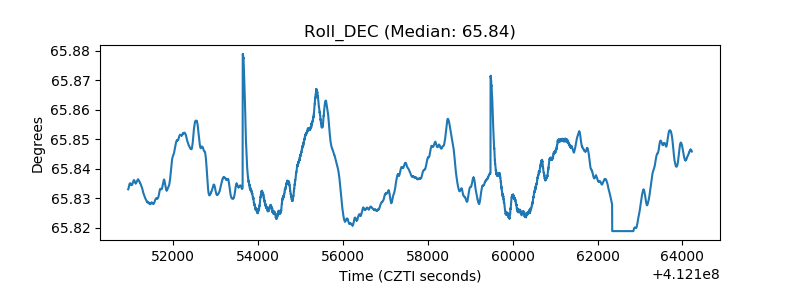 |
| _Roll_RA | 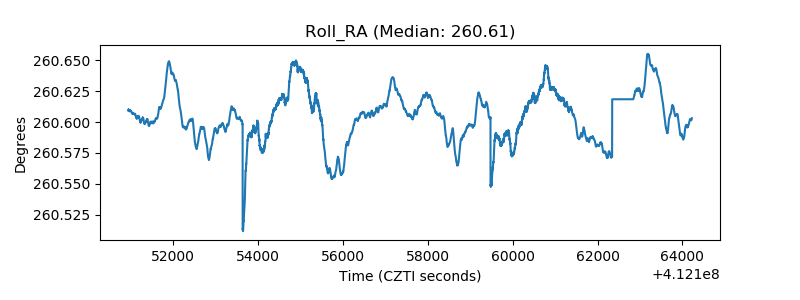 |
| Veto Counter | 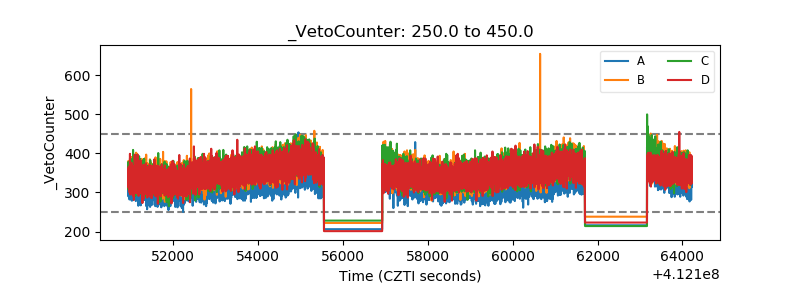 |