| Param | Original file | Final file |
|---|---|---|
| Filename | modeM0/AS1A12_018T01_9000005488_39586cztM0_level2.fits | modeM0/AS1A12_018T01_9000005488_39586cztM0_level2_quad_clean.evt |
| Size (bytes) | 533,747,520 | 86,618,880 |
| Size | 509.0 MB | 82.6 MB |
| Events in quadrant A | 7,670,627 | 492,459 |
| Events in quadrant B | 2,618,126 | 639,915 |
| Events in quadrant C | 5,900,139 | 533,035 |
| Events in quadrant D | 3,128,146 | 559,974 |
| Mode SS | |||
|---|---|---|---|
| Quadrant | BADHDUFLAG | Total packets | Discarded packets |
| A | 0 | 116 | 0 |
| B | 0 | 116 | 0 |
| C | 0 | 116 | 0 |
| D | 0 | 116 | 0 |
| Mode M0 | |||
|---|---|---|---|
| Quadrant | BADHDUFLAG | Total packets | Discarded packets |
| A | 0 | 26686 | 3 |
| B | 0 | 11823 | 2 |
| C | 0 | 21296 | 2 |
| D | 0 | 13057 | 2 |
| Mode M9 | |||
|---|---|---|---|
| Quadrant | BADHDUFLAG | Total packets | Discarded packets |
| A | 0 | 18 | 0 |
| B | 0 | 18 | 0 |
| C | 0 | 18 | 0 |
| D | 0 | 19 | 0 |
| Quadrant | Total seconds | Saturated seconds | Saturation percentage |
|---|---|---|---|
| A | 5677 | 1413 | 24.889907% |
| B | 5677 | 37 | 0.651753% |
| C | 5677 | 834 | 14.690858% |
| D | 5677 | 39 | 0.686983% |
Noise dominated data is calculated using 1-second bins in cleaned event files. If a bin has >2000 counts, and if more than 50% of those come from <1% of pixels, then it is considered to be noise-dominated and hence unusable.
| Quadrant | # 1 sec bins | Bins with >0 counts | Bins with >2000 counts | High rate bins dominated by noise | Noise dominated (total time) | Noise dominated (detector-on time) | Marked lightcurve |
|---|---|---|---|---|---|---|---|
| A | 7259 | 5678 | 1390 | 1390 | 19.15% | 24.48% | 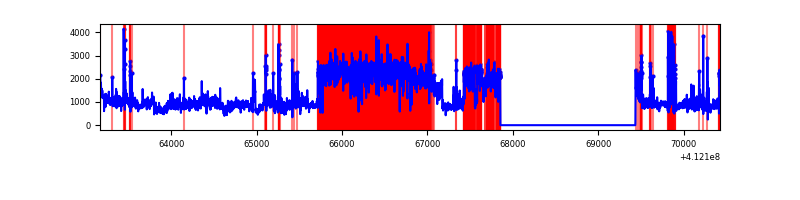 |
| B | 7259 | 5678 | 21 | 21 | 0.29% | 0.37% | 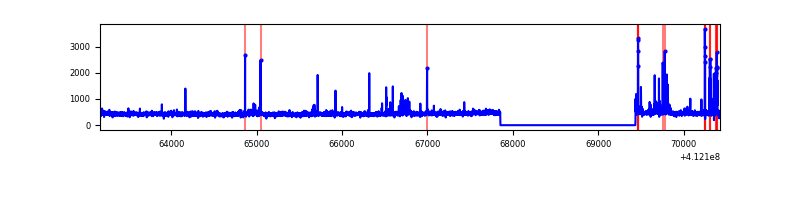 |
| C | 7259 | 5678 | 750 | 750 | 10.33% | 13.21% | 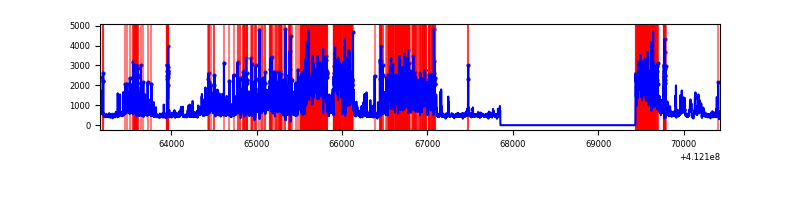 |
| D | 7259 | 5678 | 26 | 26 | 0.36% | 0.46% | 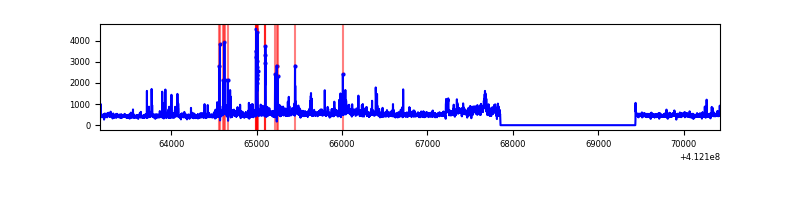 |
Top three noisy pixels from each quadrant. If the there are fewer than three noisy pixels in the level2.evt file, extra rows are filled as -1
| Pixel properties | Quadrant properties | ||||||
|---|---|---|---|---|---|---|---|
| Quadrant | DetID | PixID | Counts | Sigma | Mean | Median | Sigma |
| A | 15 | 222 | 4497406 | 37864.97 | 583 | 571 | 118.8 |
| A | 10 | 83 | 444010 | 3733.92 | 583 | 571 | 118.8 |
| A | 9 | 143 | 276569 | 2324.0 | 583 | 571 | 118.8 |
| B | 5 | 172 | 125411 | 1043.62 | 611 | 594 | 119.6 |
| B | 5 | 255 | 55928 | 462.66 | 611 | 594 | 119.6 |
| B | 0 | 230 | 16896 | 136.3 | 611 | 594 | 119.6 |
| C | 15 | 208 | 1851988 | 13972.8 | 569 | 572 | 132.5 |
| C | 9 | 187 | 1572812 | 11865.83 | 569 | 572 | 132.5 |
| C | 15 | 214 | 241751 | 1820.2 | 569 | 572 | 132.5 |
| D | 13 | 174 | 407474 | 2760.9 | 601 | 584 | 147.4 |
| D | 1 | 52 | 167890 | 1135.23 | 601 | 584 | 147.4 |
| D | 13 | 249 | 112715 | 760.85 | 601 | 584 | 147.4 |
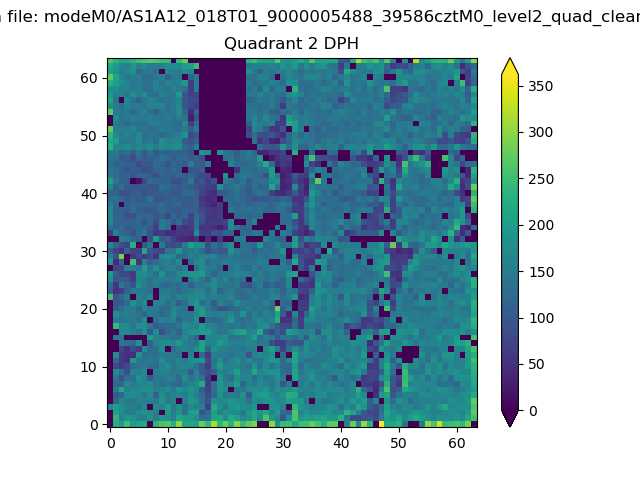
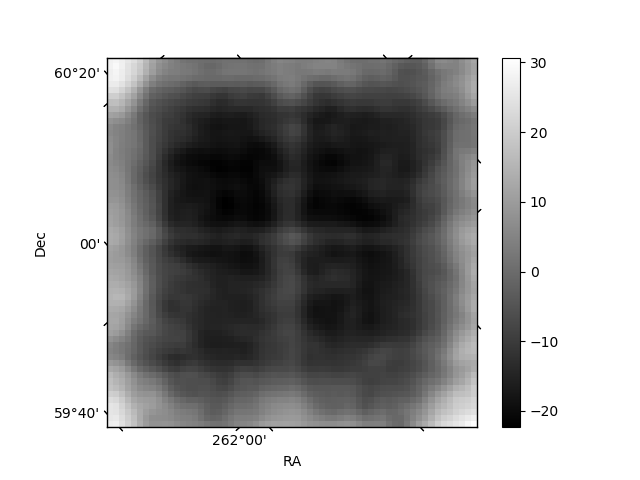
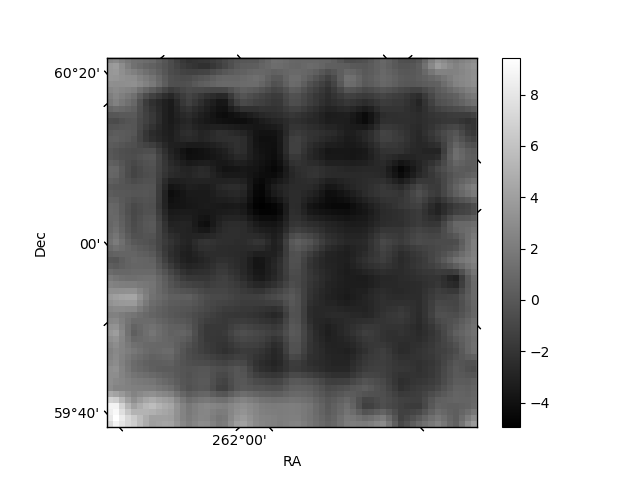
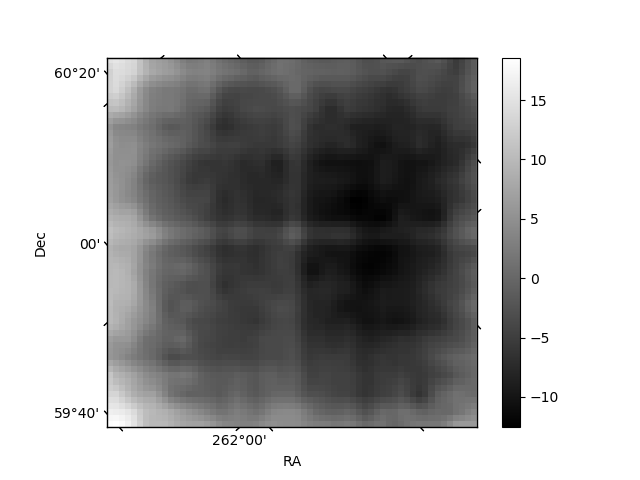
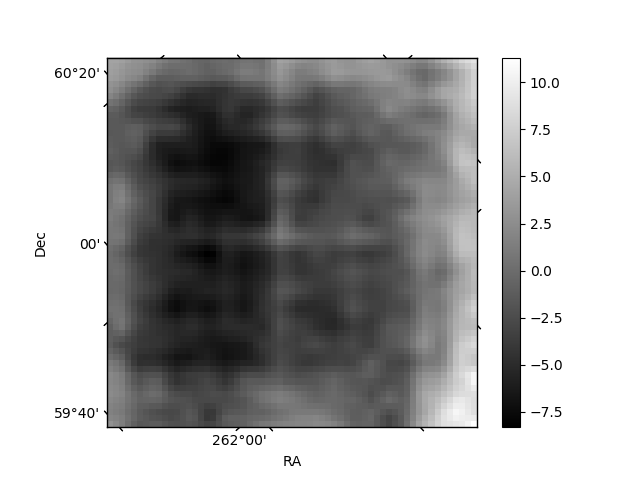
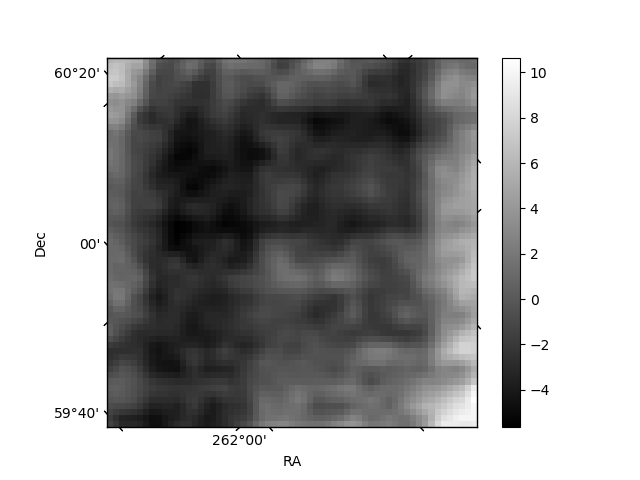
Histogram calculated using DETX and DETY for each event in the final _common_clean file
| Quadrant A | 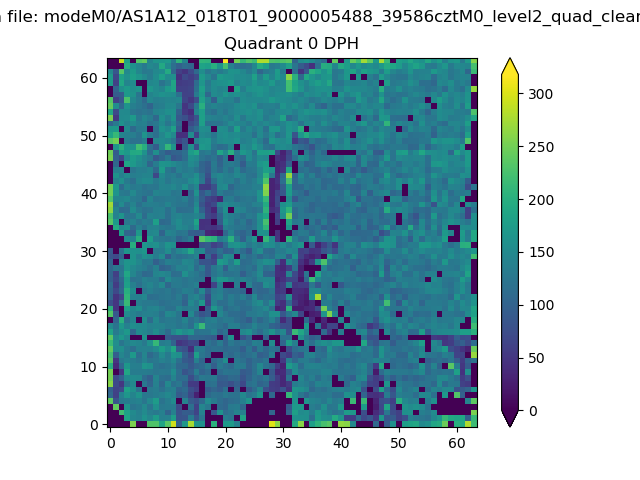 |
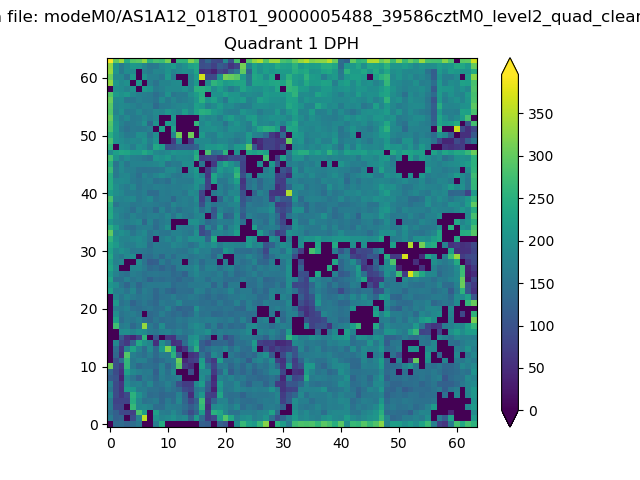 |
Quadrant B |
|---|---|---|---|
| Quadrant D | 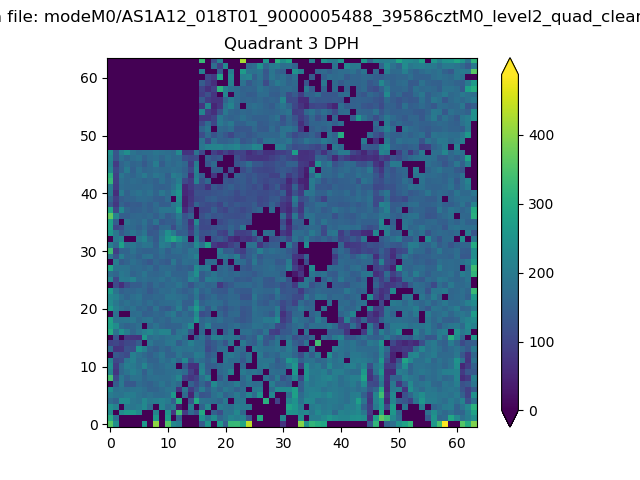 |
 |
Quadrant C |
| Plot type | Count rate plots | Images |
|---|---|---|
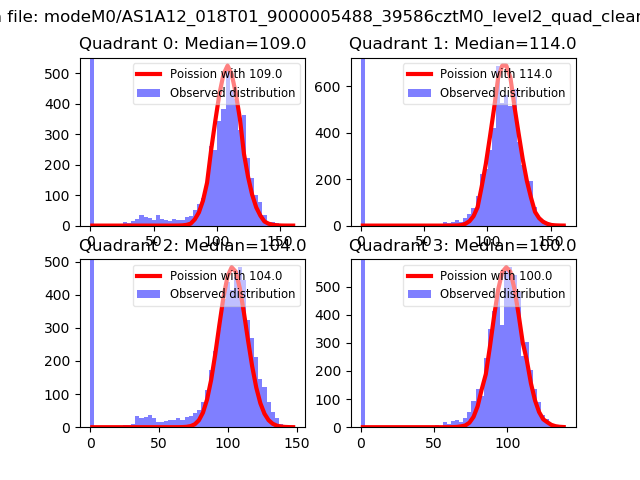
| Comparison with Poisson distribution Blue bars denote a histogram of data divided into 1 sec bins. Red curve is a Poisson curve with rate = median count rate of data. |
 |
 |
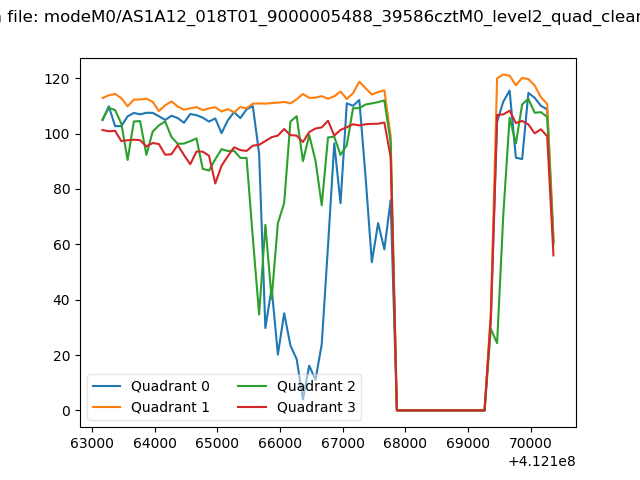
| Quadrant-wise count rates Data is divided into 100 sec bins |
 |
|
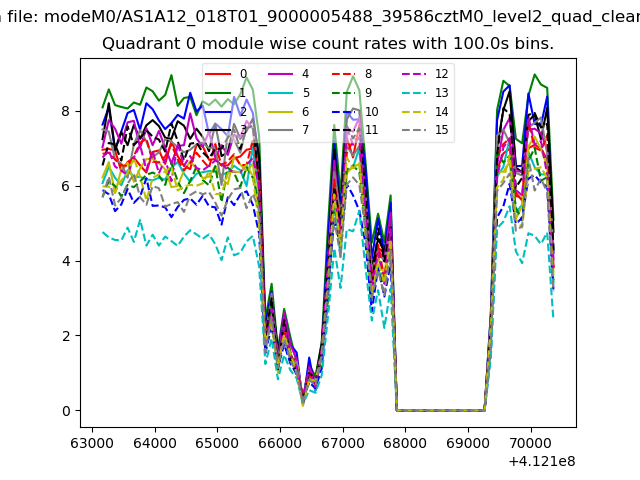
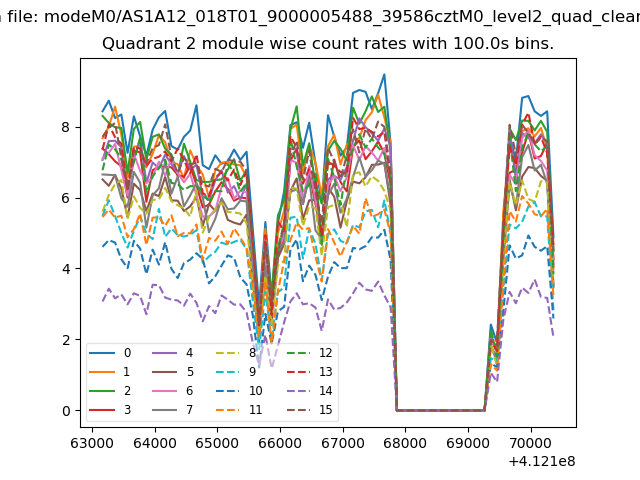
| Module-wise count rates for Quadrant A Data is divided into 100 sec bins |
 |
 |
| Module-wise count rates for Quadrant B Data is divided into 100 sec bins |
 |
 |
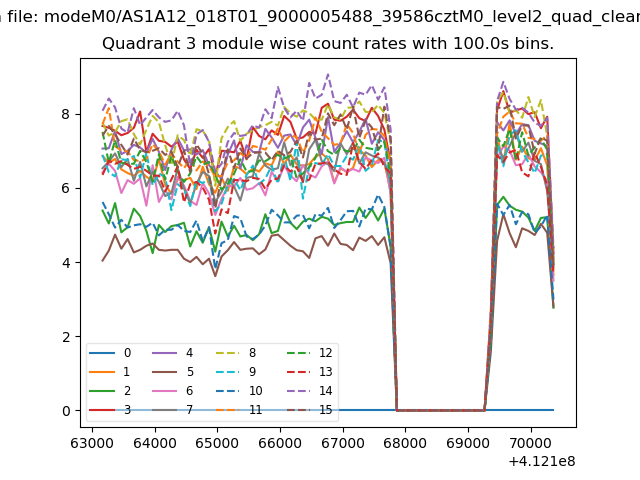
| Module-wise count rates for Quadrant C Data is divided into 100 sec bins |
 |
 |
| Module-wise count rates for Quadrant D Data is divided into 100 sec bins |
 |
 |
| Parameter | Plot |
|---|---|
| CZT HV Monitor | 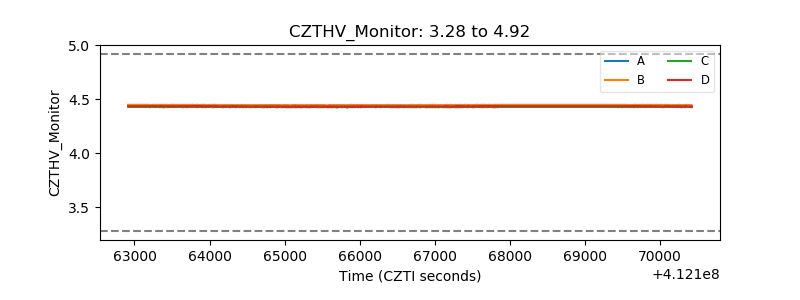 |
| D_VDD | 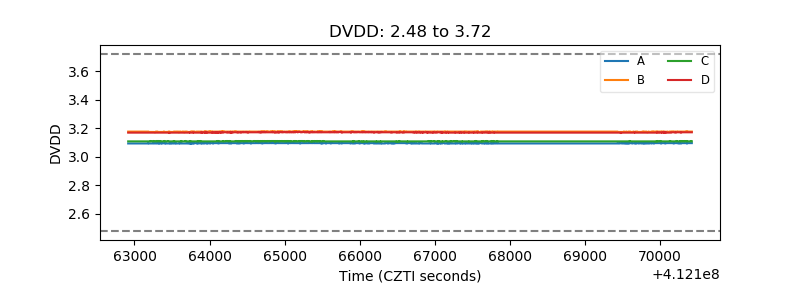 |
| Temperature 1 | 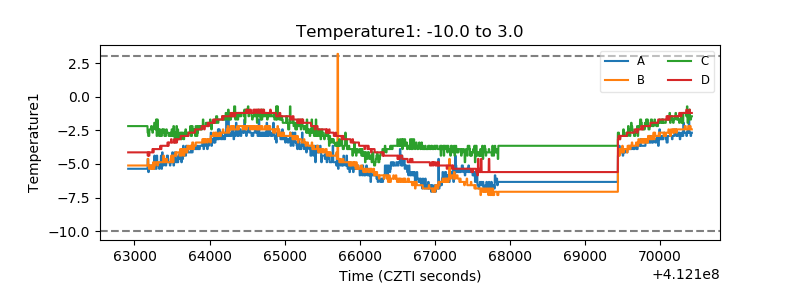 |
| Veto HV Monitor |  |
| Veto LLD | 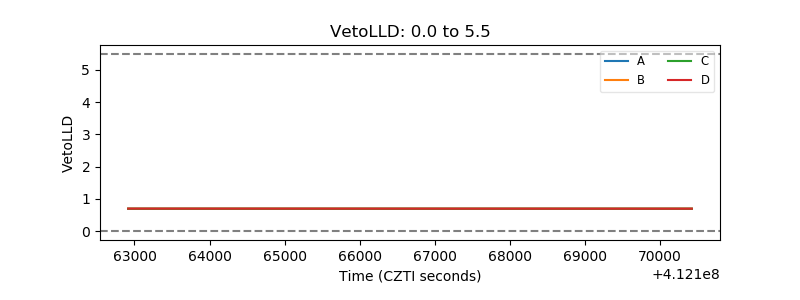 |
| Alpha Counter | 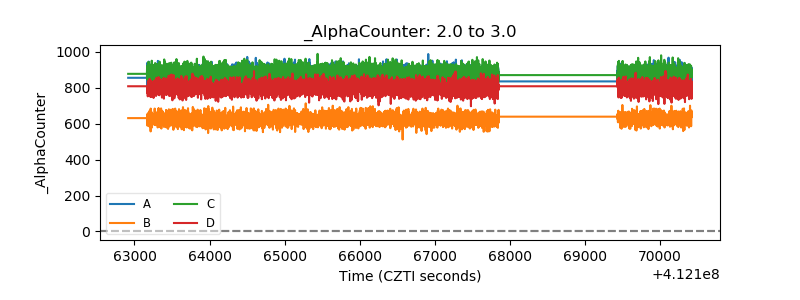 |
| _CPM_Rate | 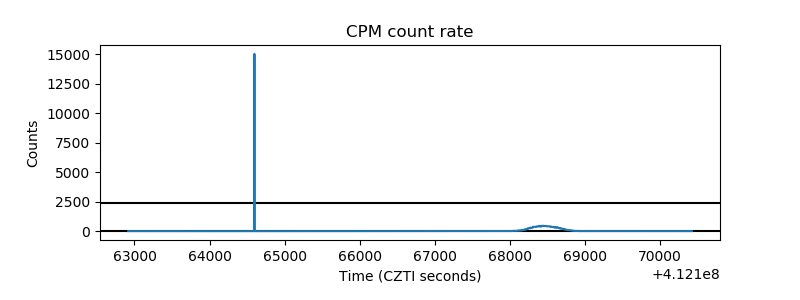 |
| CZT Counter | 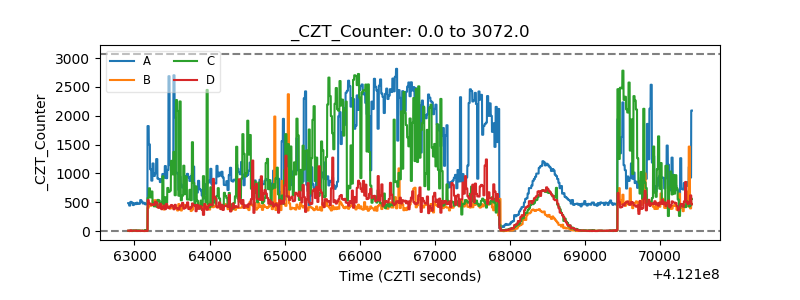 |
| +2.5 Volts monitor | 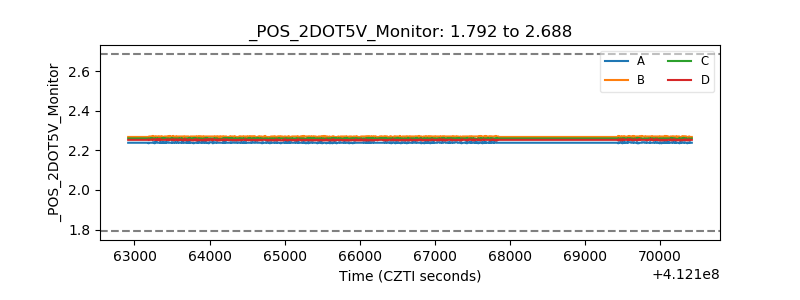 |
| +5 Volts monitor | 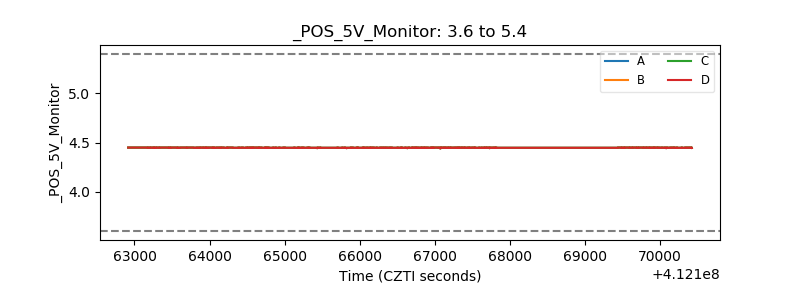 |
| _ROLL_ROT | 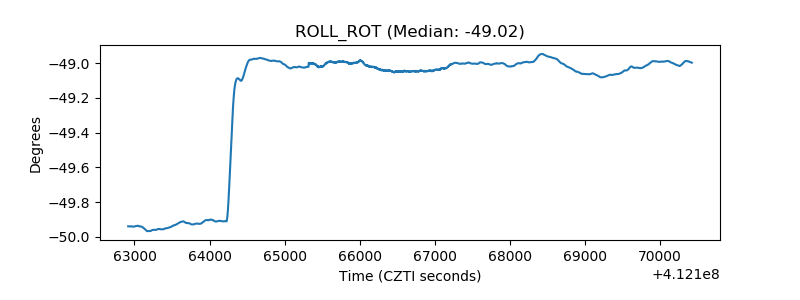 |
| _Roll_DEC | 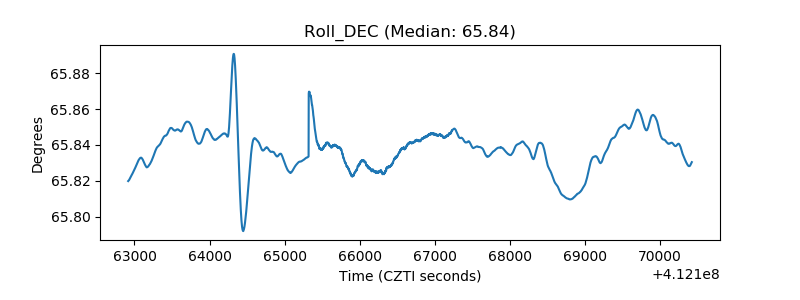 |
| _Roll_RA | 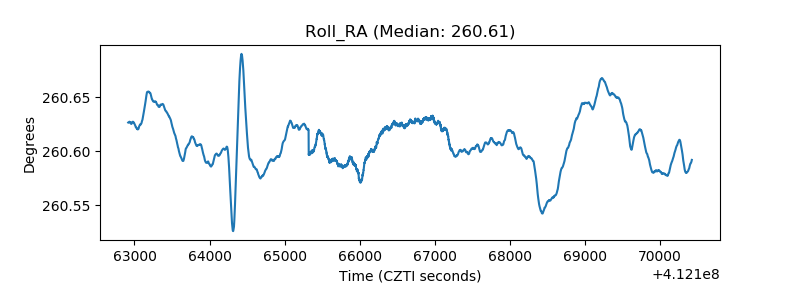 |
| Veto Counter | 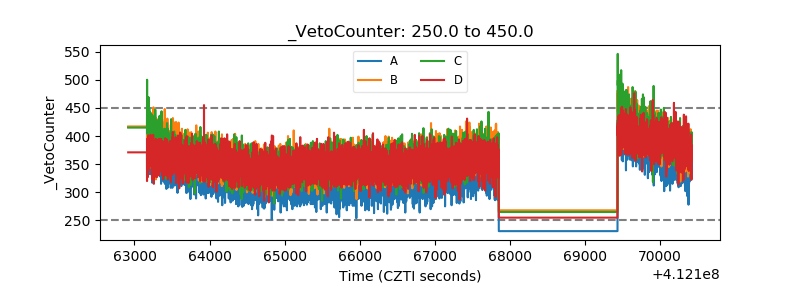 |