| Param | Original file | Final file |
|---|---|---|
| Filename | modeM0/AS1A12_018T01_9000005488_39587cztM0_level2.fits | modeM0/AS1A12_018T01_9000005488_39587cztM0_level2_quad_clean.evt |
| Size (bytes) | 447,569,280 | 88,920,000 |
| Size | 426.8 MB | 84.8 MB |
| Events in quadrant A | 5,412,230 | 567,886 |
| Events in quadrant B | 2,621,852 | 636,063 |
| Events in quadrant C | 5,308,065 | 548,381 |
| Events in quadrant D | 2,801,102 | 557,917 |
| Mode SS | |||
|---|---|---|---|
| Quadrant | BADHDUFLAG | Total packets | Discarded packets |
| A | 0 | 110 | 0 |
| B | 0 | 110 | 0 |
| C | 0 | 110 | 0 |
| D | 0 | 110 | 0 |
| Mode M0 | |||
|---|---|---|---|
| Quadrant | BADHDUFLAG | Total packets | Discarded packets |
| A | 0 | 19834 | 3 |
| B | 0 | 11677 | 2 |
| C | 0 | 19551 | 2 |
| D | 0 | 11858 | 2 |
| Mode M9 | |||
|---|---|---|---|
| Quadrant | BADHDUFLAG | Total packets | Discarded packets |
| A | 0 | 17 | 0 |
| B | 0 | 17 | 0 |
| C | 0 | 17 | 0 |
| D | 0 | 18 | 0 |
| Quadrant | Total seconds | Saturated seconds | Saturation percentage |
|---|---|---|---|
| A | 5462 | 586 | 10.728671% |
| B | 5462 | 52 | 0.952032% |
| C | 5462 | 604 | 11.058220% |
| D | 5462 | 39 | 0.714024% |
Noise dominated data is calculated using 1-second bins in cleaned event files. If a bin has >2000 counts, and if more than 50% of those come from <1% of pixels, then it is considered to be noise-dominated and hence unusable.
| Quadrant | # 1 sec bins | Bins with >0 counts | Bins with >2000 counts | High rate bins dominated by noise | Noise dominated (total time) | Noise dominated (detector-on time) | Marked lightcurve |
|---|---|---|---|---|---|---|---|
| A | 7165 | 5463 | 550 | 550 | 7.68% | 10.07% | 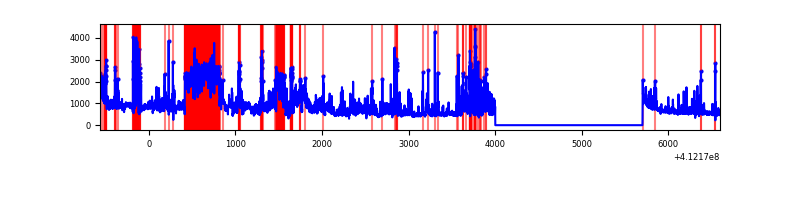 |
| B | 7165 | 5463 | 27 | 27 | 0.38% | 0.49% | 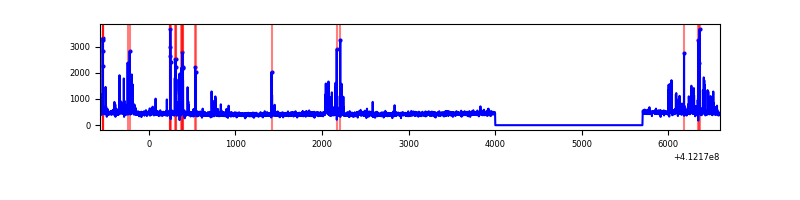 |
| C | 7165 | 5463 | 551 | 551 | 7.69% | 10.09% | 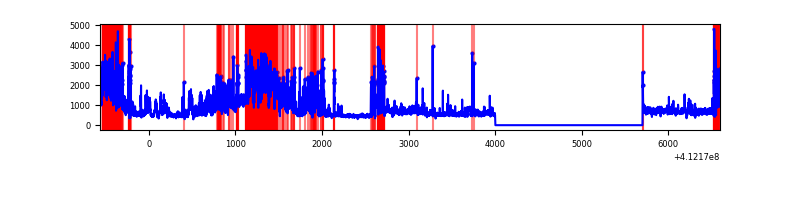 |
| D | 7165 | 5463 | 24 | 24 | 0.33% | 0.44% | 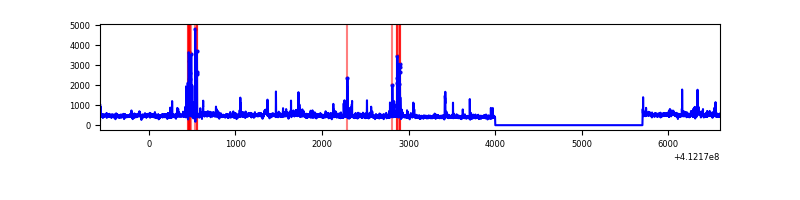 |
Top three noisy pixels from each quadrant. If the there are fewer than three noisy pixels in the level2.evt file, extra rows are filled as -1
| Pixel properties | Quadrant properties | ||||||
|---|---|---|---|---|---|---|---|
| Quadrant | DetID | PixID | Counts | Sigma | Mean | Median | Sigma |
| A | 15 | 222 | 1973073 | 16486.27 | 585 | 574 | 119.6 |
| A | 9 | 143 | 518083 | 4325.37 | 585 | 574 | 119.6 |
| A | 10 | 83 | 443233 | 3699.77 | 585 | 574 | 119.6 |
| B | 5 | 172 | 254103 | 2187.61 | 595 | 578 | 115.9 |
| B | 5 | 255 | 26774 | 226.04 | 595 | 578 | 115.9 |
| B | 12 | 111 | 14174 | 117.32 | 595 | 578 | 115.9 |
| C | 9 | 187 | 1637270 | 12405.28 | 568 | 570 | 131.9 |
| C | 15 | 208 | 1195047 | 9053.47 | 568 | 570 | 131.9 |
| C | 15 | 214 | 235851 | 1783.3 | 568 | 570 | 131.9 |
| D | 13 | 174 | 153286 | 1063.35 | 589 | 572 | 143.6 |
| D | 1 | 52 | 147581 | 1023.63 | 589 | 572 | 143.6 |
| D | 13 | 249 | 145464 | 1008.89 | 589 | 572 | 143.6 |
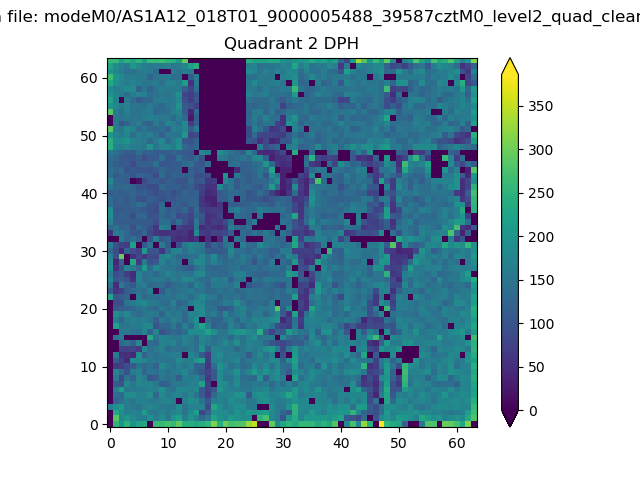
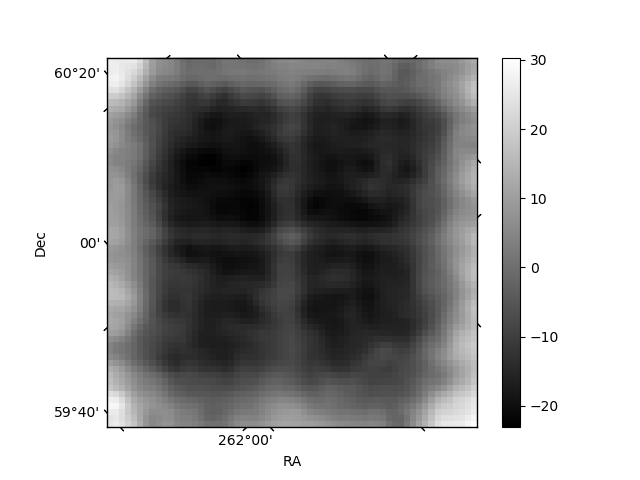
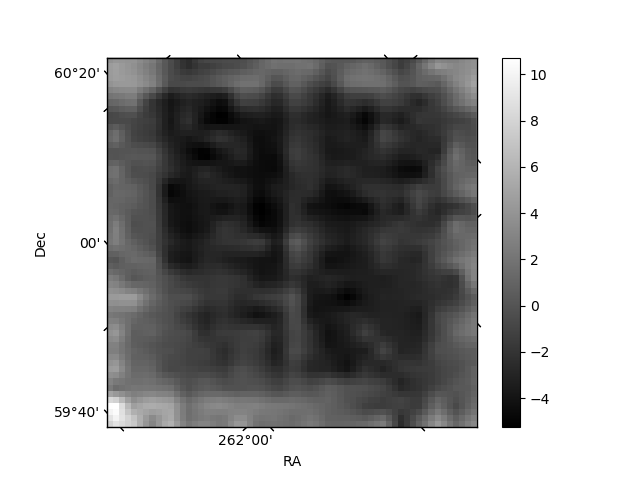
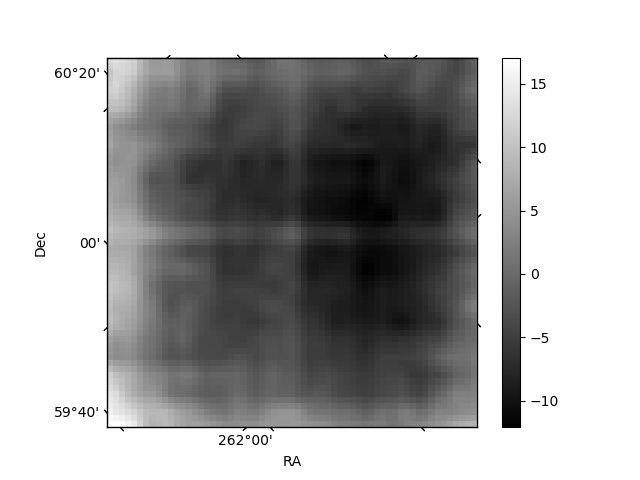
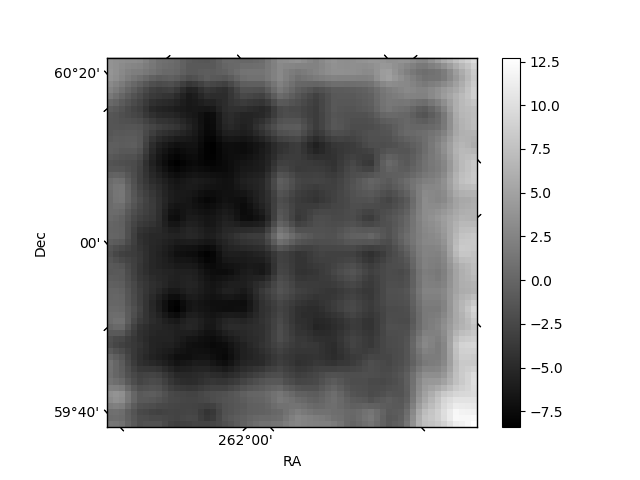
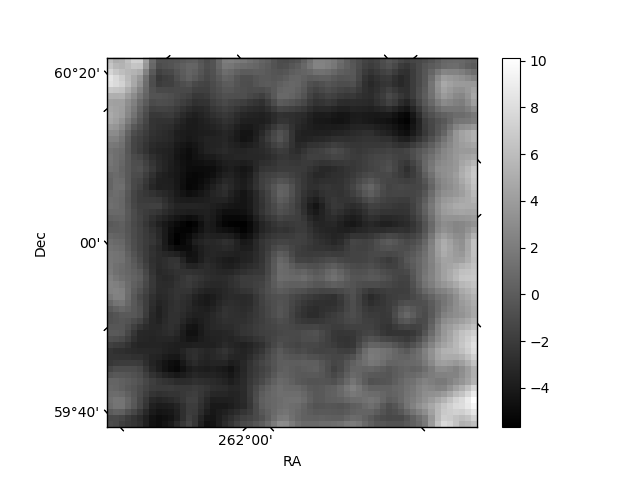
Histogram calculated using DETX and DETY for each event in the final _common_clean file
| Quadrant A | 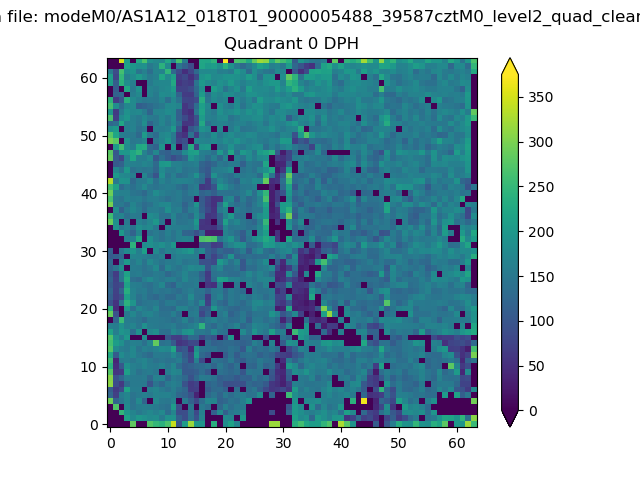 |
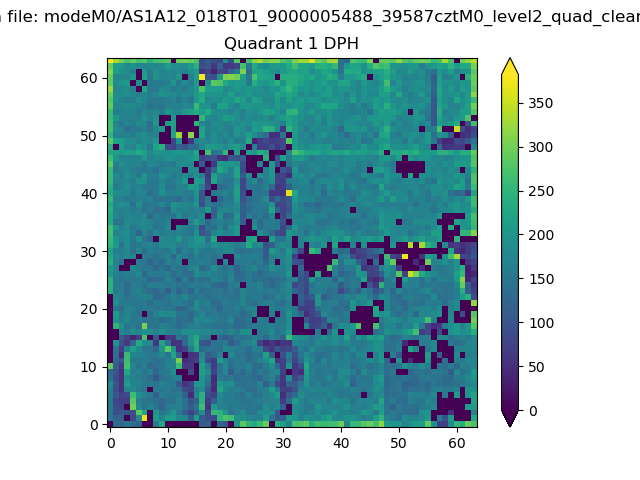 |
Quadrant B |
|---|---|---|---|
| Quadrant D | 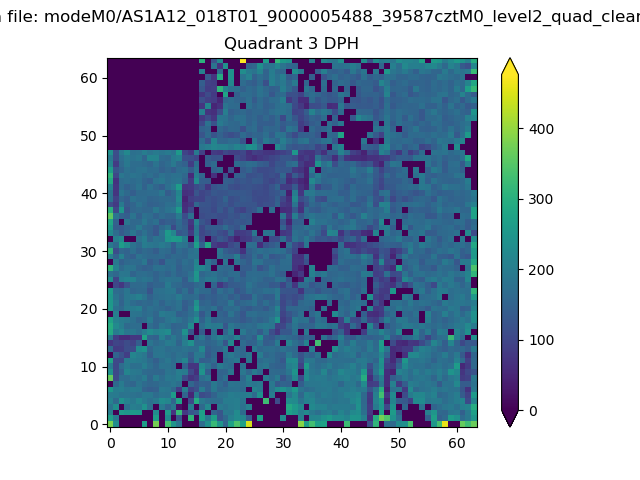 |
 |
Quadrant C |
| Plot type | Count rate plots | Images |
|---|---|---|
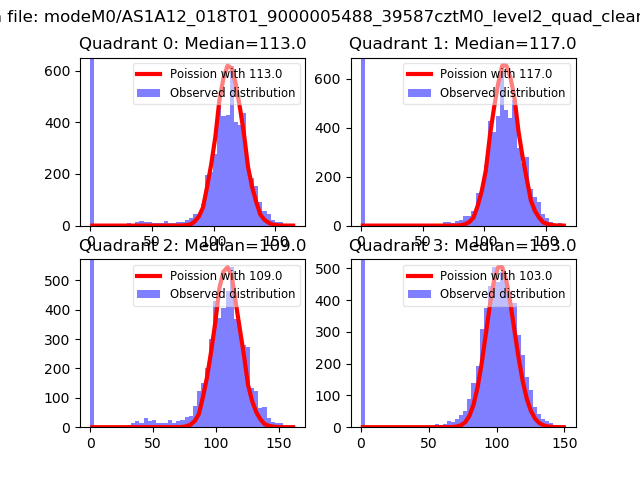
| Comparison with Poisson distribution Blue bars denote a histogram of data divided into 1 sec bins. Red curve is a Poisson curve with rate = median count rate of data. |
 |
 |
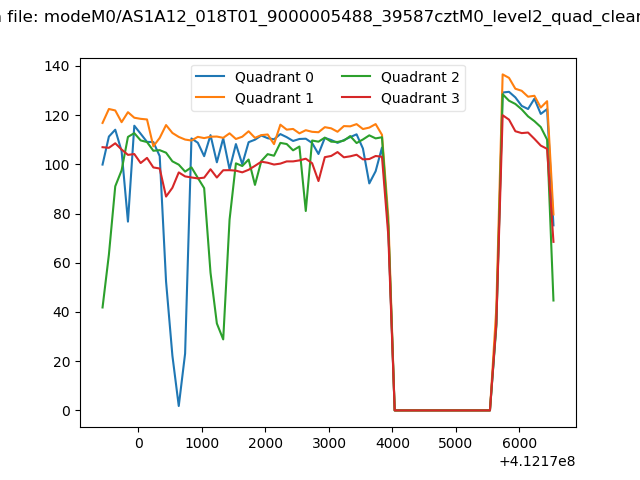
| Quadrant-wise count rates Data is divided into 100 sec bins |
 |
|
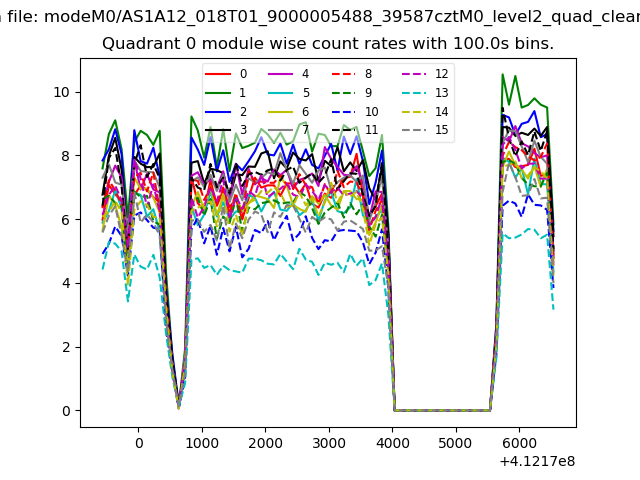
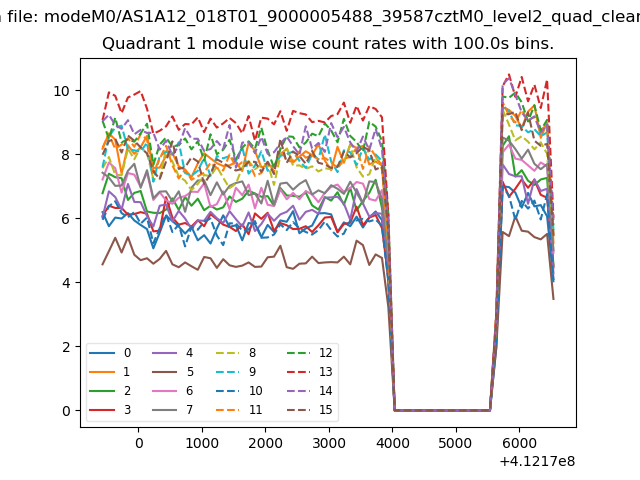
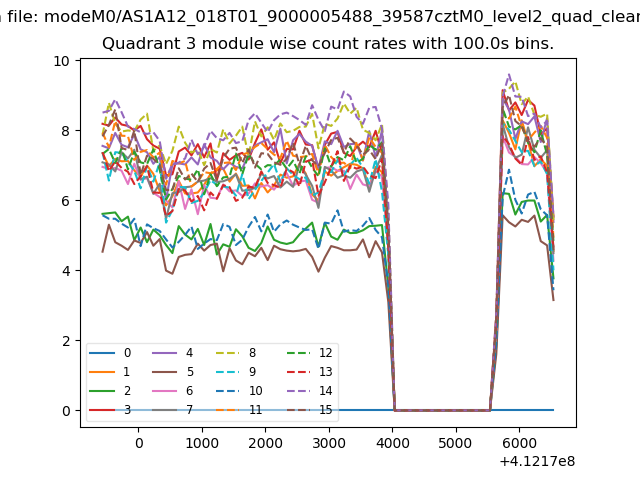
| Module-wise count rates for Quadrant A Data is divided into 100 sec bins |
 |
 |
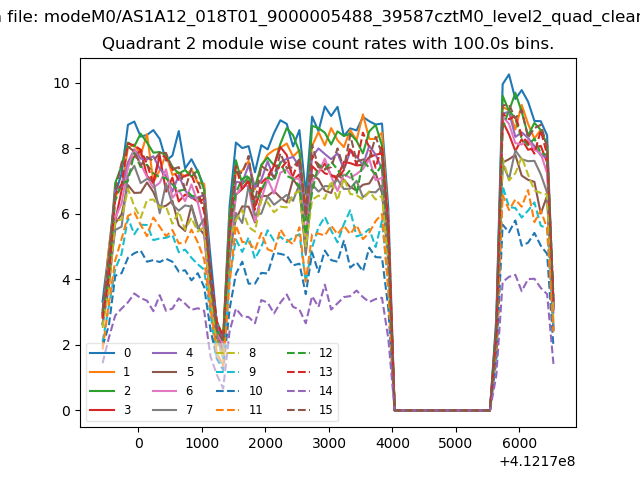
| Module-wise count rates for Quadrant B Data is divided into 100 sec bins |
 |
 |
| Module-wise count rates for Quadrant C Data is divided into 100 sec bins |
 |
 |
| Module-wise count rates for Quadrant D Data is divided into 100 sec bins |
 |
 |
| Parameter | Plot |
|---|---|
| CZT HV Monitor | 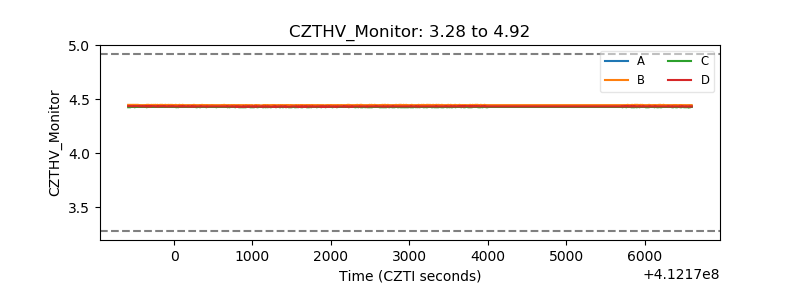 |
| D_VDD | 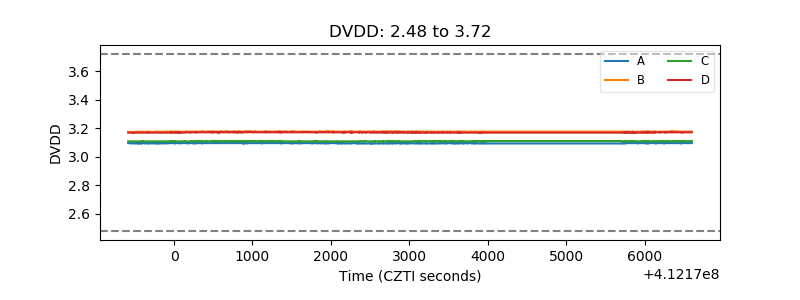 |
| Temperature 1 | 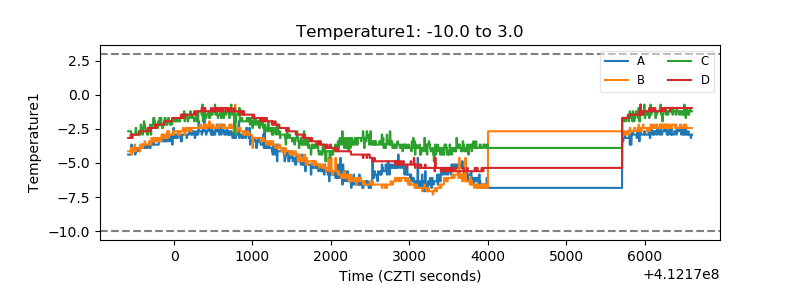 |
| Veto HV Monitor | 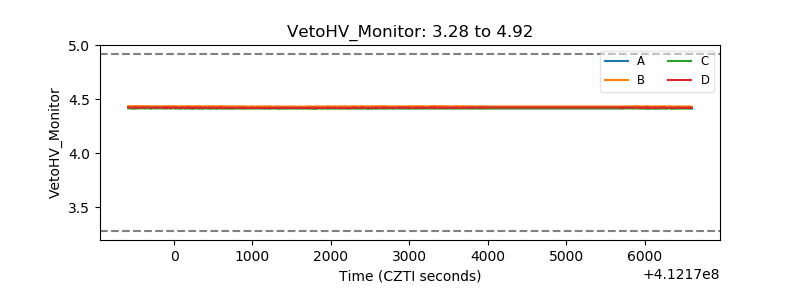 |
| Veto LLD | 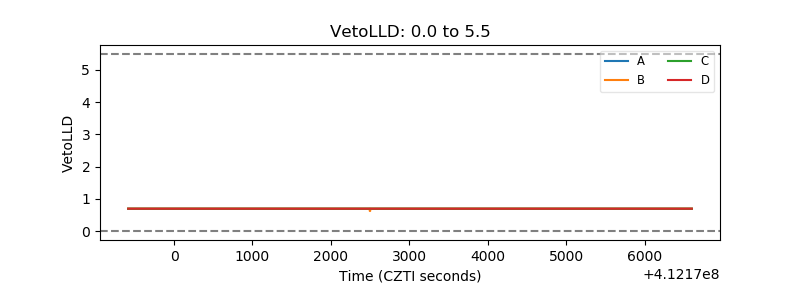 |
| Alpha Counter | 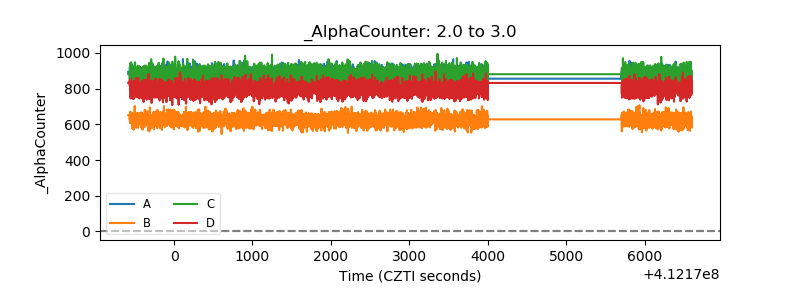 |
| _CPM_Rate | 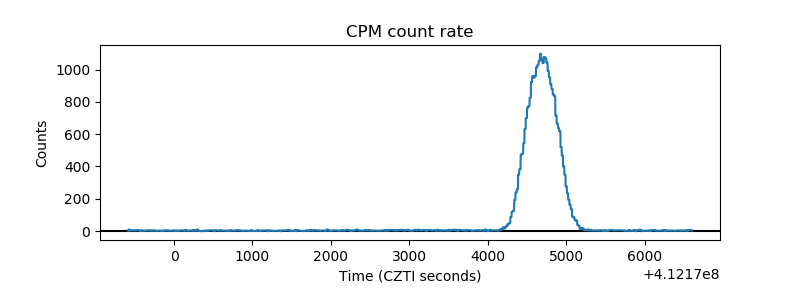 |
| CZT Counter | 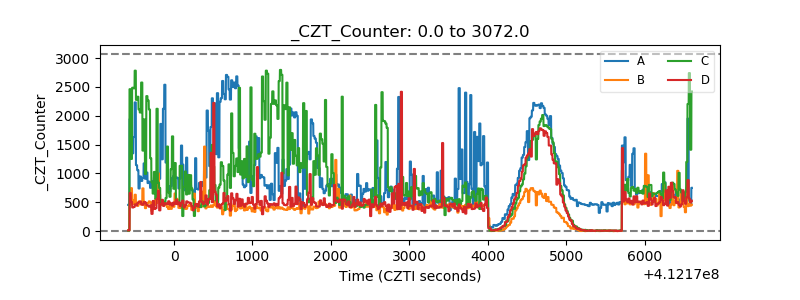 |
| +2.5 Volts monitor |  |
| +5 Volts monitor | 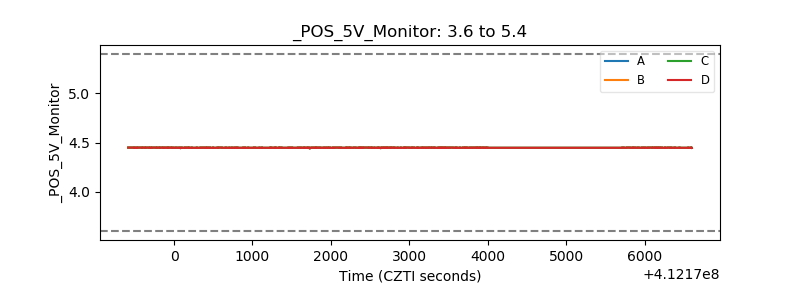 |
| _ROLL_ROT | 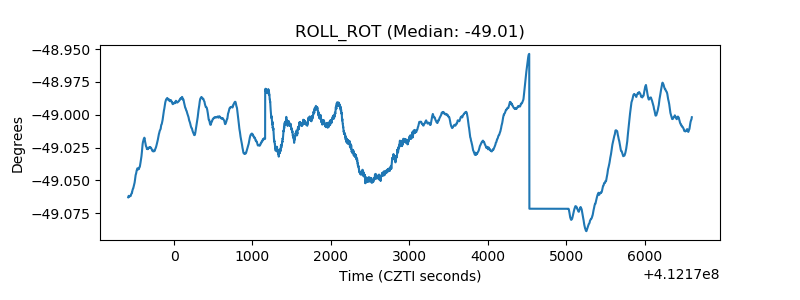 |
| _Roll_DEC | 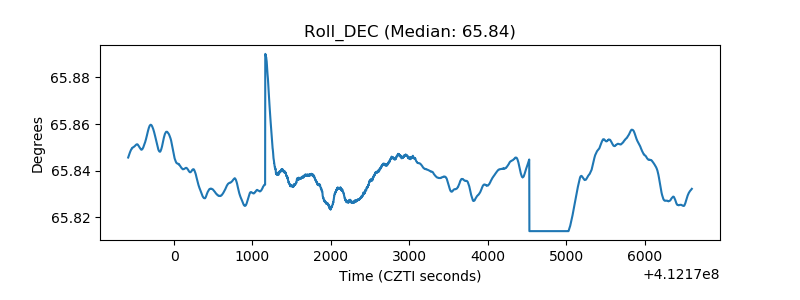 |
| _Roll_RA | 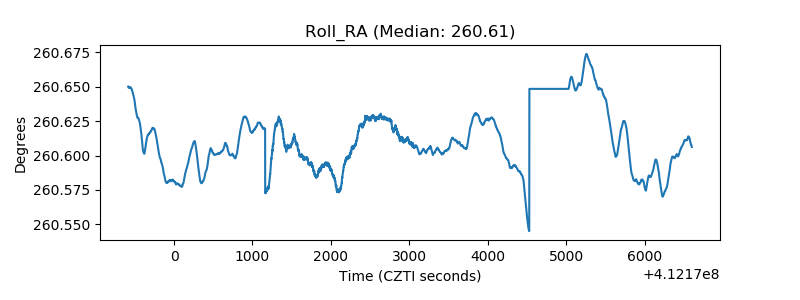 |
| Veto Counter | 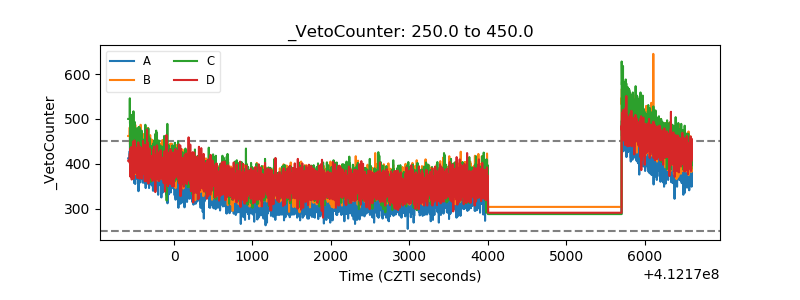 |