| Param | Original file | Final file |
|---|---|---|
| Filename | modeM0/AS1A12_018T01_9000005488_39589cztM0_level2.fits | modeM0/AS1A12_018T01_9000005488_39589cztM0_level2_quad_clean.evt |
| Size (bytes) | 408,885,120 | 96,163,200 |
| Size | 389.9 MB | 91.7 MB |
| Events in quadrant A | 3,766,271 | 649,593 |
| Events in quadrant B | 2,706,879 | 676,624 |
| Events in quadrant C | 5,417,453 | 600,457 |
| Events in quadrant D | 2,816,562 | 599,109 |
| Mode SS | |||
|---|---|---|---|
| Quadrant | BADHDUFLAG | Total packets | Discarded packets |
| A | 0 | 114 | 0 |
| B | 0 | 114 | 0 |
| C | 0 | 114 | 0 |
| D | 0 | 114 | 0 |
| Mode M0 | |||
|---|---|---|---|
| Quadrant | BADHDUFLAG | Total packets | Discarded packets |
| A | 0 | 14738 | 3 |
| B | 0 | 11808 | 2 |
| C | 0 | 19949 | 2 |
| D | 0 | 12083 | 2 |
| Mode M9 | |||
|---|---|---|---|
| Quadrant | BADHDUFLAG | Total packets | Discarded packets |
| A | 0 | 23 | 0 |
| B | 0 | 23 | 0 |
| C | 0 | 23 | 0 |
| D | 0 | 24 | 0 |
| Quadrant | Total seconds | Saturated seconds | Saturation percentage |
|---|---|---|---|
| A | 5511 | 189 | 3.429505% |
| B | 5511 | 36 | 0.653239% |
| C | 5511 | 521 | 9.453820% |
| D | 5511 | 26 | 0.471784% |
Noise dominated data is calculated using 1-second bins in cleaned event files. If a bin has >2000 counts, and if more than 50% of those come from <1% of pixels, then it is considered to be noise-dominated and hence unusable.
| Quadrant | # 1 sec bins | Bins with >0 counts | Bins with >2000 counts | High rate bins dominated by noise | Noise dominated (total time) | Noise dominated (detector-on time) | Marked lightcurve |
|---|---|---|---|---|---|---|---|
| A | 7364 | 5512 | 143 | 143 | 1.94% | 2.59% | 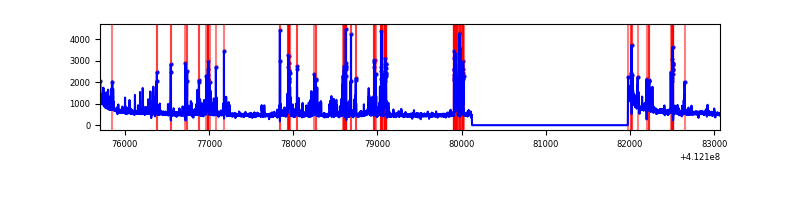 |
| B | 7364 | 5512 | 19 | 19 | 0.26% | 0.34% | 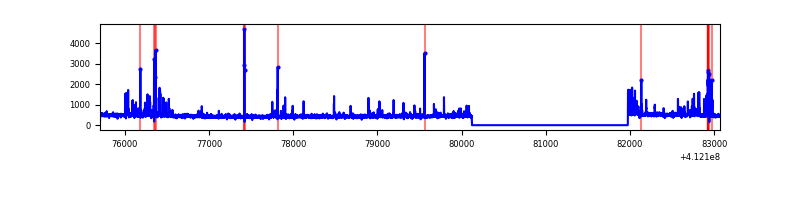 |
| C | 7364 | 5512 | 506 | 506 | 6.87% | 9.18% | 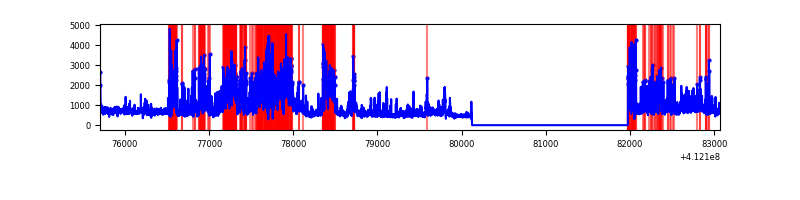 |
| D | 7364 | 5512 | 15 | 15 | 0.20% | 0.27% | 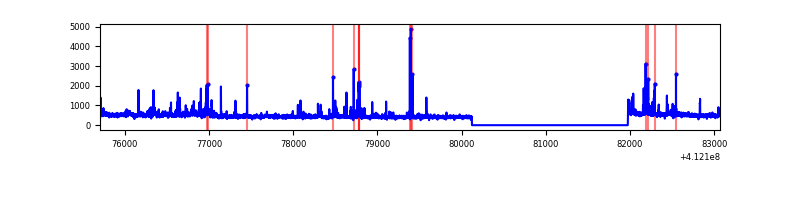 |
Top three noisy pixels from each quadrant. If the there are fewer than three noisy pixels in the level2.evt file, extra rows are filled as -1
| Pixel properties | Quadrant properties | ||||||
|---|---|---|---|---|---|---|---|
| Quadrant | DetID | PixID | Counts | Sigma | Mean | Median | Sigma |
| A | 9 | 143 | 676196 | 5307.77 | 618 | 604 | 127.3 |
| A | 10 | 83 | 461039 | 3617.39 | 618 | 604 | 127.3 |
| A | 15 | 222 | 140099 | 1095.94 | 618 | 604 | 127.3 |
| B | 5 | 172 | 197303 | 1664.19 | 619 | 602 | 118.2 |
| B | 5 | 255 | 73269 | 614.8 | 619 | 602 | 118.2 |
| B | 12 | 111 | 14313 | 116.0 | 619 | 602 | 118.2 |
| C | 9 | 187 | 1611510 | 11735.99 | 598 | 605 | 137.3 |
| C | 15 | 208 | 1207404 | 8791.94 | 598 | 605 | 137.3 |
| C | 15 | 214 | 240767 | 1749.66 | 598 | 605 | 137.3 |
| D | 1 | 52 | 110169 | 726.4 | 617 | 600 | 150.8 |
| D | 13 | 171 | 73283 | 481.86 | 617 | 600 | 150.8 |
| D | 2 | 249 | 59753 | 392.16 | 617 | 600 | 150.8 |
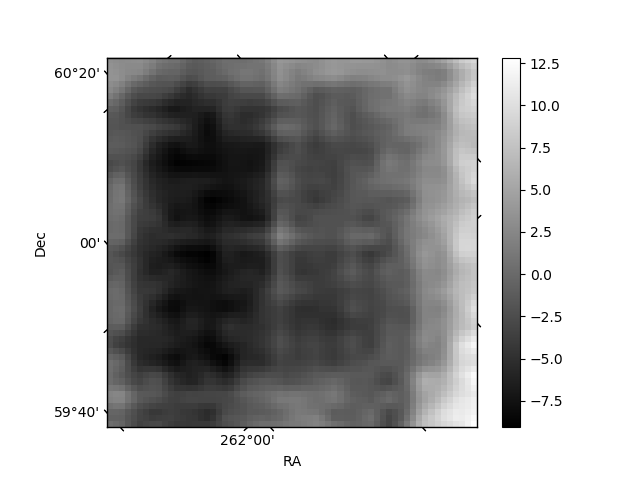
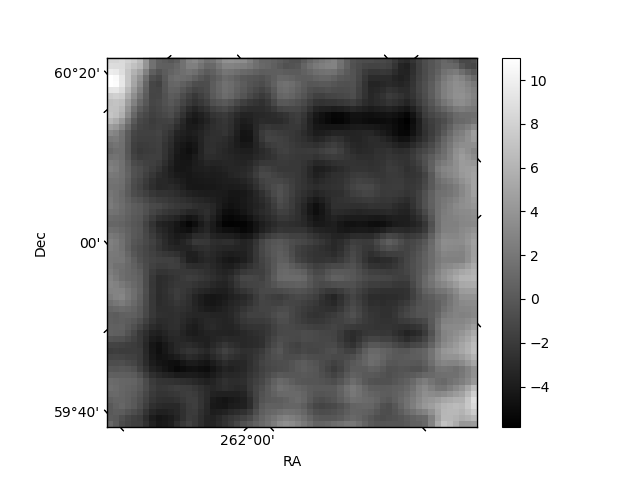
Histogram calculated using DETX and DETY for each event in the final _common_clean file
| Quadrant A | 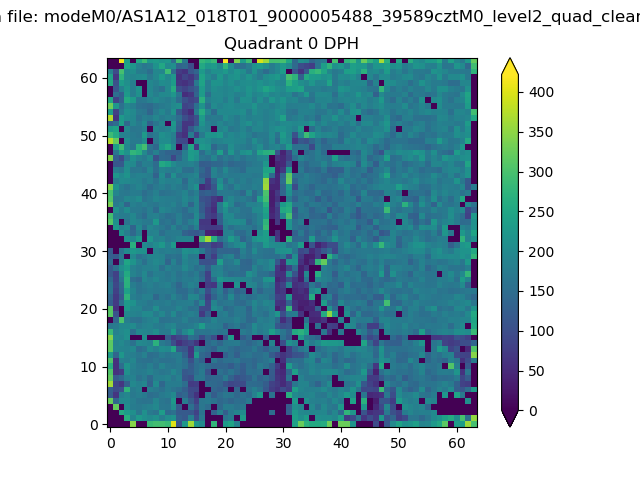 |
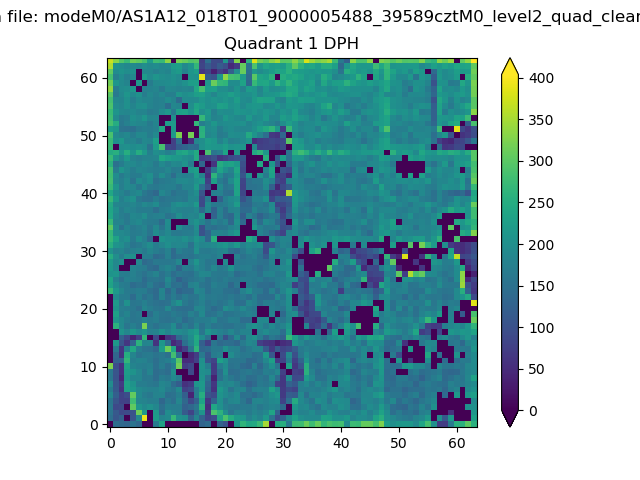 |
Quadrant B |
|---|---|---|---|
| Quadrant D | 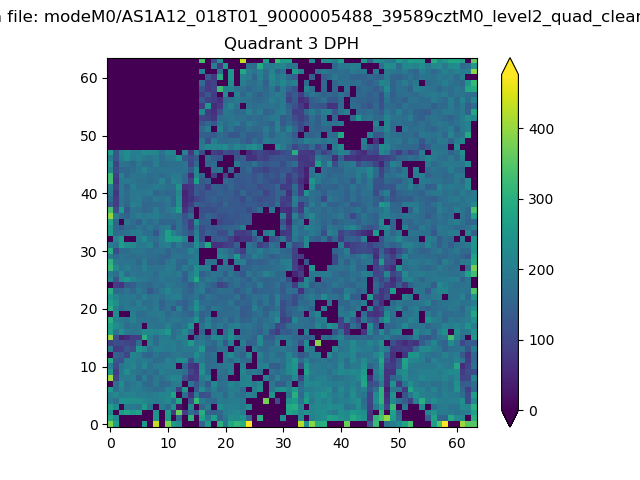 |
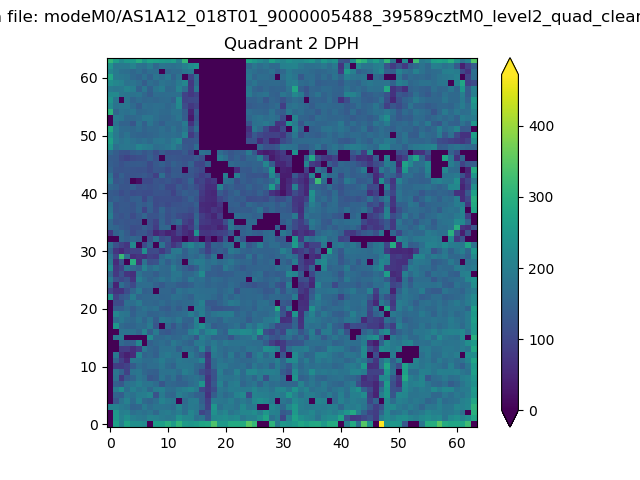 |
Quadrant C |
| Plot type | Count rate plots | Images |
|---|---|---|
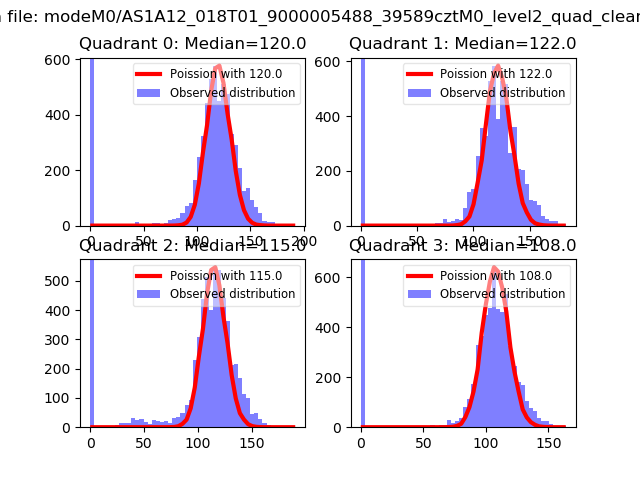
| Comparison with Poisson distribution Blue bars denote a histogram of data divided into 1 sec bins. Red curve is a Poisson curve with rate = median count rate of data. |
 |
 |
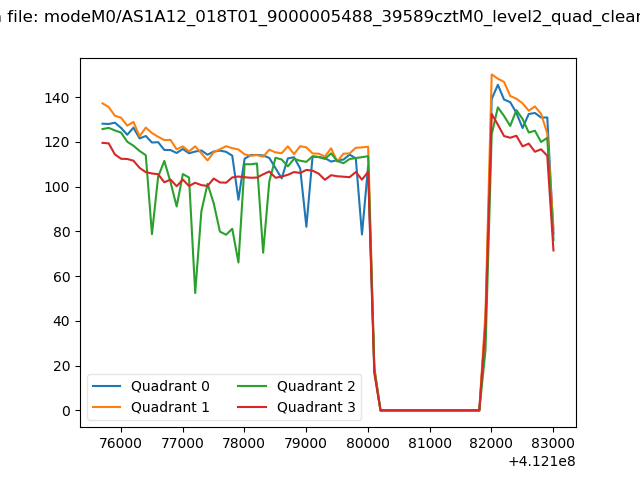
| Quadrant-wise count rates Data is divided into 100 sec bins |
 |
|
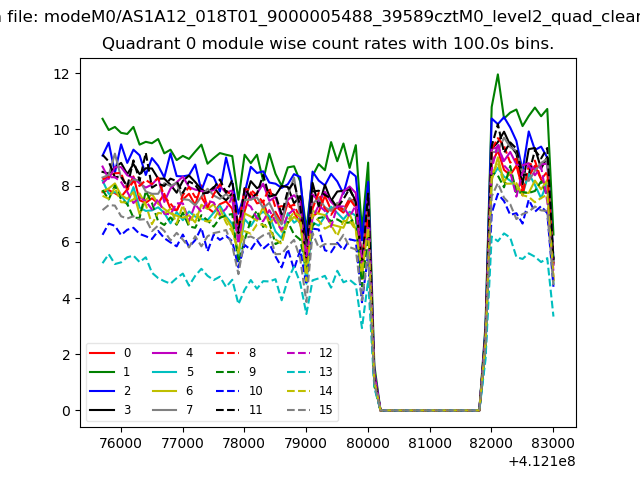
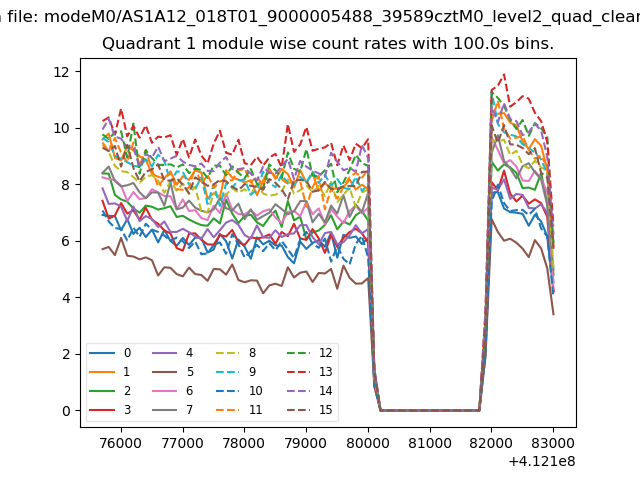
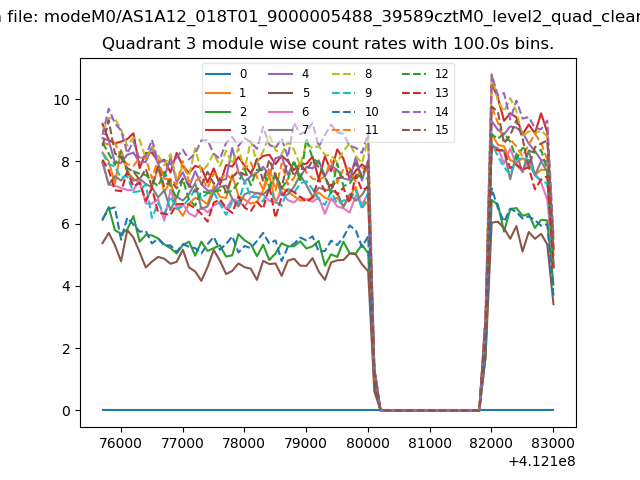
| Module-wise count rates for Quadrant A Data is divided into 100 sec bins |
 |
 |
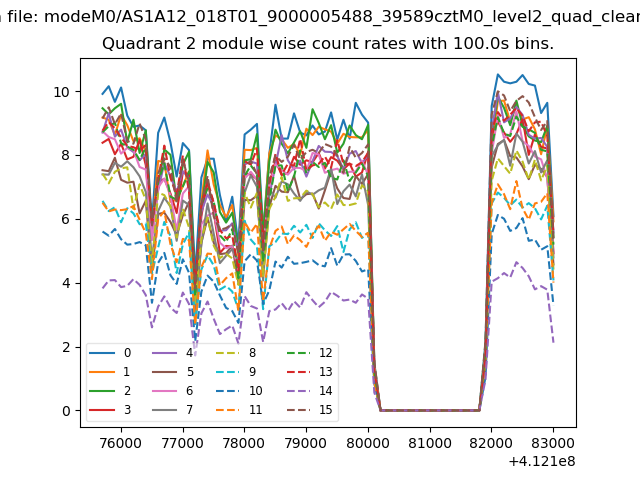
| Module-wise count rates for Quadrant B Data is divided into 100 sec bins |
 |
 |
| Module-wise count rates for Quadrant C Data is divided into 100 sec bins |
 |
 |
| Module-wise count rates for Quadrant D Data is divided into 100 sec bins |
 |
 |
| Parameter | Plot |
|---|---|
| CZT HV Monitor | 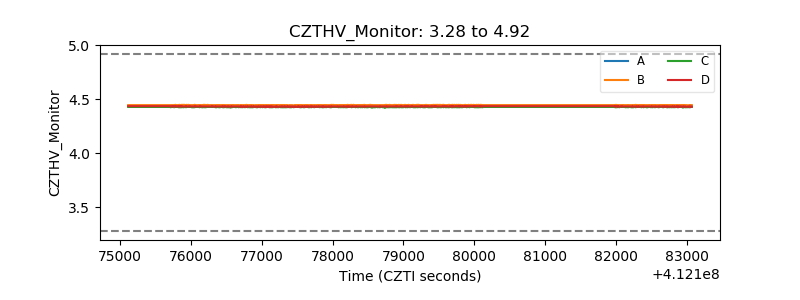 |
| D_VDD | 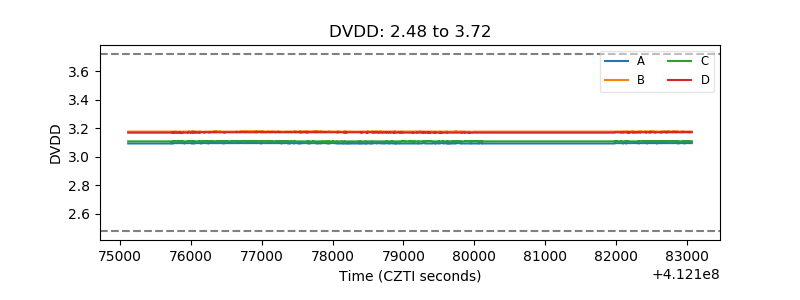 |
| Temperature 1 | 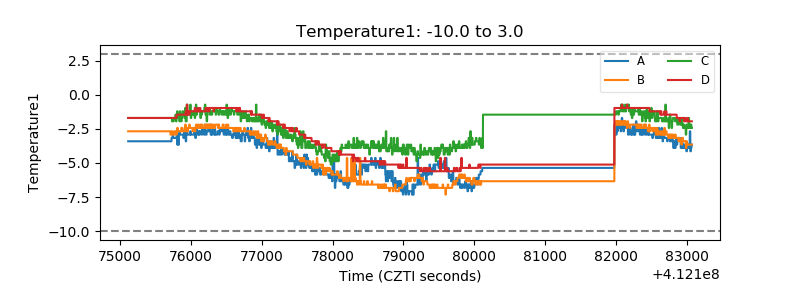 |
| Veto HV Monitor | 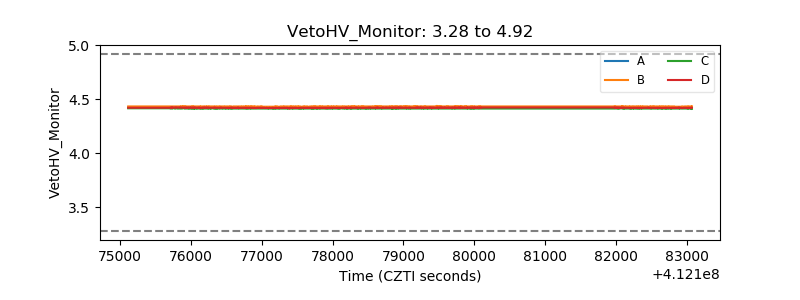 |
| Veto LLD | 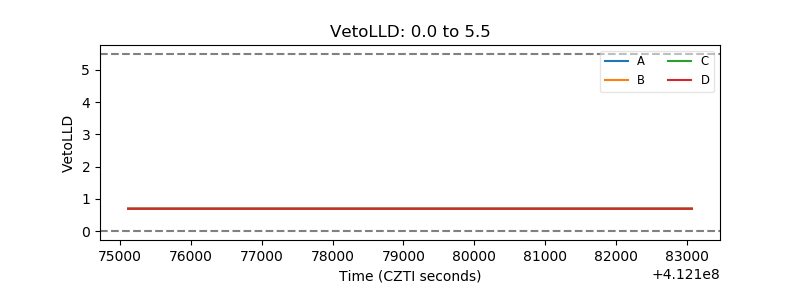 |
| Alpha Counter | 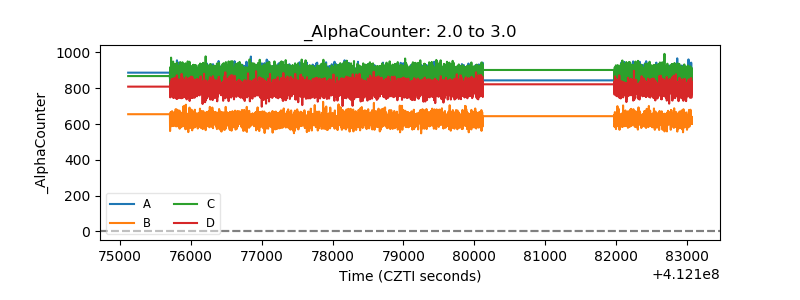 |
| _CPM_Rate | 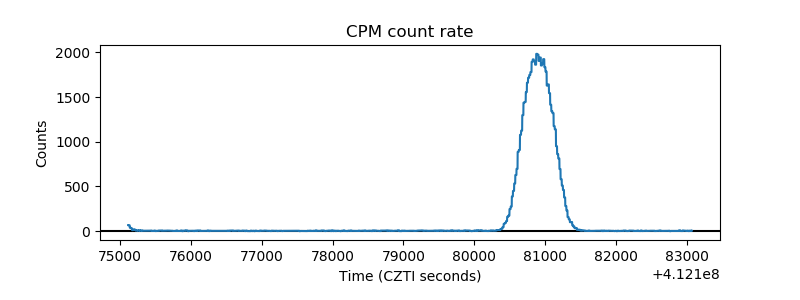 |
| CZT Counter | 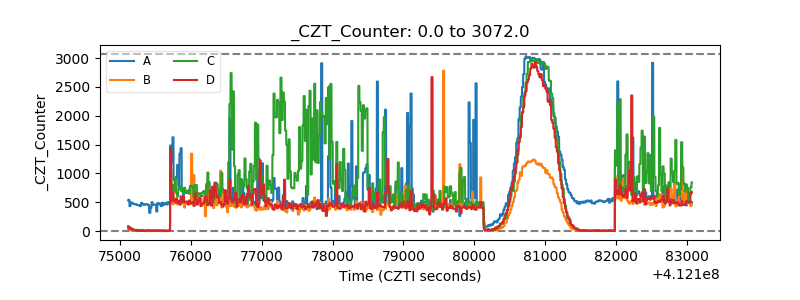 |
| +2.5 Volts monitor |  |
| +5 Volts monitor | 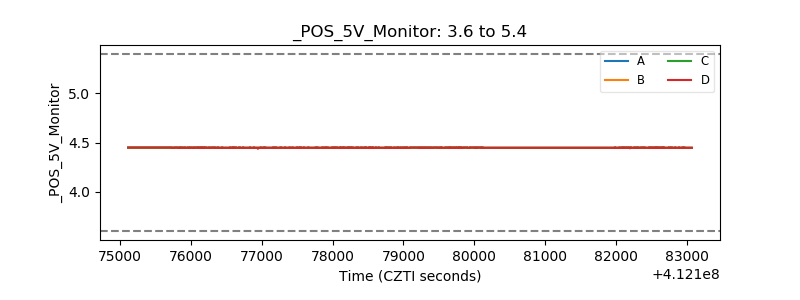 |
| _ROLL_ROT | 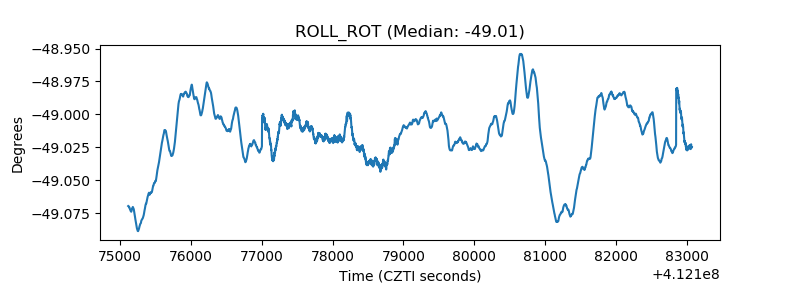 |
| _Roll_DEC | 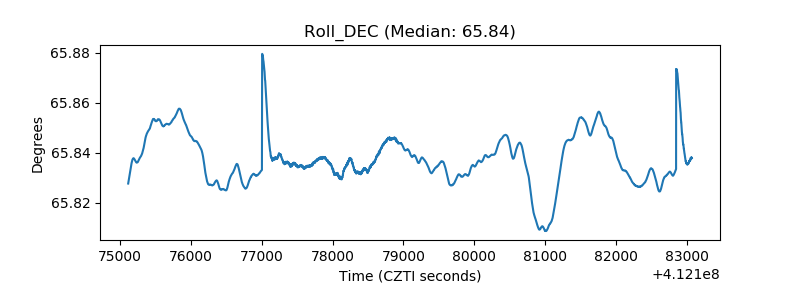 |
| _Roll_RA | 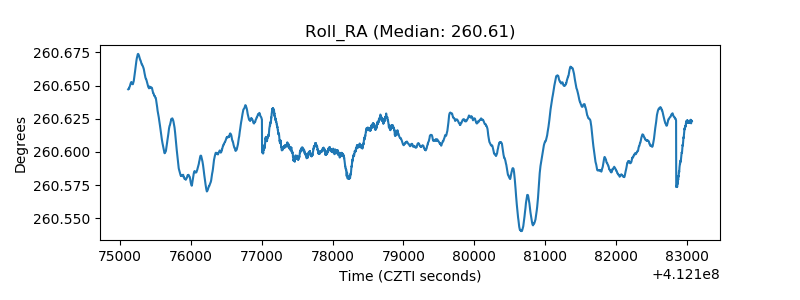 |
| Veto Counter | 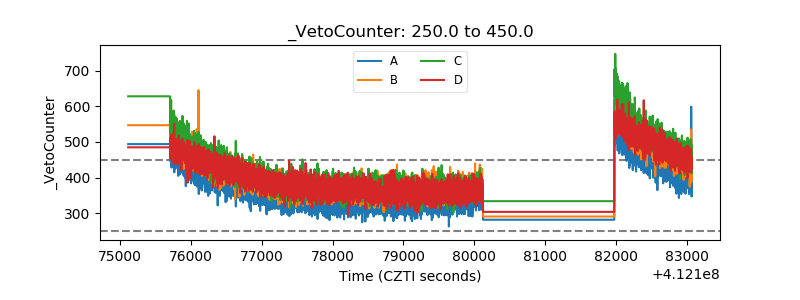 |