| Param | Original file | Final file |
|---|---|---|
| Filename | modeM0/AS1A12_018T01_9000005488_39590cztM0_level2.fits | modeM0/AS1A12_018T01_9000005488_39590cztM0_level2_quad_clean.evt |
| Size (bytes) | 417,369,600 | 94,063,680 |
| Size | 398.0 MB | 89.7 MB |
| Events in quadrant A | 3,118,757 | 660,423 |
| Events in quadrant B | 2,588,881 | 679,232 |
| Events in quadrant C | 5,652,744 | 571,943 |
| Events in quadrant D | 3,682,750 | 570,706 |
| Mode SS | |||
|---|---|---|---|
| Quadrant | BADHDUFLAG | Total packets | Discarded packets |
| A | 0 | 106 | 0 |
| B | 0 | 106 | 0 |
| C | 0 | 106 | 0 |
| D | 0 | 106 | 0 |
| Mode M0 | |||
|---|---|---|---|
| Quadrant | BADHDUFLAG | Total packets | Discarded packets |
| A | 0 | 12628 | 3 |
| B | 0 | 11177 | 2 |
| C | 0 | 20375 | 2 |
| D | 0 | 14559 | 2 |
| Mode M9 | |||
|---|---|---|---|
| Quadrant | BADHDUFLAG | Total packets | Discarded packets |
| A | 0 | 20 | 0 |
| B | 0 | 20 | 0 |
| C | 0 | 20 | 0 |
| D | 0 | 20 | 0 |
| Quadrant | Total seconds | Saturated seconds | Saturation percentage |
|---|---|---|---|
| A | 5228 | 67 | 1.281561% |
| B | 5228 | 22 | 0.420811% |
| C | 5228 | 749 | 14.326702% |
| D | 5228 | 324 | 6.197399% |
Noise dominated data is calculated using 1-second bins in cleaned event files. If a bin has >2000 counts, and if more than 50% of those come from <1% of pixels, then it is considered to be noise-dominated and hence unusable.
| Quadrant | # 1 sec bins | Bins with >0 counts | Bins with >2000 counts | High rate bins dominated by noise | Noise dominated (total time) | Noise dominated (detector-on time) | Marked lightcurve |
|---|---|---|---|---|---|---|---|
| A | 7201 | 5229 | 47 | 47 | 0.65% | 0.90% | 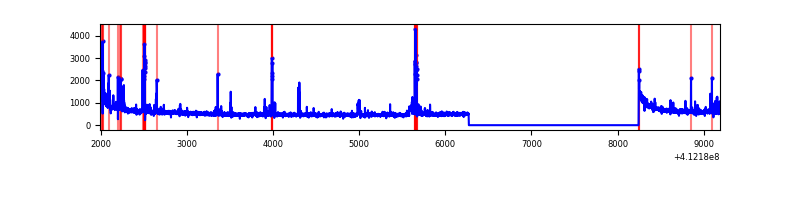 |
| B | 7201 | 5229 | 14 | 14 | 0.19% | 0.27% | 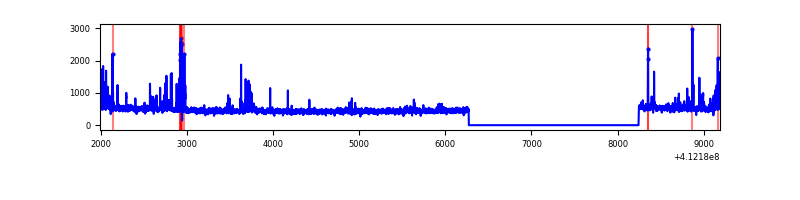 |
| C | 7201 | 5229 | 631 | 631 | 8.76% | 12.07% | 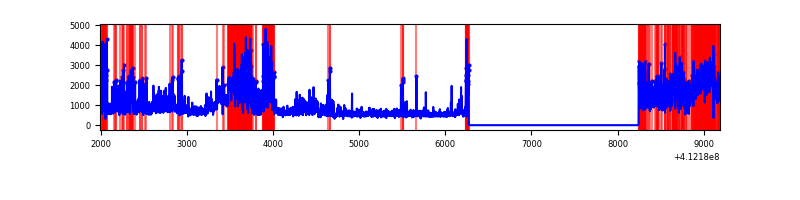 |
| D | 7201 | 5229 | 260 | 260 | 3.61% | 4.97% | 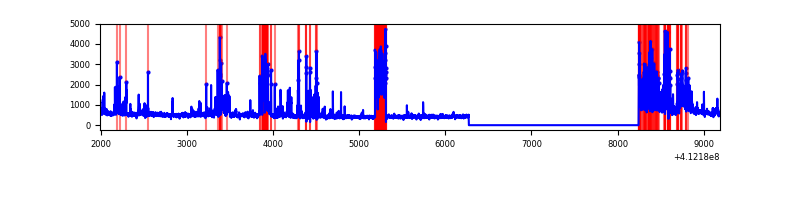 |
Top three noisy pixels from each quadrant. If the there are fewer than three noisy pixels in the level2.evt file, extra rows are filled as -1
| Pixel properties | Quadrant properties | ||||||
|---|---|---|---|---|---|---|---|
| Quadrant | DetID | PixID | Counts | Sigma | Mean | Median | Sigma |
| A | 10 | 83 | 439220 | 3573.96 | 607 | 596 | 122.7 |
| A | 9 | 143 | 231955 | 1885.14 | 607 | 596 | 122.7 |
| A | 13 | 248 | 86510 | 700.04 | 607 | 596 | 122.7 |
| B | 5 | 172 | 127186 | 1112.03 | 607 | 591 | 113.8 |
| B | 5 | 255 | 74795 | 651.82 | 607 | 591 | 113.8 |
| B | 12 | 111 | 13553 | 113.86 | 607 | 591 | 113.8 |
| C | 9 | 187 | 1697485 | 12844.9 | 574 | 579 | 132.1 |
| C | 15 | 208 | 1460418 | 11050.4 | 574 | 579 | 132.1 |
| C | 15 | 214 | 225910 | 1705.67 | 574 | 579 | 132.1 |
| D | 13 | 174 | 557278 | 3882.35 | 588 | 572 | 143.4 |
| D | 13 | 249 | 259939 | 1808.77 | 588 | 572 | 143.4 |
| D | 13 | 171 | 178011 | 1237.42 | 588 | 572 | 143.4 |
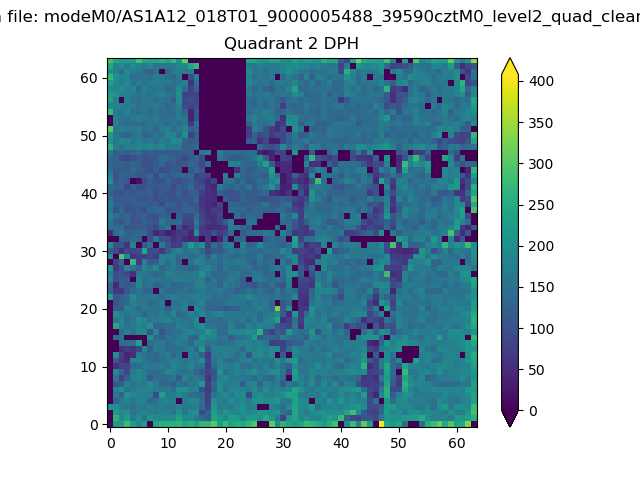
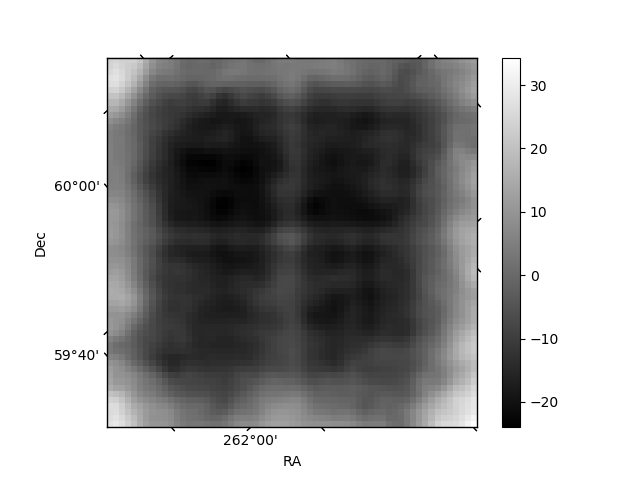
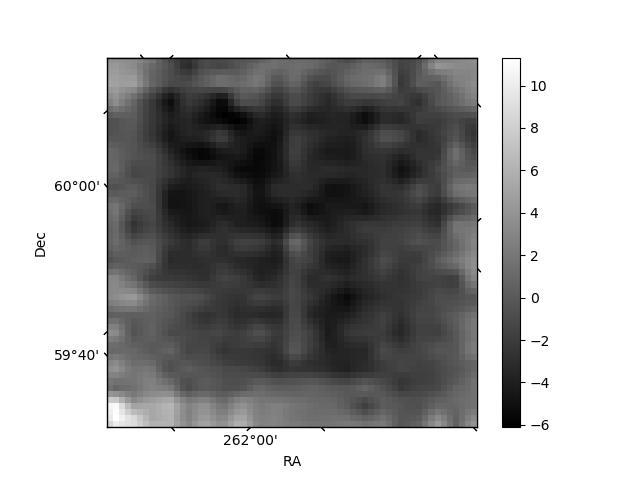
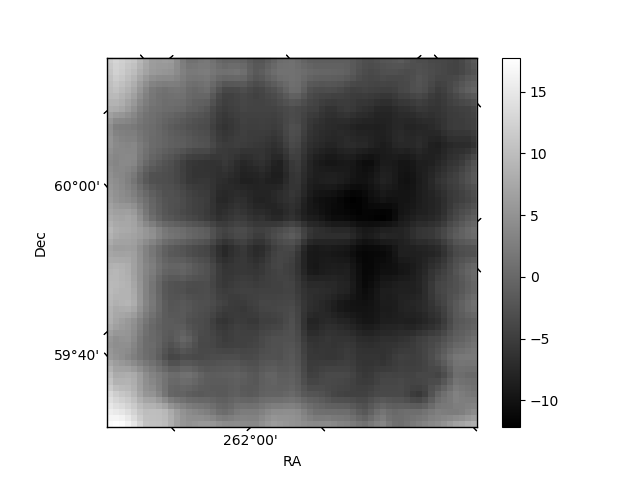
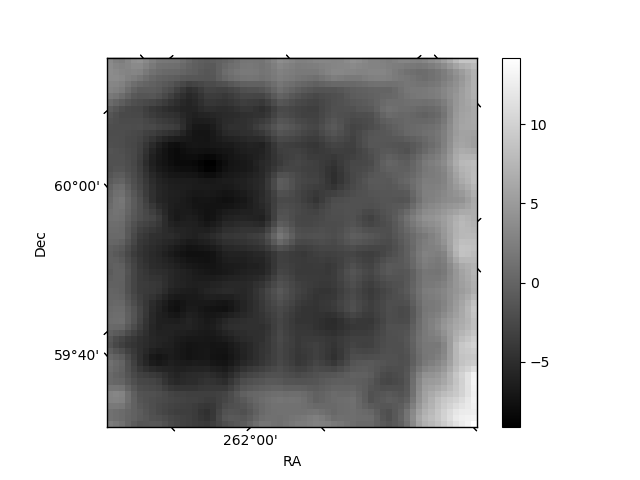
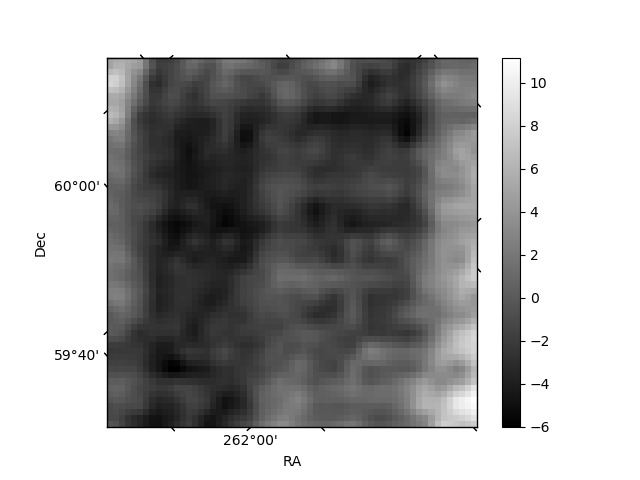
Histogram calculated using DETX and DETY for each event in the final _common_clean file
| Quadrant A | 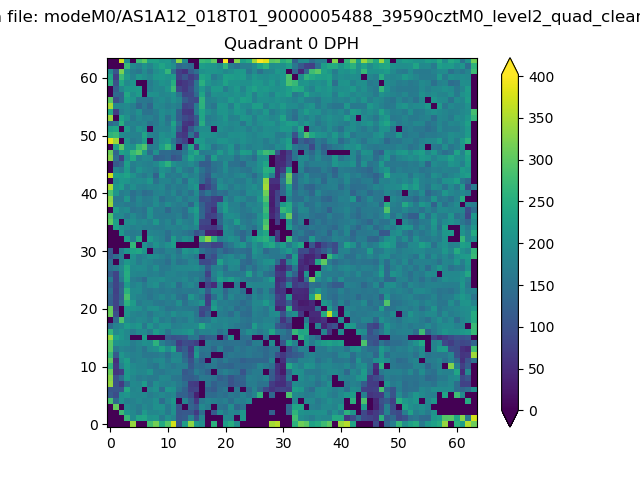 |
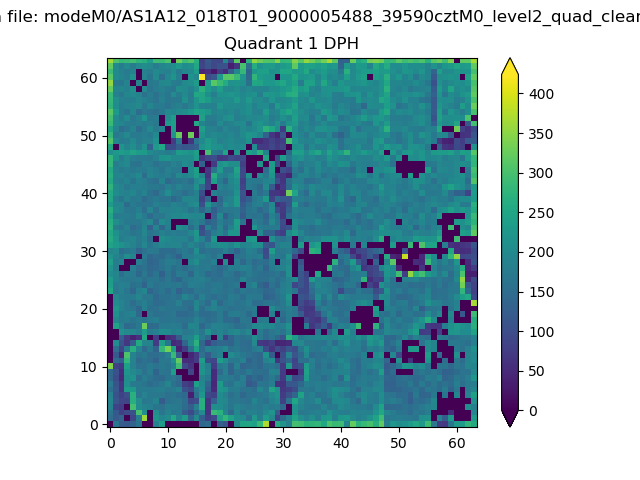 |
Quadrant B |
|---|---|---|---|
| Quadrant D | 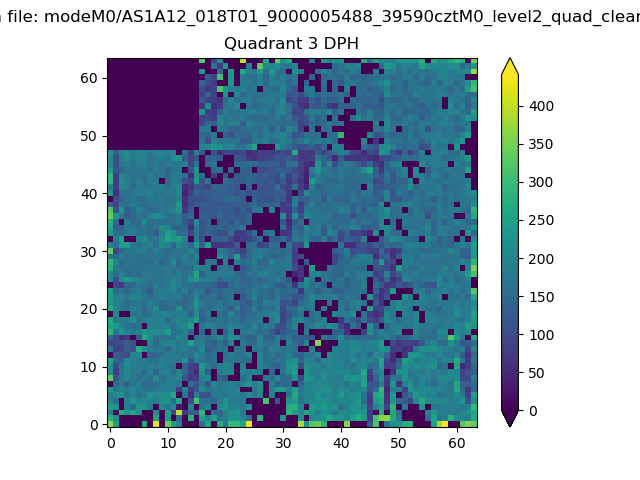 |
 |
Quadrant C |
| Plot type | Count rate plots | Images |
|---|---|---|
| Comparison with Poisson distribution Blue bars denote a histogram of data divided into 1 sec bins. Red curve is a Poisson curve with rate = median count rate of data. |
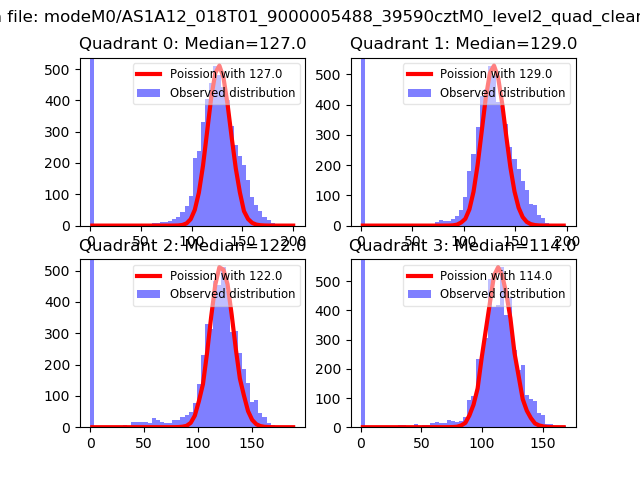 |
 |
| Quadrant-wise count rates Data is divided into 100 sec bins |
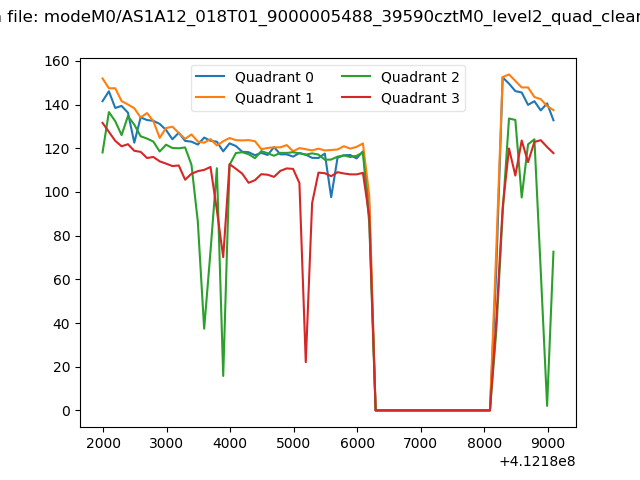 |
|
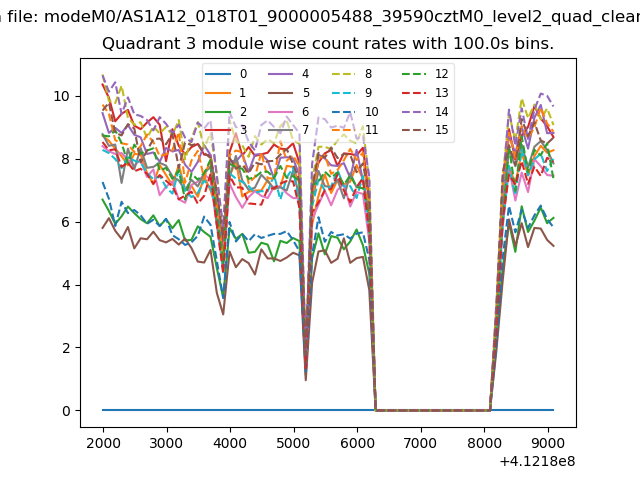
| Module-wise count rates for Quadrant A Data is divided into 100 sec bins |
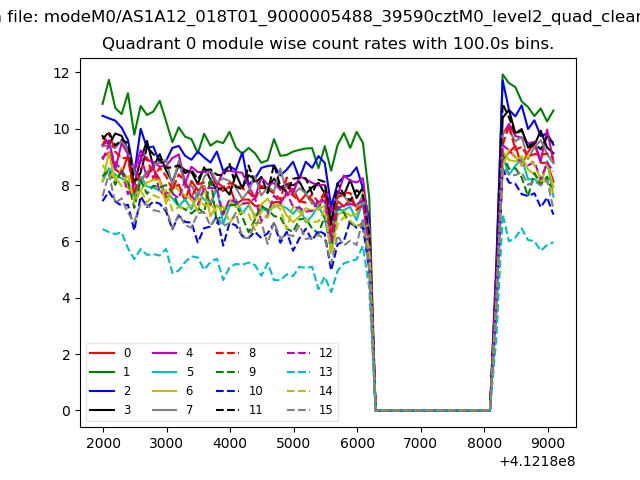 |
 |
| Module-wise count rates for Quadrant B Data is divided into 100 sec bins |
 |
 |
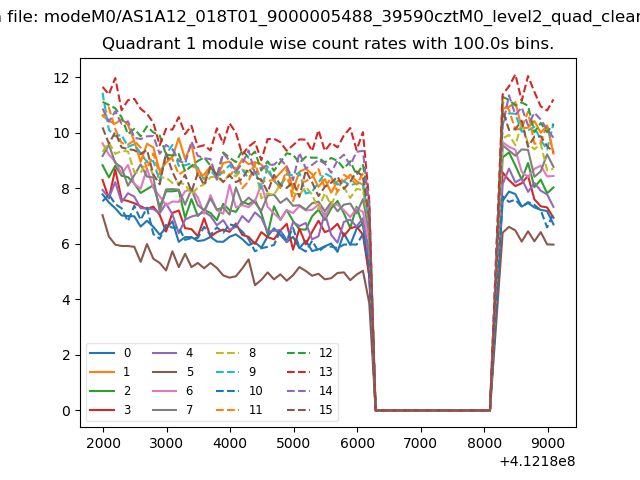
| Module-wise count rates for Quadrant C Data is divided into 100 sec bins |
 |
 |
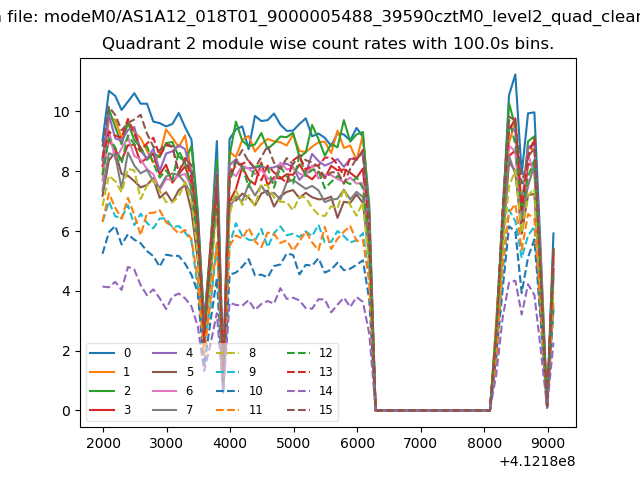
| Module-wise count rates for Quadrant D Data is divided into 100 sec bins |
 |
 |
| Parameter | Plot |
|---|---|
| CZT HV Monitor | 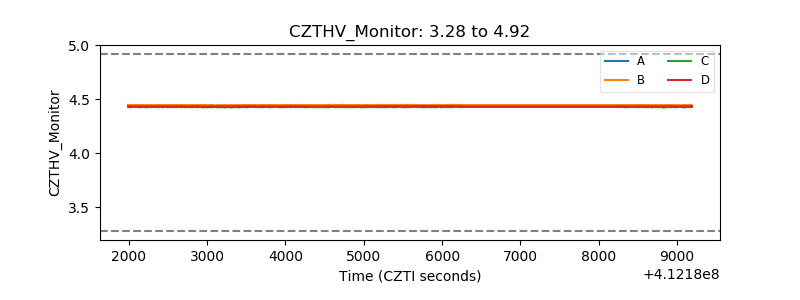 |
| D_VDD | 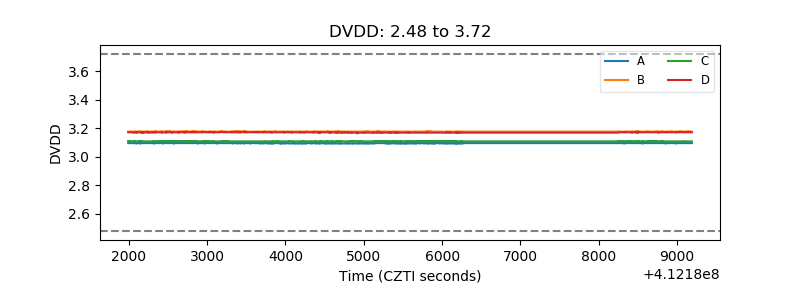 |
| Temperature 1 | 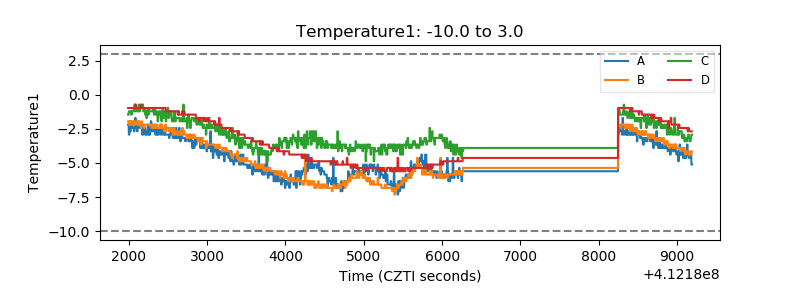 |
| Veto HV Monitor | 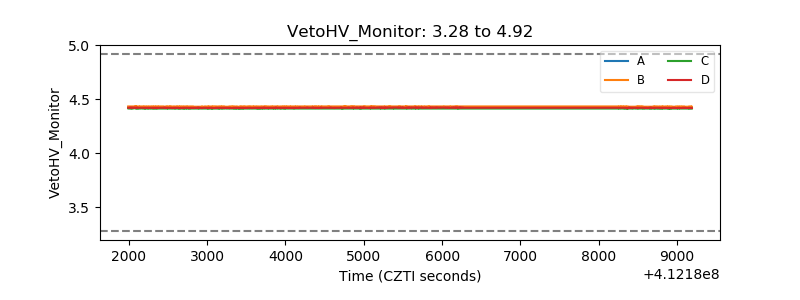 |
| Veto LLD | 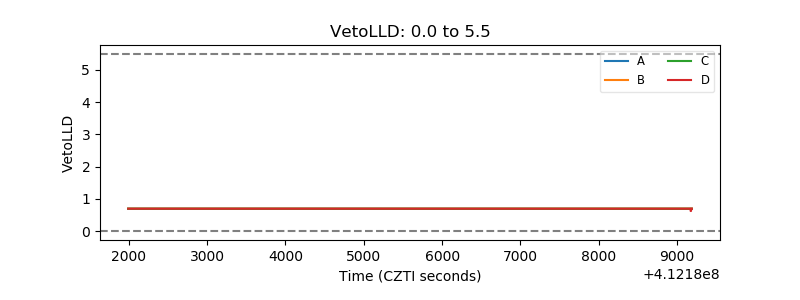 |
| Alpha Counter | 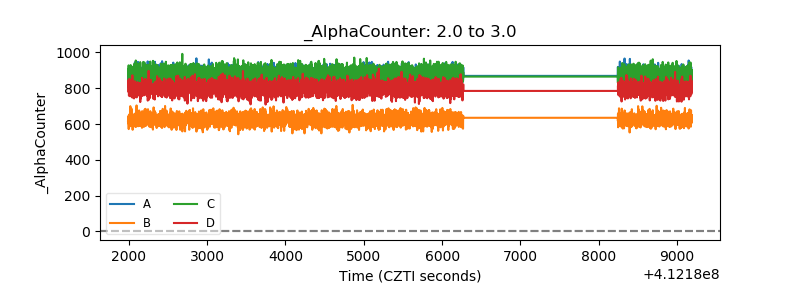 |
| _CPM_Rate | 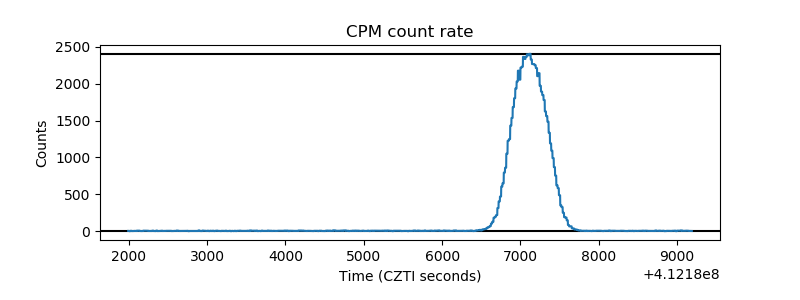 |
| CZT Counter | 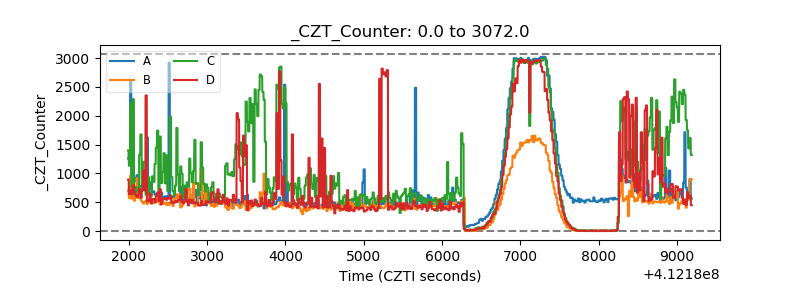 |
| +2.5 Volts monitor | 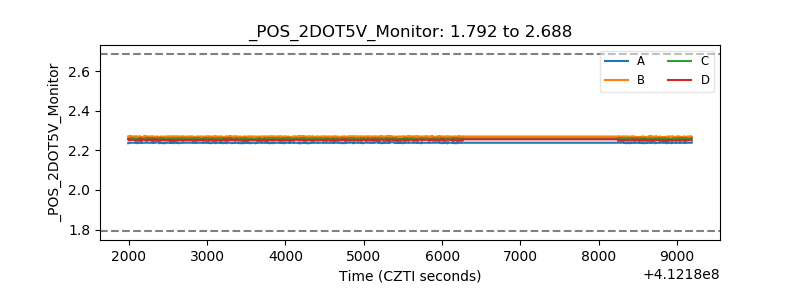 |
| +5 Volts monitor |  |
| _ROLL_ROT | 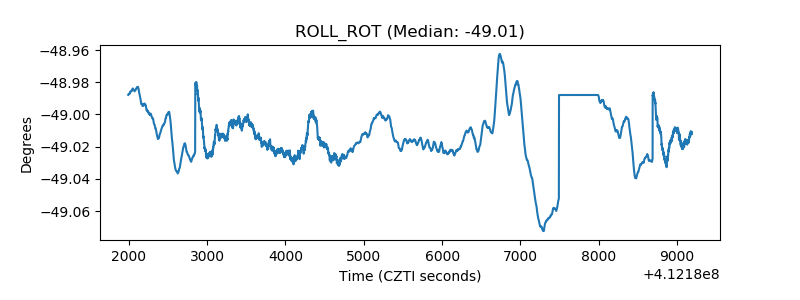 |
| _Roll_DEC | 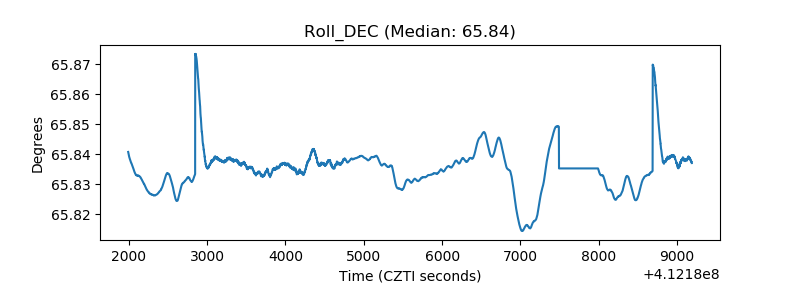 |
| _Roll_RA | 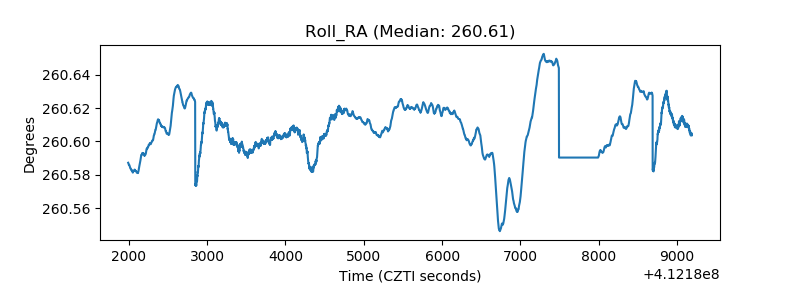 |
| Veto Counter | 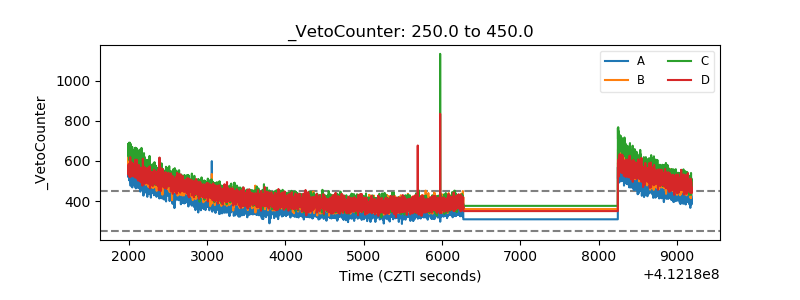 |