| Param | Original file | Final file |
|---|---|---|
| Filename | modeM0/AS1A12_018T01_9000005488_39591cztM0_level2.fits | modeM0/AS1A12_018T01_9000005488_39591cztM0_level2_quad_clean.evt |
| Size (bytes) | 491,693,760 | 86,126,400 |
| Size | 468.9 MB | 82.1 MB |
| Events in quadrant A | 3,011,996 | 629,313 |
| Events in quadrant B | 2,629,321 | 645,657 |
| Events in quadrant C | 6,980,923 | 482,415 |
| Events in quadrant D | 5,198,440 | 507,489 |
| Mode SS | |||
|---|---|---|---|
| Quadrant | BADHDUFLAG | Total packets | Discarded packets |
| A | 0 | 98 | 0 |
| B | 0 | 98 | 0 |
| C | 0 | 98 | 0 |
| D | 0 | 98 | 0 |
| Mode M0 | |||
|---|---|---|---|
| Quadrant | BADHDUFLAG | Total packets | Discarded packets |
| A | 0 | 12155 | 2 |
| B | 0 | 11022 | 1 |
| C | 0 | 24133 | 1 |
| D | 0 | 18791 | 1 |
| Mode M9 | |||
|---|---|---|---|
| Quadrant | BADHDUFLAG | Total packets | Discarded packets |
| A | 0 | 23 | 0 |
| B | 0 | 23 | 0 |
| C | 0 | 23 | 0 |
| D | 0 | 24 | 0 |
| Quadrant | Total seconds | Saturated seconds | Saturation percentage |
|---|---|---|---|
| A | 4898 | 66 | 1.347489% |
| B | 4898 | 64 | 1.306656% |
| C | 4898 | 1362 | 27.807268% |
| D | 4898 | 724 | 14.781543% |
Noise dominated data is calculated using 1-second bins in cleaned event files. If a bin has >2000 counts, and if more than 50% of those come from <1% of pixels, then it is considered to be noise-dominated and hence unusable.
| Quadrant | # 1 sec bins | Bins with >0 counts | Bins with >2000 counts | High rate bins dominated by noise | Noise dominated (total time) | Noise dominated (detector-on time) | Marked lightcurve |
|---|---|---|---|---|---|---|---|
| A | 6961 | 4899 | 48 | 48 | 0.69% | 0.98% | 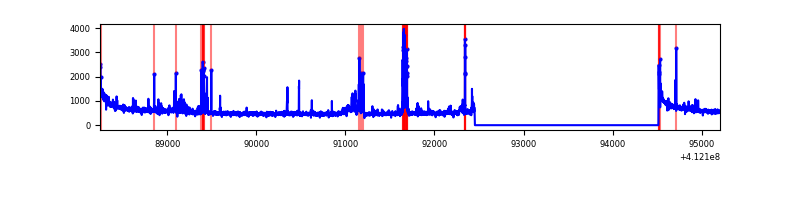 |
| B | 6961 | 4899 | 41 | 41 | 0.59% | 0.84% | 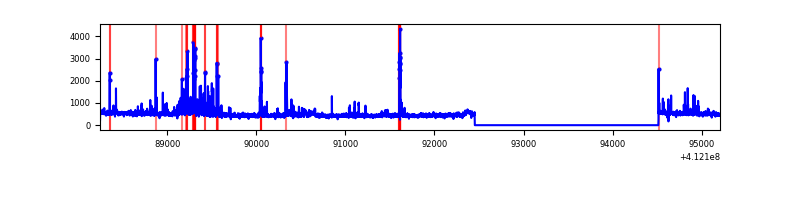 |
| C | 6961 | 4899 | 1165 | 1165 | 16.74% | 23.78% | 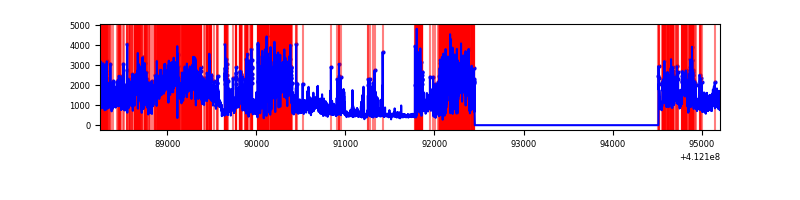 |
| D | 6961 | 4899 | 622 | 622 | 8.94% | 12.70% | 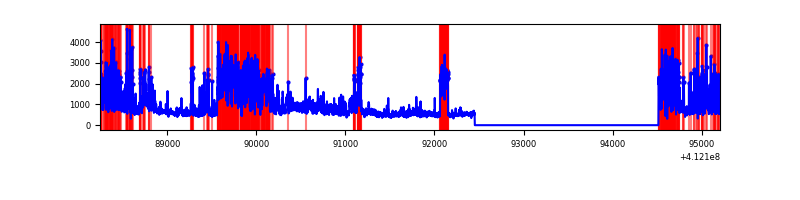 |
Top three noisy pixels from each quadrant. If the there are fewer than three noisy pixels in the level2.evt file, extra rows are filled as -1
| Pixel properties | Quadrant properties | ||||||
|---|---|---|---|---|---|---|---|
| Quadrant | DetID | PixID | Counts | Sigma | Mean | Median | Sigma |
| A | 10 | 83 | 429800 | 3714.21 | 569 | 558 | 115.6 |
| A | 9 | 143 | 276974 | 2391.81 | 569 | 558 | 115.6 |
| A | 13 | 248 | 86043 | 739.7 | 569 | 558 | 115.6 |
| B | 5 | 255 | 258902 | 2432.71 | 570 | 556 | 106.2 |
| B | 5 | 172 | 129024 | 1209.72 | 570 | 556 | 106.2 |
| B | 12 | 111 | 12714 | 114.49 | 570 | 556 | 106.2 |
| C | 9 | 187 | 2796276 | 23451.98 | 519 | 525 | 119.2 |
| C | 15 | 208 | 1911494 | 16030.05 | 519 | 525 | 119.2 |
| C | 15 | 214 | 202736 | 1696.23 | 519 | 525 | 119.2 |
| D | 13 | 174 | 1970535 | 14983.94 | 539 | 524 | 131.5 |
| D | 13 | 249 | 508856 | 3866.38 | 539 | 524 | 131.5 |
| D | 5 | 32 | 365500 | 2776.01 | 539 | 524 | 131.5 |
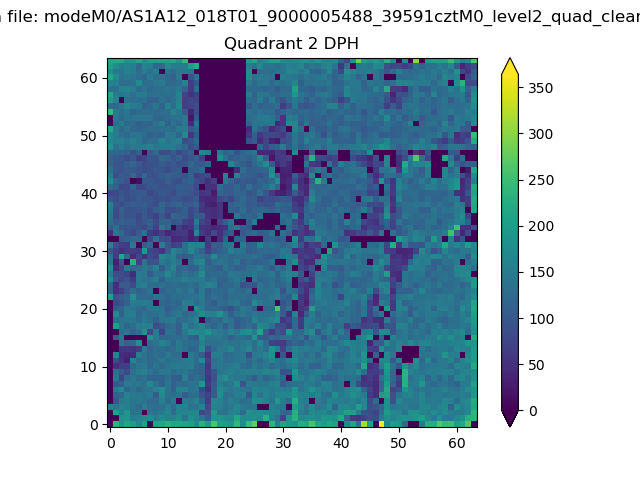
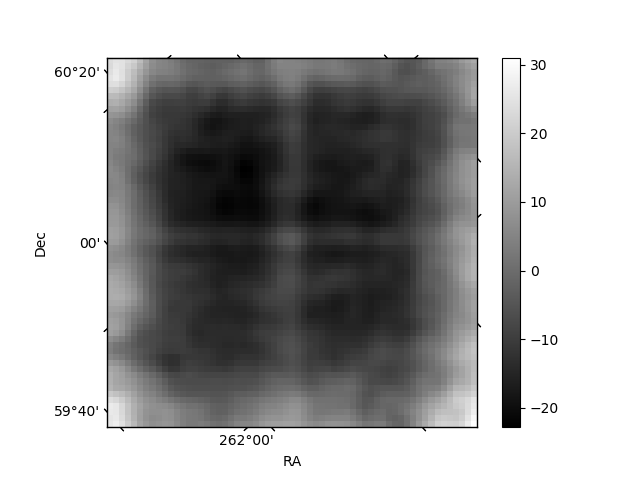
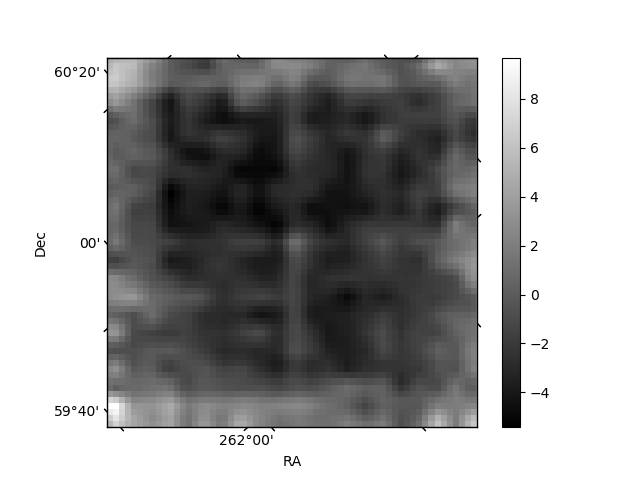
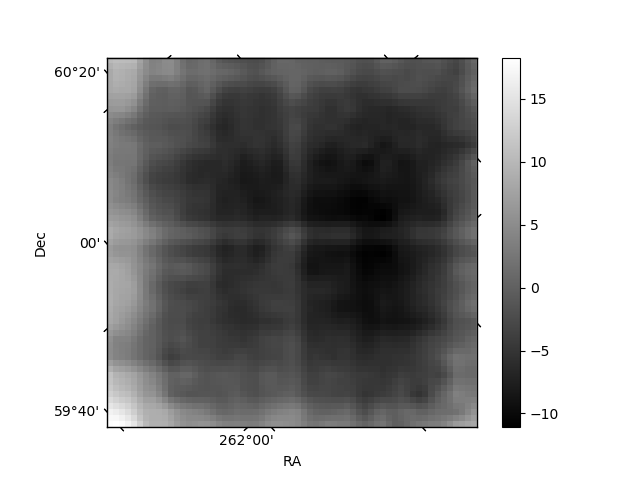
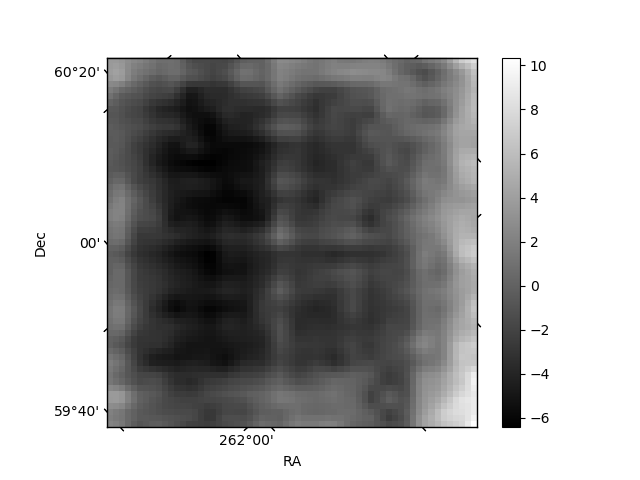
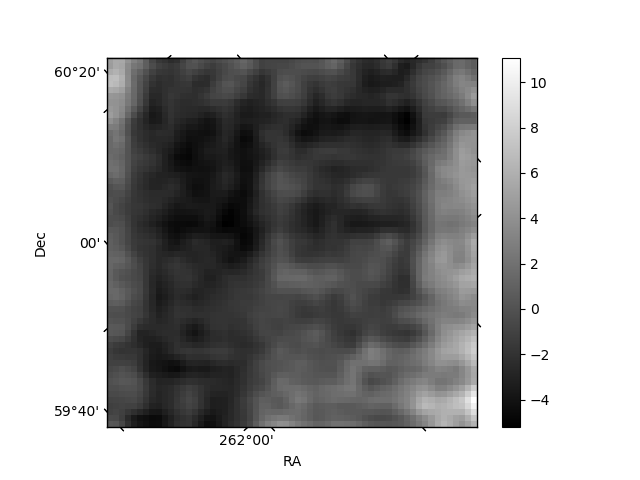
Histogram calculated using DETX and DETY for each event in the final _common_clean file
| Quadrant A | 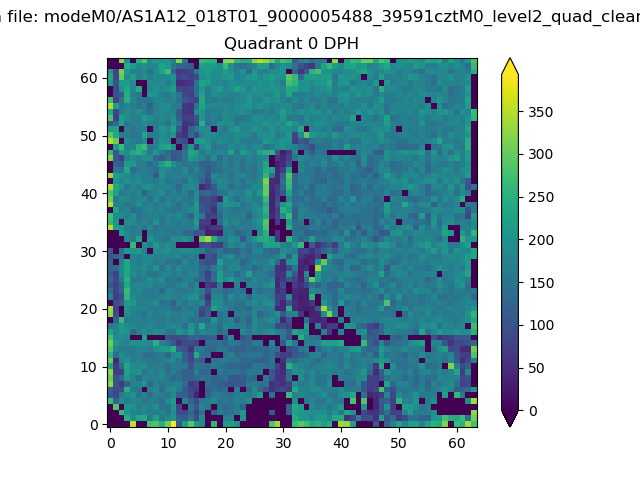 |
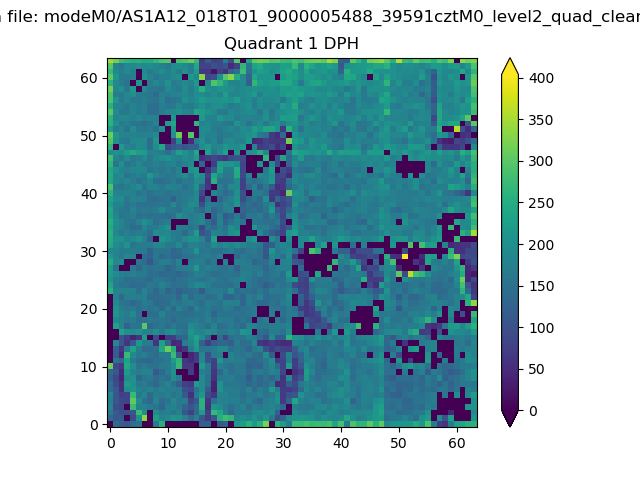 |
Quadrant B |
|---|---|---|---|
| Quadrant D | 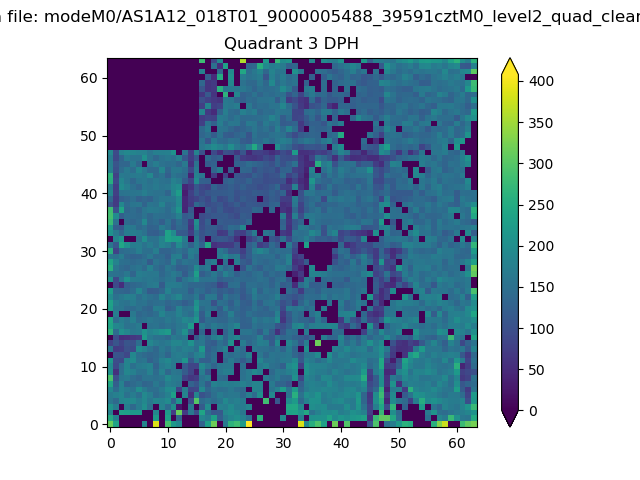 |
 |
Quadrant C |
| Plot type | Count rate plots | Images |
|---|---|---|
| Comparison with Poisson distribution Blue bars denote a histogram of data divided into 1 sec bins. Red curve is a Poisson curve with rate = median count rate of data. |
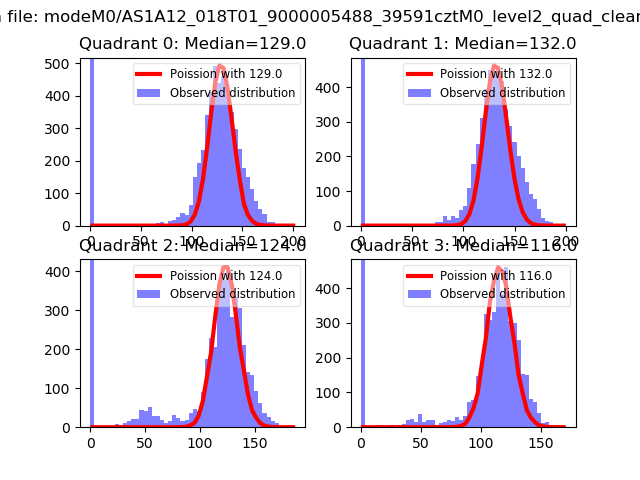 |
 |
| Quadrant-wise count rates Data is divided into 100 sec bins |
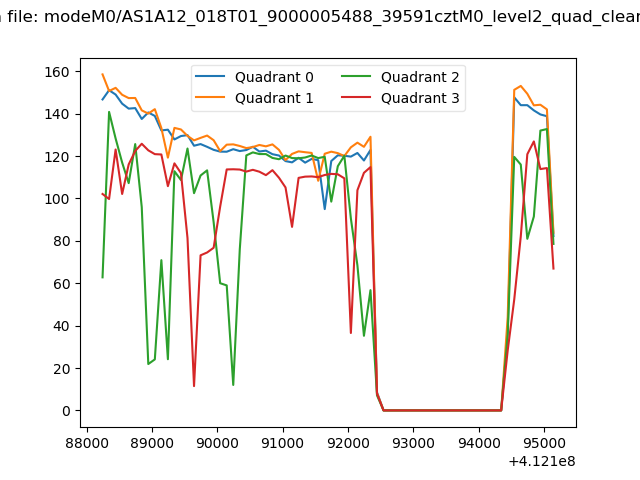 |
|
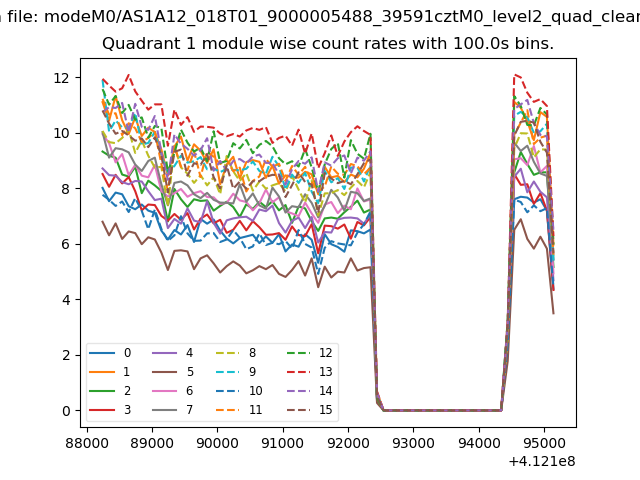
| Module-wise count rates for Quadrant A Data is divided into 100 sec bins |
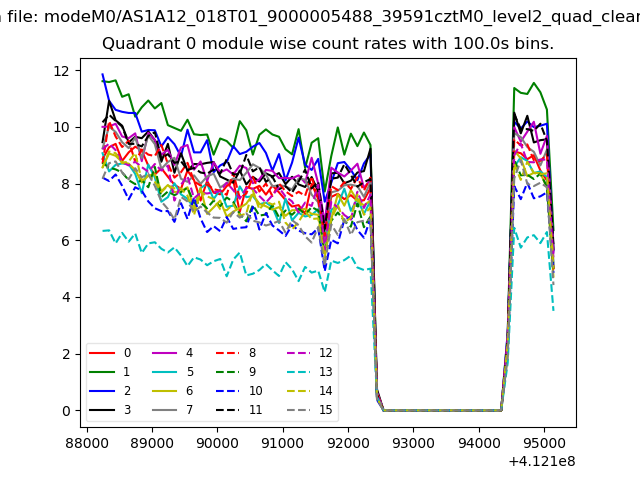 |
 |
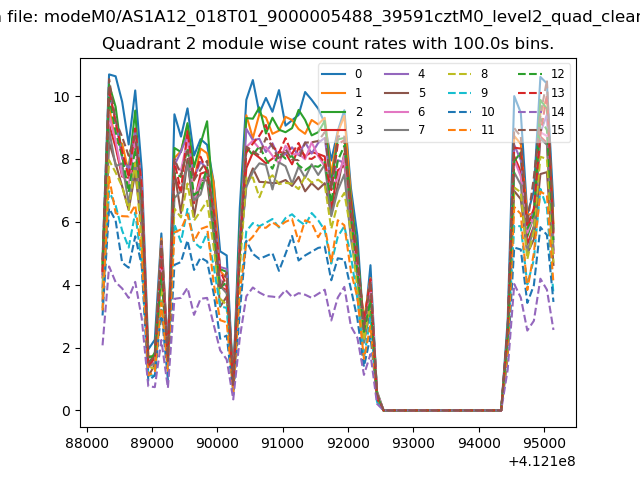
| Module-wise count rates for Quadrant B Data is divided into 100 sec bins |
 |
 |
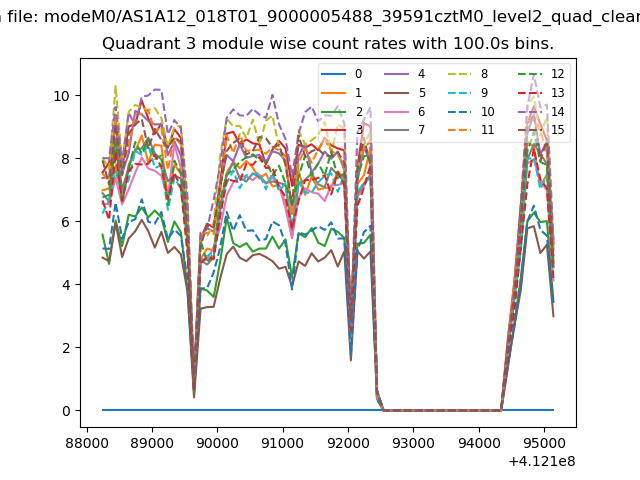
| Module-wise count rates for Quadrant C Data is divided into 100 sec bins |
 |
 |
| Module-wise count rates for Quadrant D Data is divided into 100 sec bins |
 |
 |
| Parameter | Plot |
|---|---|
| CZT HV Monitor | 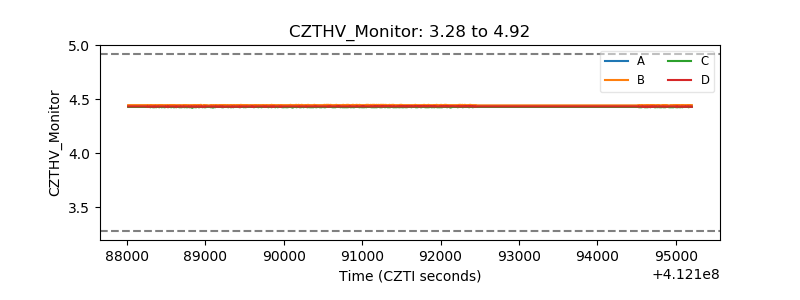 |
| D_VDD | 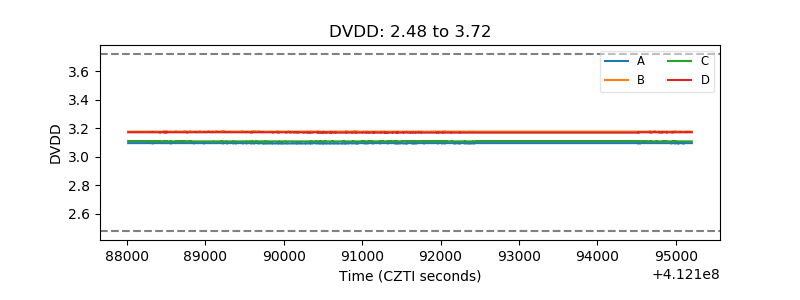 |
| Temperature 1 | 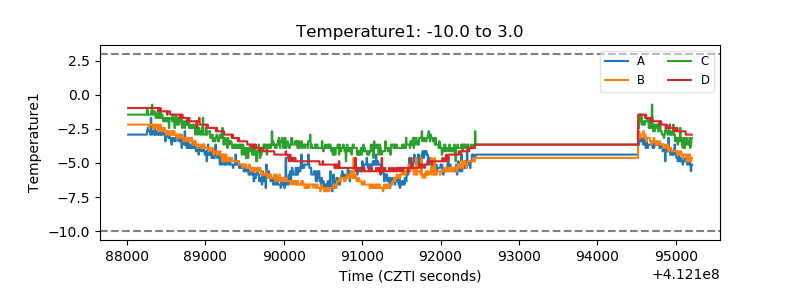 |
| Veto HV Monitor | 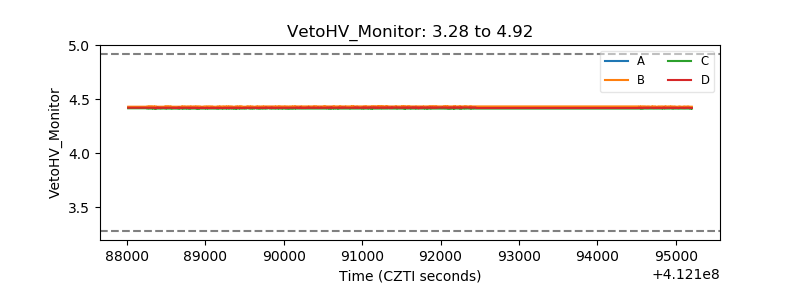 |
| Veto LLD | 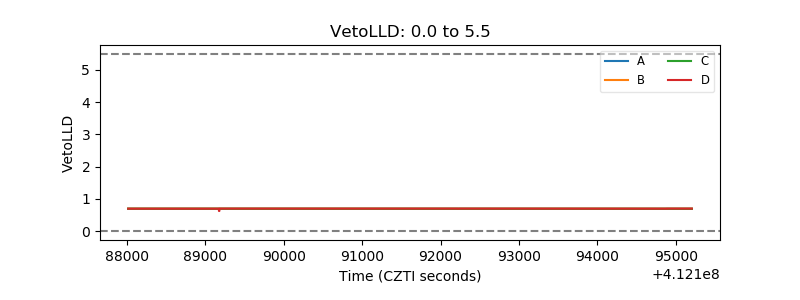 |
| Alpha Counter | 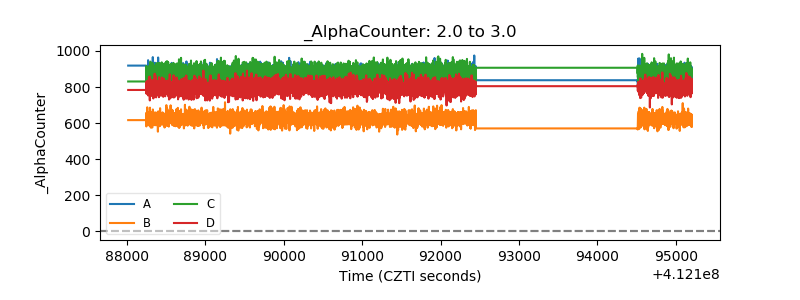 |
| _CPM_Rate | 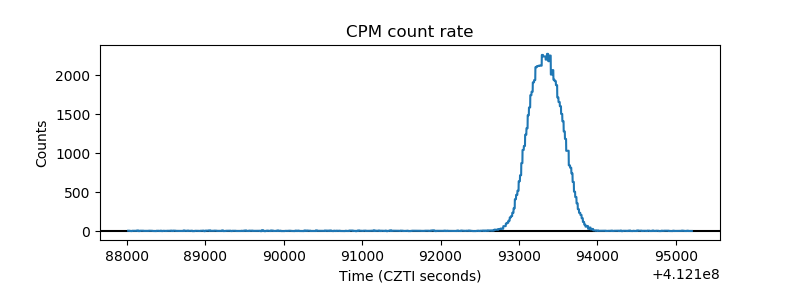 |
| CZT Counter | 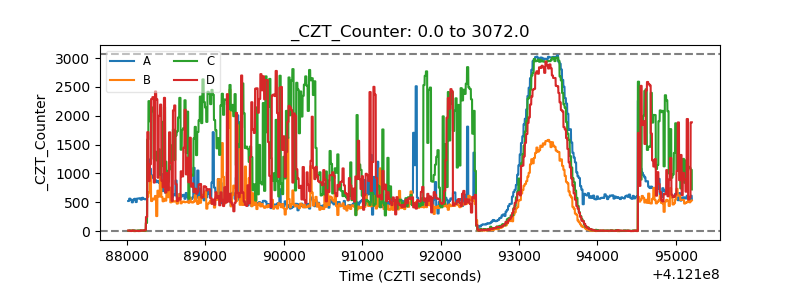 |
| +2.5 Volts monitor | 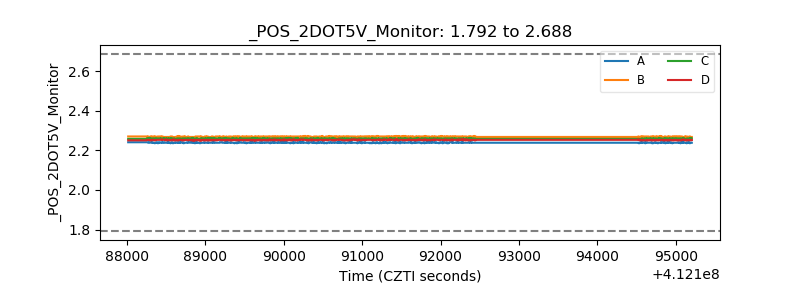 |
| +5 Volts monitor | 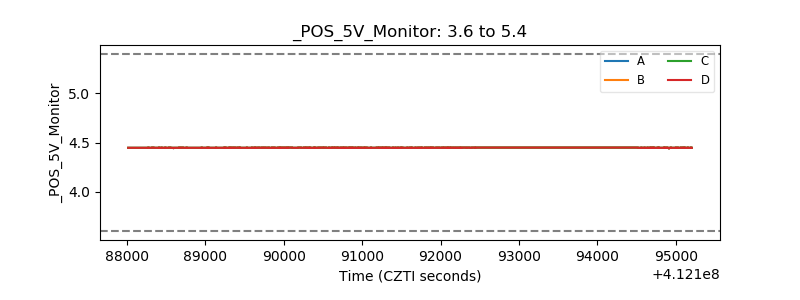 |
| _ROLL_ROT | 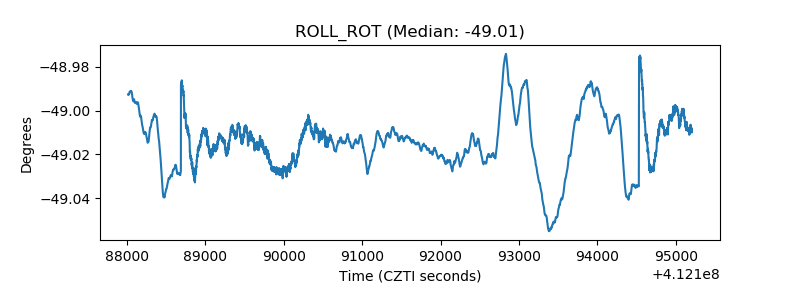 |
| _Roll_DEC | 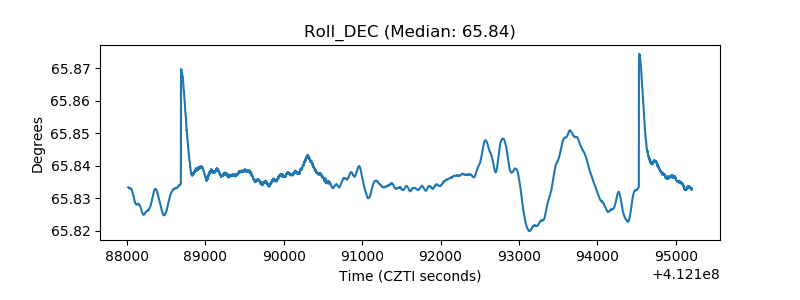 |
| _Roll_RA | 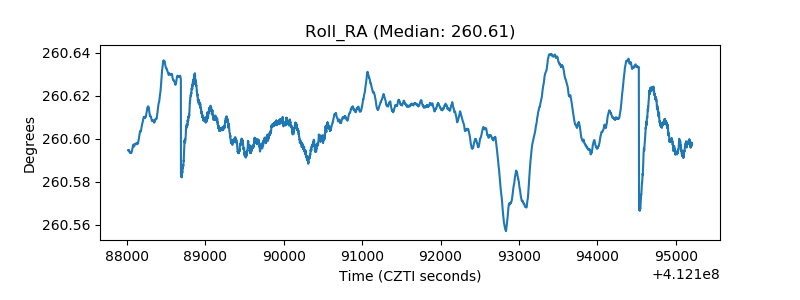 |
| Veto Counter | 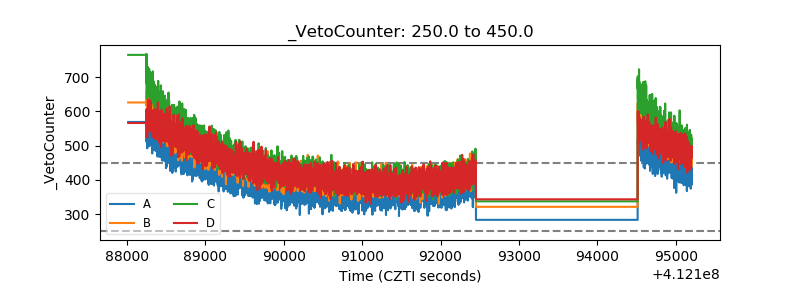 |