| Param | Original file | Final file |
|---|---|---|
| Filename | modeM0/AS1A12_018T01_9000005488_39593cztM0_level2.fits | modeM0/AS1A12_018T01_9000005488_39593cztM0_level2_quad_clean.evt |
| Size (bytes) | 406,728,000 | 84,427,200 |
| Size | 387.9 MB | 80.5 MB |
| Events in quadrant A | 2,873,381 | 584,471 |
| Events in quadrant B | 2,877,729 | 604,096 |
| Events in quadrant C | 6,342,058 | 477,344 |
| Events in quadrant D | 2,574,948 | 541,062 |
| Mode SS | |||
|---|---|---|---|
| Quadrant | BADHDUFLAG | Total packets | Discarded packets |
| A | 0 | 102 | 0 |
| B | 0 | 102 | 0 |
| C | 0 | 102 | 0 |
| D | 0 | 102 | 0 |
| Mode M0 | |||
|---|---|---|---|
| Quadrant | BADHDUFLAG | Total packets | Discarded packets |
| A | 0 | 11836 | 3 |
| B | 0 | 11948 | 2 |
| C | 0 | 22189 | 2 |
| D | 0 | 11393 | 2 |
| Mode M9 | |||
|---|---|---|---|
| Quadrant | BADHDUFLAG | Total packets | Discarded packets |
| A | 0 | 32 | 0 |
| B | 0 | 32 | 0 |
| C | 0 | 32 | 0 |
| D | 0 | 33 | 0 |
| Quadrant | Total seconds | Saturated seconds | Saturation percentage |
|---|---|---|---|
| A | 4983 | 100 | 2.006823% |
| B | 4983 | 105 | 2.107164% |
| C | 4983 | 1142 | 22.917921% |
| D | 4983 | 51 | 1.023480% |
Noise dominated data is calculated using 1-second bins in cleaned event files. If a bin has >2000 counts, and if more than 50% of those come from <1% of pixels, then it is considered to be noise-dominated and hence unusable.
| Quadrant | # 1 sec bins | Bins with >0 counts | Bins with >2000 counts | High rate bins dominated by noise | Noise dominated (total time) | Noise dominated (detector-on time) | Marked lightcurve |
|---|---|---|---|---|---|---|---|
| A | 7106 | 4984 | 70 | 70 | 0.99% | 1.40% | 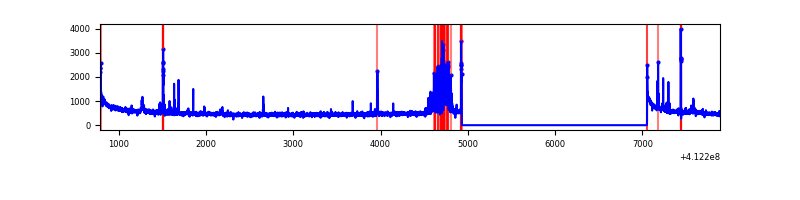 |
| B | 7106 | 4984 | 76 | 76 | 1.07% | 1.52% | 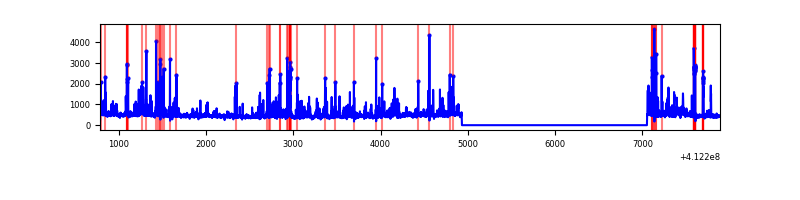 |
| C | 7106 | 4984 | 1059 | 1059 | 14.90% | 21.25% | 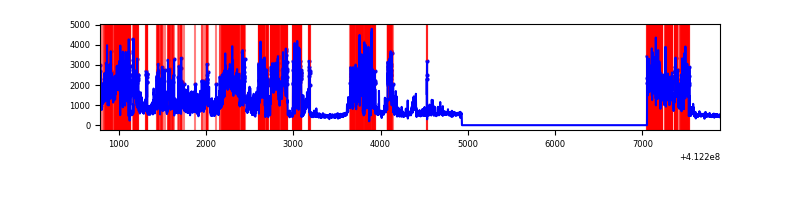 |
| D | 7106 | 4984 | 49 | 49 | 0.69% | 0.98% | 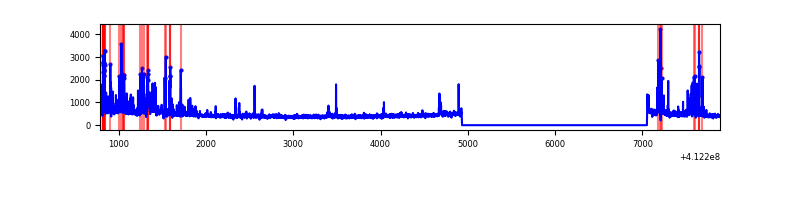 |
Top three noisy pixels from each quadrant. If the there are fewer than three noisy pixels in the level2.evt file, extra rows are filled as -1
| Pixel properties | Quadrant properties | ||||||
|---|---|---|---|---|---|---|---|
| Quadrant | DetID | PixID | Counts | Sigma | Mean | Median | Sigma |
| A | 10 | 83 | 412456 | 3748.81 | 541 | 530 | 109.9 |
| A | 13 | 248 | 285328 | 2591.86 | 541 | 530 | 109.9 |
| A | 9 | 143 | 79656 | 720.1 | 541 | 530 | 109.9 |
| B | 5 | 255 | 388879 | 3792.12 | 543 | 529 | 102.4 |
| B | 5 | 172 | 345087 | 3364.51 | 543 | 529 | 102.4 |
| B | 12 | 111 | 12588 | 117.75 | 543 | 529 | 102.4 |
| C | 9 | 187 | 3077768 | 26465.28 | 503 | 508 | 116.3 |
| C | 15 | 208 | 1030177 | 8855.44 | 503 | 508 | 116.3 |
| C | 15 | 214 | 207612 | 1781.15 | 503 | 508 | 116.3 |
| D | 13 | 249 | 112999 | 867.01 | 534 | 520 | 129.7 |
| D | 5 | 32 | 112751 | 865.1 | 534 | 520 | 129.7 |
| D | 1 | 52 | 89053 | 682.43 | 534 | 520 | 129.7 |
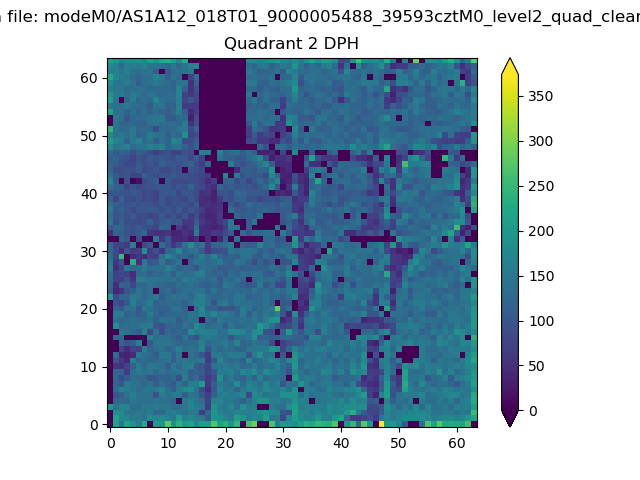
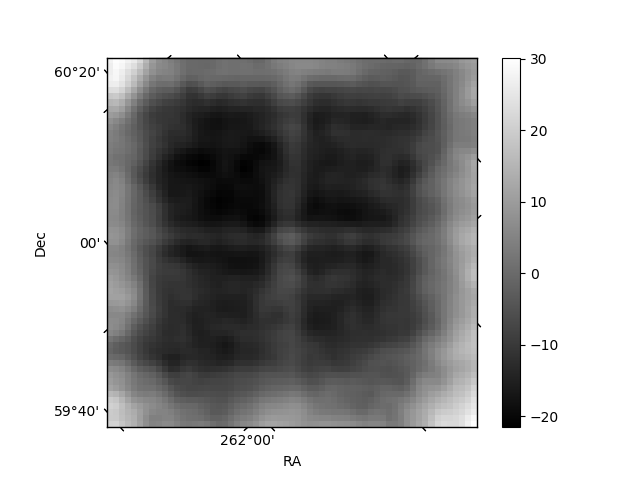
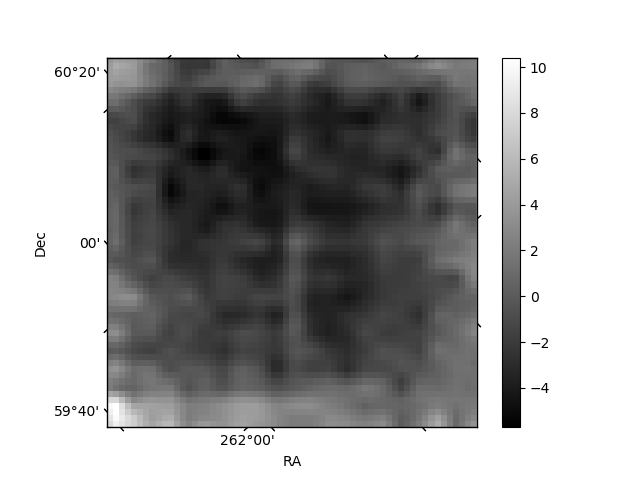
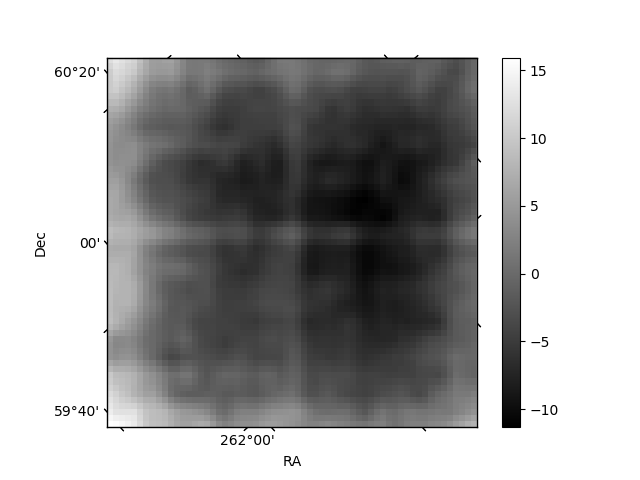
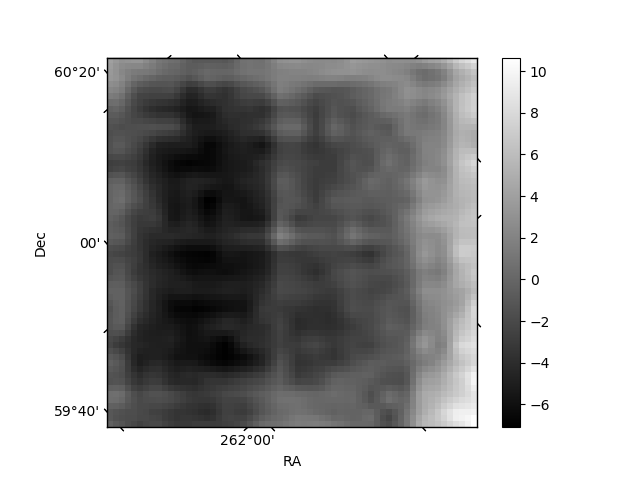
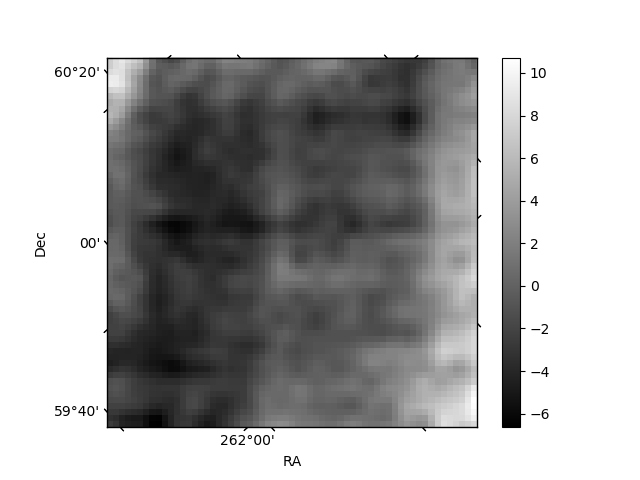
Histogram calculated using DETX and DETY for each event in the final _common_clean file
| Quadrant A | 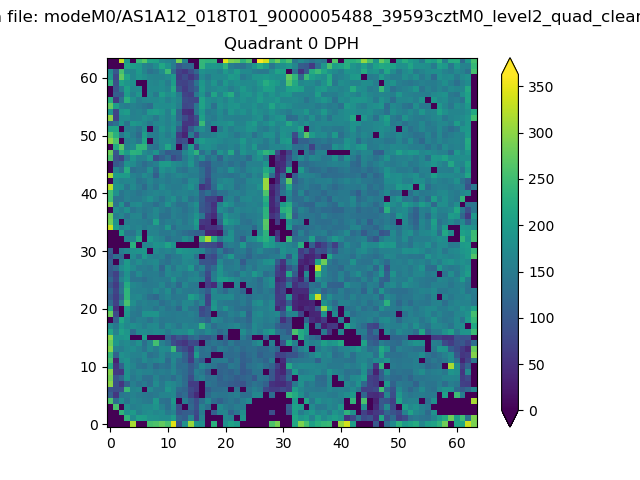 |
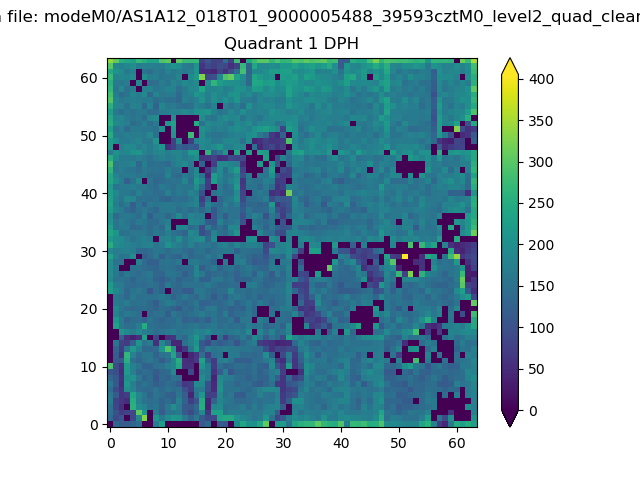 |
Quadrant B |
|---|---|---|---|
| Quadrant D | 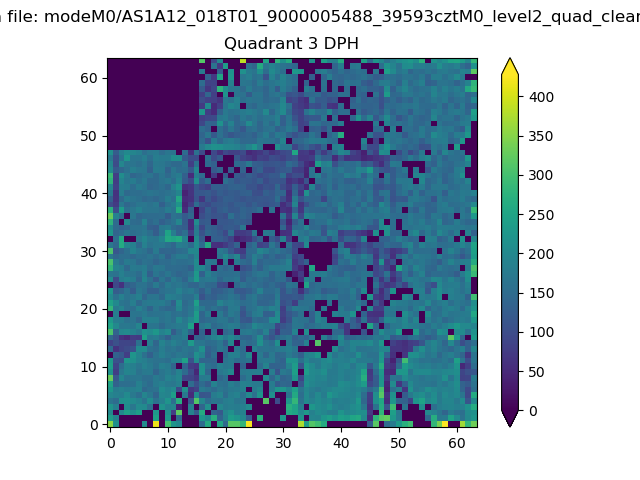 |
 |
Quadrant C |
| Plot type | Count rate plots | Images |
|---|---|---|
| Comparison with Poisson distribution Blue bars denote a histogram of data divided into 1 sec bins. Red curve is a Poisson curve with rate = median count rate of data. |
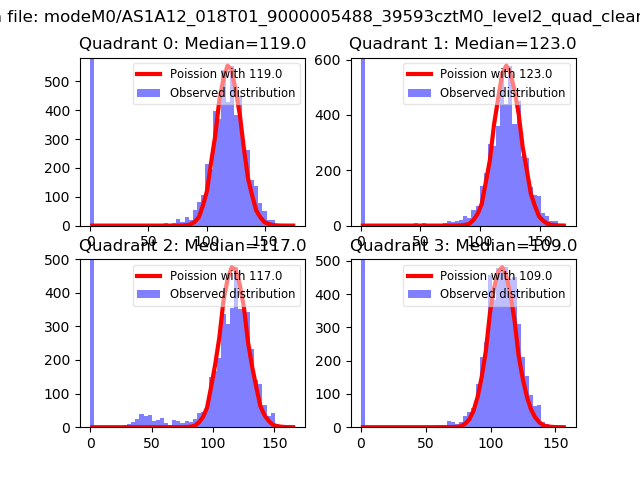 |
 |
| Quadrant-wise count rates Data is divided into 100 sec bins |
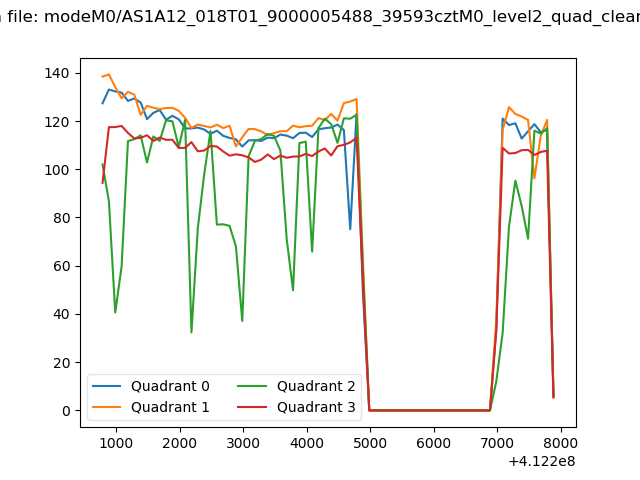 |
|
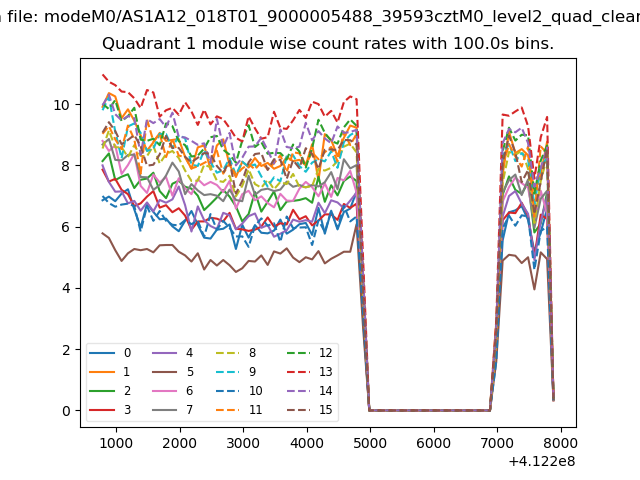
| Module-wise count rates for Quadrant A Data is divided into 100 sec bins |
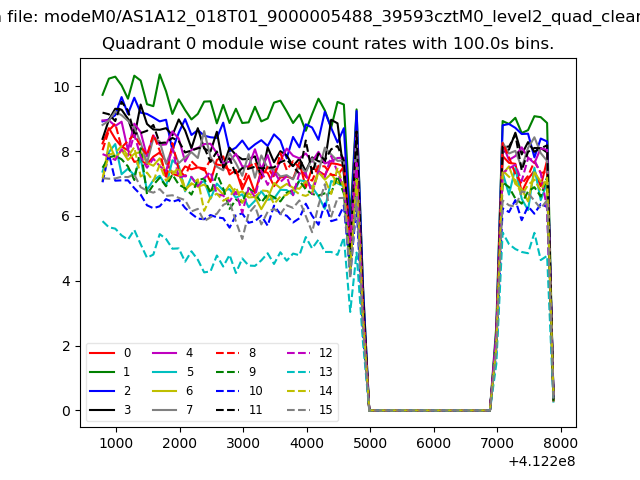 |
 |
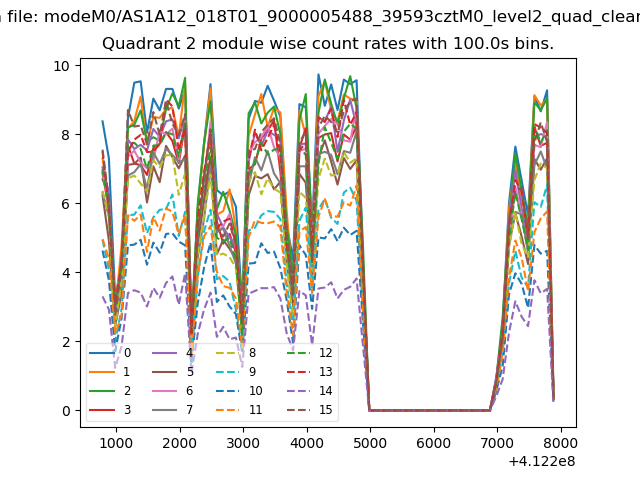
| Module-wise count rates for Quadrant B Data is divided into 100 sec bins |
 |
 |
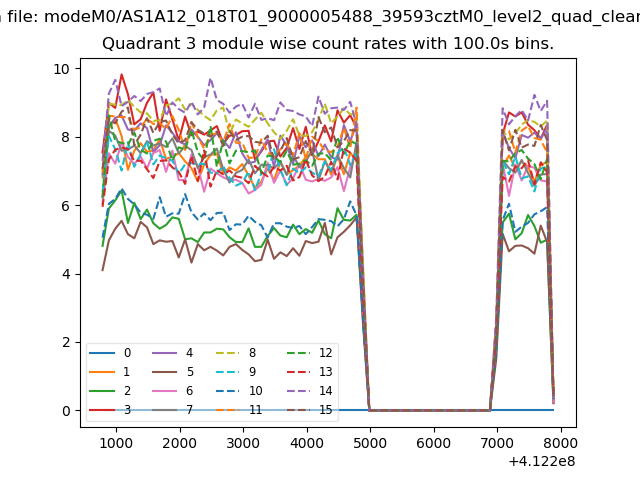
| Module-wise count rates for Quadrant C Data is divided into 100 sec bins |
 |
 |
| Module-wise count rates for Quadrant D Data is divided into 100 sec bins |
 |
 |
| Parameter | Plot |
|---|---|
| CZT HV Monitor | 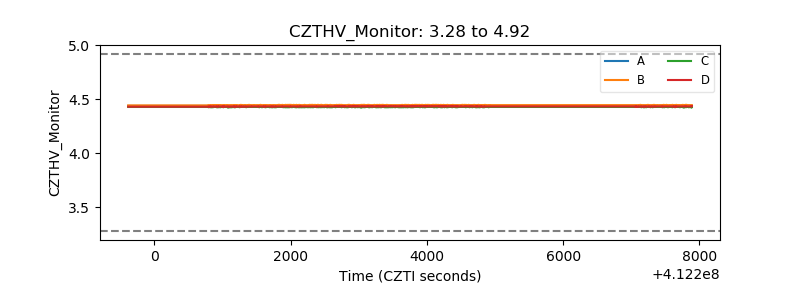 |
| D_VDD | 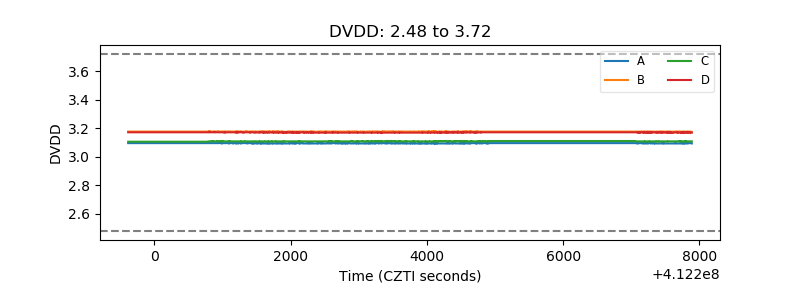 |
| Temperature 1 | 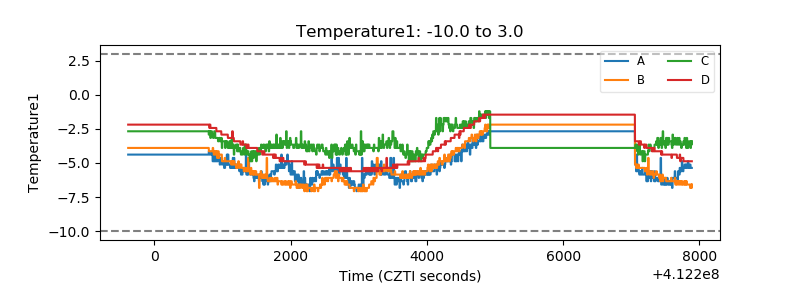 |
| Veto HV Monitor | 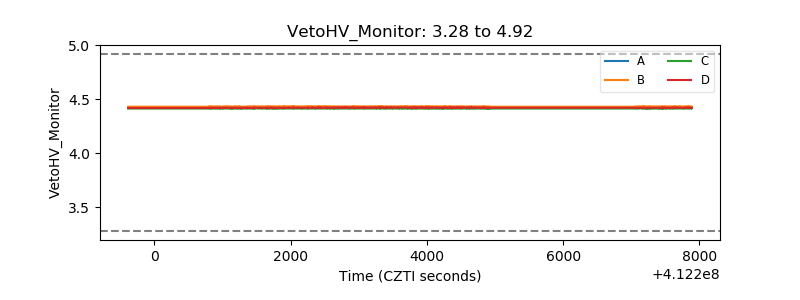 |
| Veto LLD | 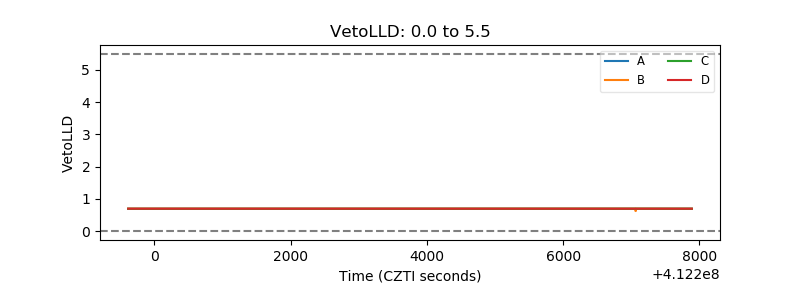 |
| Alpha Counter | 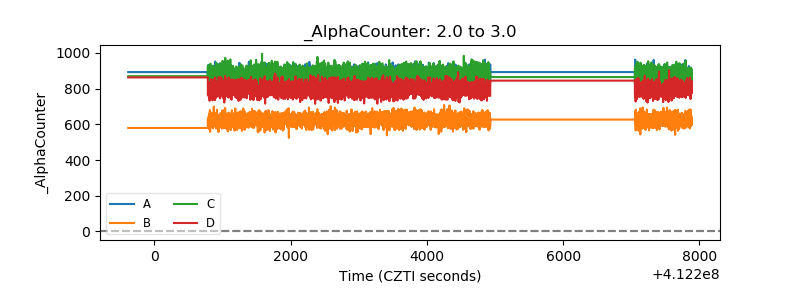 |
| _CPM_Rate | 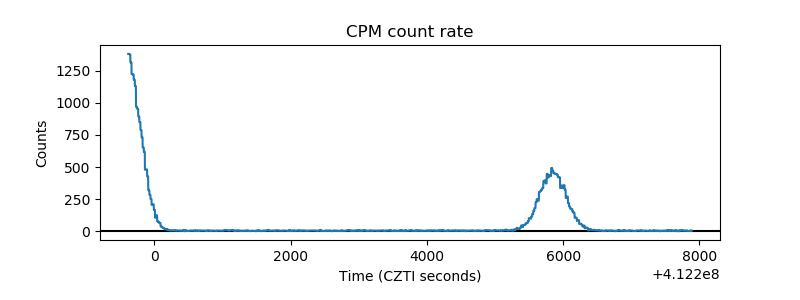 |
| CZT Counter | 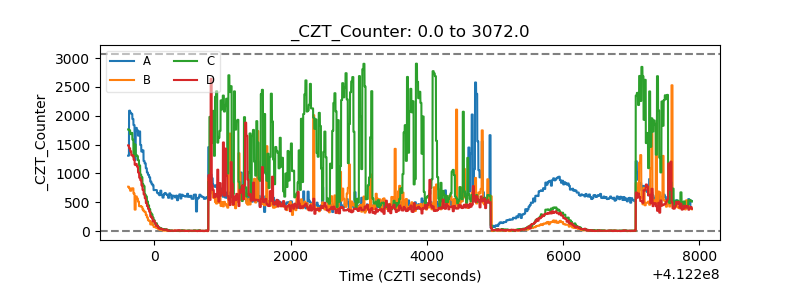 |
| +2.5 Volts monitor | 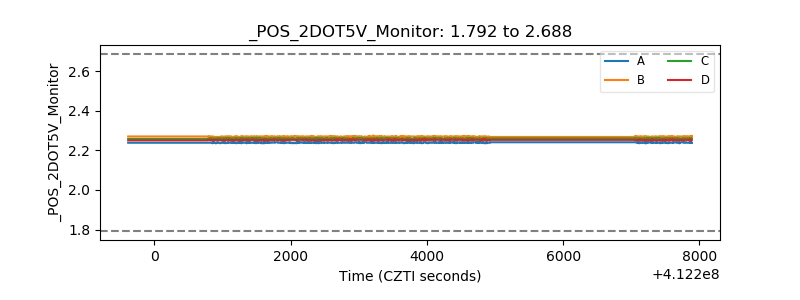 |
| +5 Volts monitor | 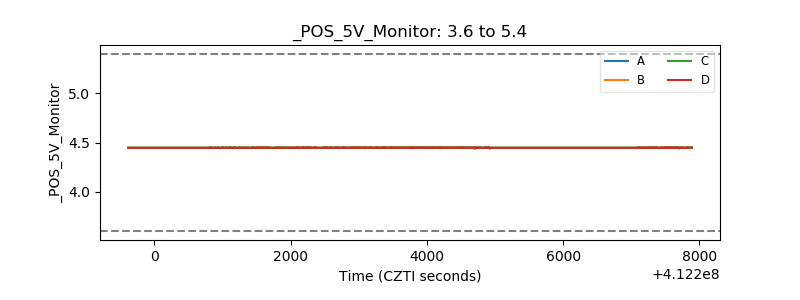 |
| _ROLL_ROT | 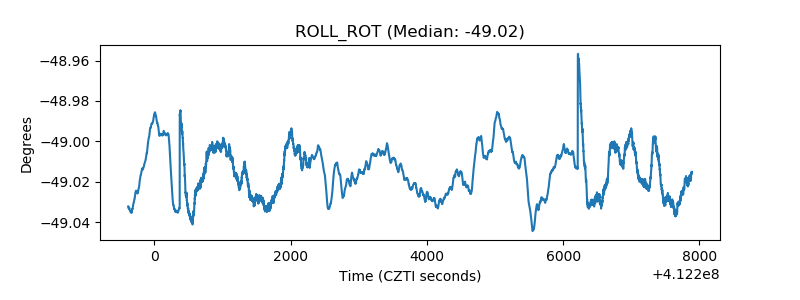 |
| _Roll_DEC | 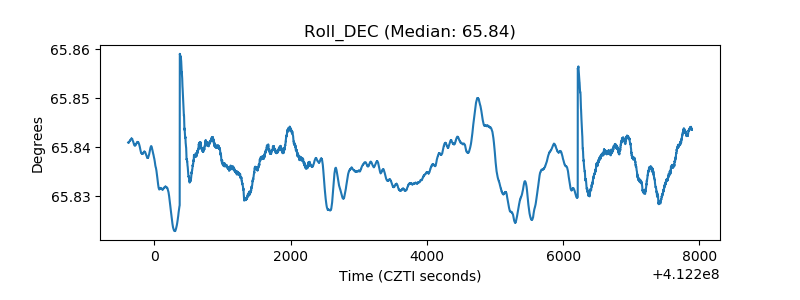 |
| _Roll_RA | 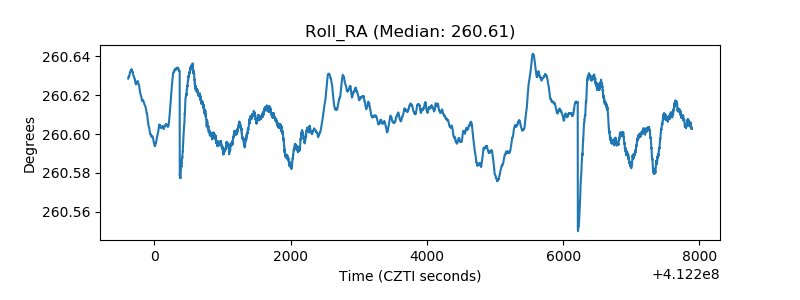 |
| Veto Counter | 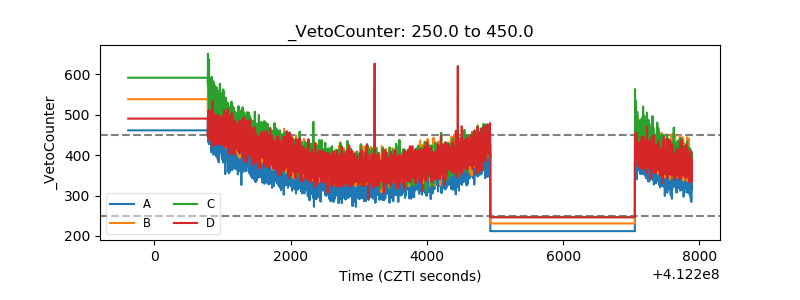 |