| Param | Original file | Final file |
|---|---|---|
| Filename | modeM0/AS1A12_018T01_9000005488_39595cztM0_level2.fits | modeM0/AS1A12_018T01_9000005488_39595cztM0_level2_quad_clean.evt |
| Size (bytes) | 732,660,480 | 160,194,240 |
| Size | 698.7 MB | 152.8 MB |
| Events in quadrant A | 6,190,427 | 1,071,893 |
| Events in quadrant B | 7,982,765 | 1,051,395 |
| Events in quadrant C | 7,231,358 | 1,043,026 |
| Events in quadrant D | 4,948,660 | 997,606 |
| Mode SS | |||
|---|---|---|---|
| Quadrant | BADHDUFLAG | Total packets | Discarded packets |
| A | 0 | 202 | 0 |
| B | 0 | 202 | 0 |
| C | 0 | 202 | 0 |
| D | 0 | 202 | 0 |
| Mode M0 | |||
|---|---|---|---|
| Quadrant | BADHDUFLAG | Total packets | Discarded packets |
| A | 0 | 24855 | 4 |
| B | 0 | 30553 | 3 |
| C | 0 | 28123 | 3 |
| D | 0 | 22481 | 3 |
| Mode M9 | |||
|---|---|---|---|
| Quadrant | BADHDUFLAG | Total packets | Discarded packets |
| A | 0 | 50 | 0 |
| B | 0 | 50 | 0 |
| C | 0 | 50 | 0 |
| D | 0 | 51 | 0 |
| Quadrant | Total seconds | Saturated seconds | Saturation percentage |
|---|---|---|---|
| A | 9904 | 329 | 3.321890% |
| B | 9904 | 937 | 9.460824% |
| C | 9904 | 498 | 5.028271% |
| D | 9904 | 108 | 1.090468% |
Noise dominated data is calculated using 1-second bins in cleaned event files. If a bin has >2000 counts, and if more than 50% of those come from <1% of pixels, then it is considered to be noise-dominated and hence unusable.
| Quadrant | # 1 sec bins | Bins with >0 counts | Bins with >2000 counts | High rate bins dominated by noise | Noise dominated (total time) | Noise dominated (detector-on time) | Marked lightcurve |
|---|---|---|---|---|---|---|---|
| A | 13520 | 9906 | 250 | 250 | 1.85% | 2.52% | 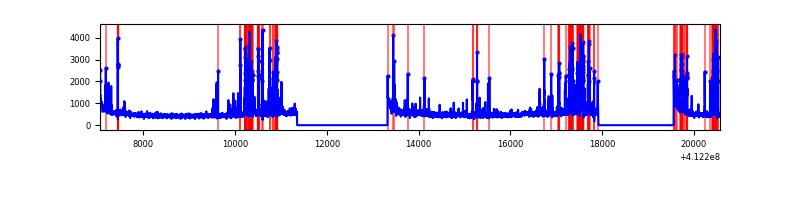 |
| B | 13520 | 9906 | 683 | 683 | 5.05% | 6.89% | 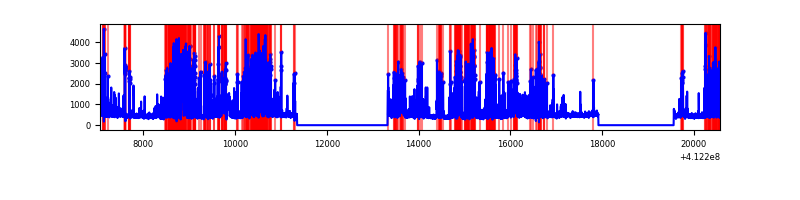 |
| C | 13520 | 9906 | 434 | 434 | 3.21% | 4.38% | 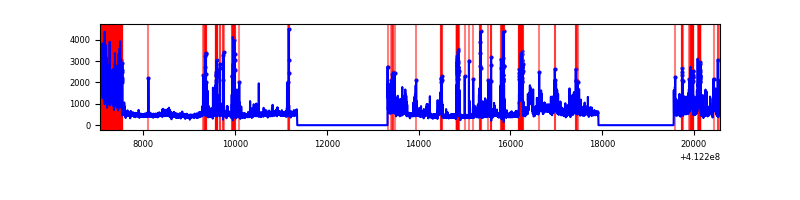 |
| D | 13520 | 9906 | 88 | 88 | 0.65% | 0.89% | 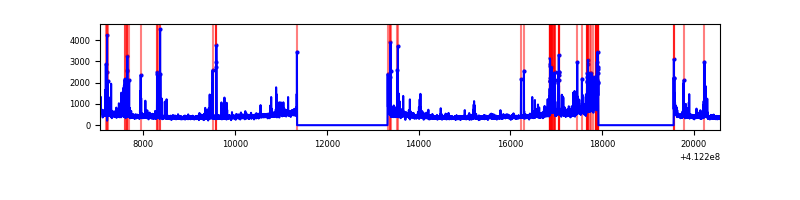 |
Top three noisy pixels from each quadrant. If the there are fewer than three noisy pixels in the level2.evt file, extra rows are filled as -1
| Pixel properties | Quadrant properties | ||||||
|---|---|---|---|---|---|---|---|
| Quadrant | DetID | PixID | Counts | Sigma | Mean | Median | Sigma |
| A | 9 | 143 | 939348 | 4507.56 | 1034 | 1013 | 208.2 |
| A | 10 | 83 | 740490 | 3552.29 | 1034 | 1013 | 208.2 |
| A | 13 | 248 | 402787 | 1930.04 | 1034 | 1013 | 208.2 |
| B | 5 | 255 | 3788598 | 19679.22 | 1014 | 986 | 192.5 |
| B | 5 | 172 | 182160 | 941.32 | 1014 | 986 | 192.5 |
| B | 12 | 111 | 24528 | 122.32 | 1014 | 986 | 192.5 |
| C | 9 | 187 | 1587608 | 6817.69 | 1008 | 1015 | 232.7 |
| C | 15 | 208 | 1080339 | 4637.92 | 1008 | 1015 | 232.7 |
| C | 15 | 214 | 429984 | 1843.31 | 1008 | 1015 | 232.7 |
| D | 13 | 174 | 319459 | 1287.53 | 1019 | 992 | 247.3 |
| D | 1 | 52 | 218249 | 878.35 | 1019 | 992 | 247.3 |
| D | 13 | 171 | 132683 | 532.41 | 1019 | 992 | 247.3 |
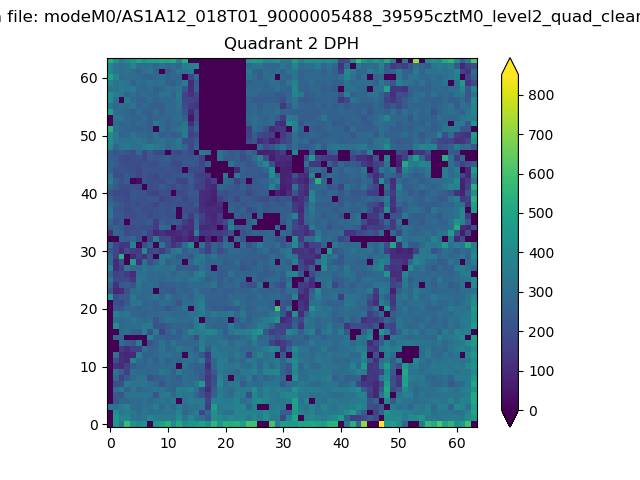
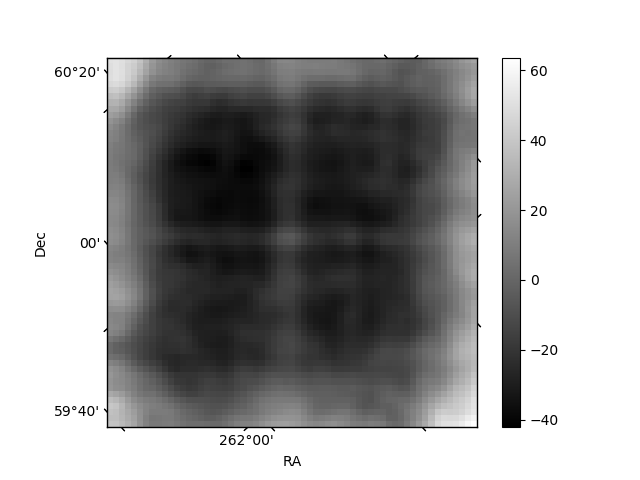
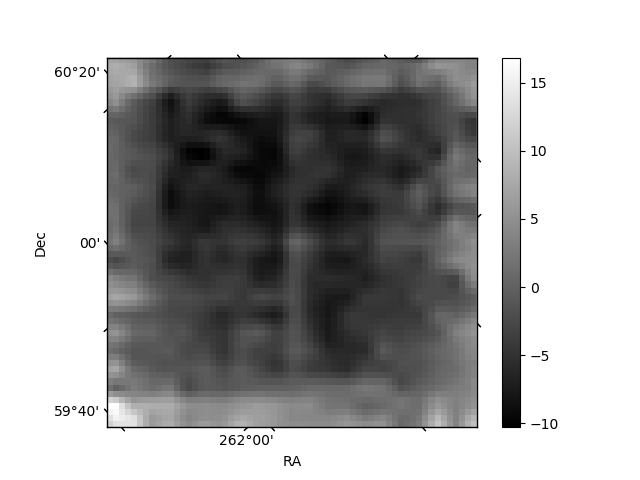
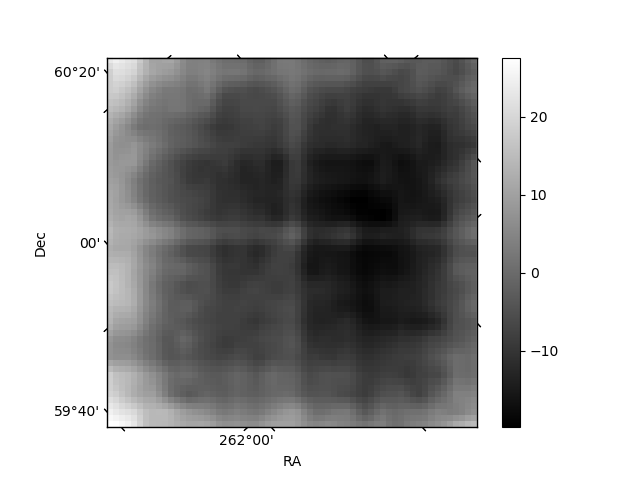
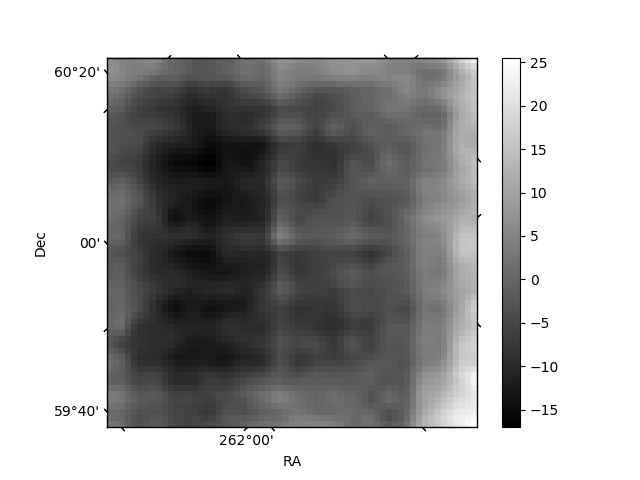
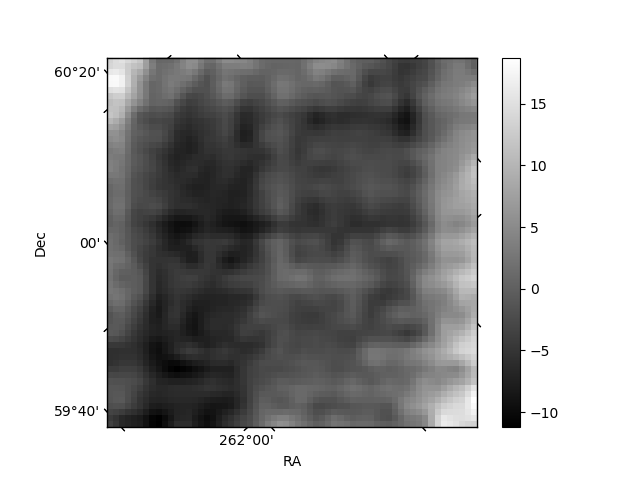
Histogram calculated using DETX and DETY for each event in the final _common_clean file
| Quadrant A | 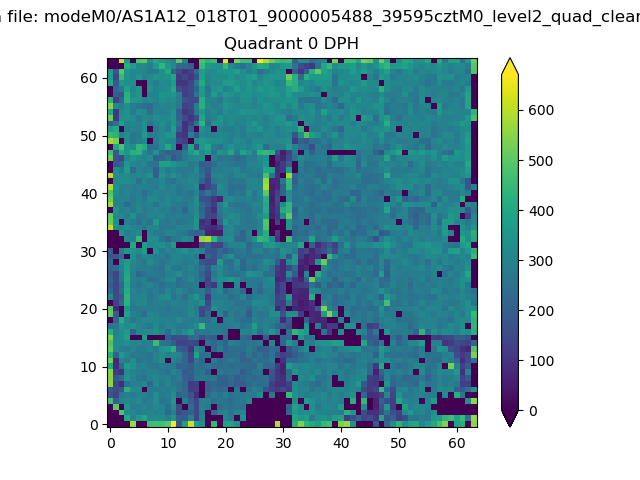 |
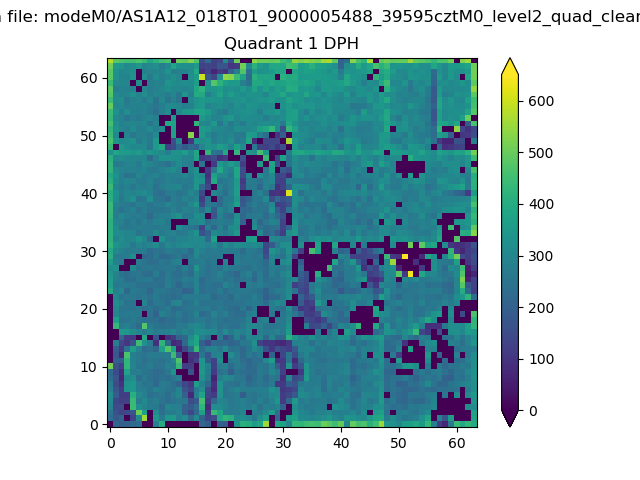 |
Quadrant B |
|---|---|---|---|
| Quadrant D | 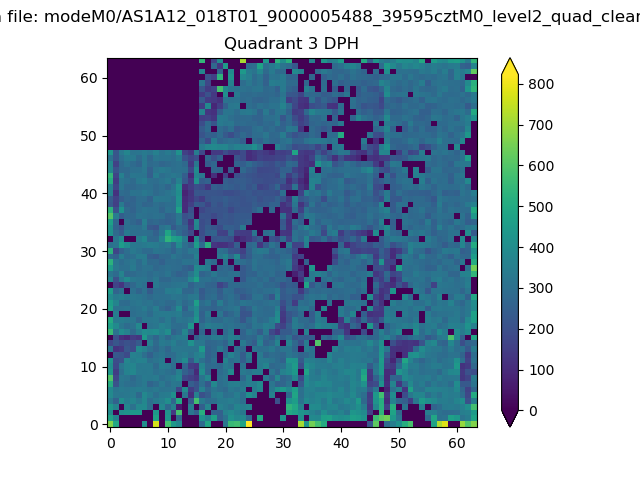 |
 |
Quadrant C |
| Plot type | Count rate plots | Images |
|---|---|---|
| Comparison with Poisson distribution Blue bars denote a histogram of data divided into 1 sec bins. Red curve is a Poisson curve with rate = median count rate of data. |
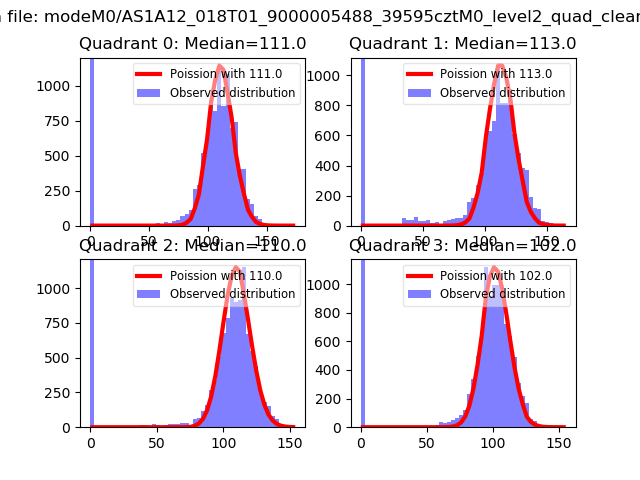 |
 |
| Quadrant-wise count rates Data is divided into 100 sec bins |
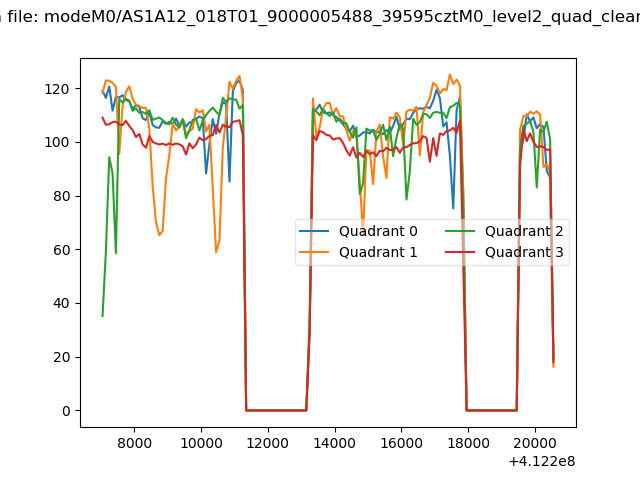 |
|
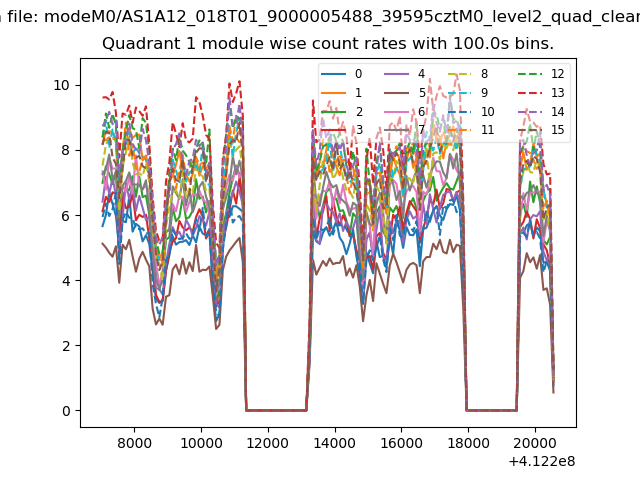
| Module-wise count rates for Quadrant A Data is divided into 100 sec bins |
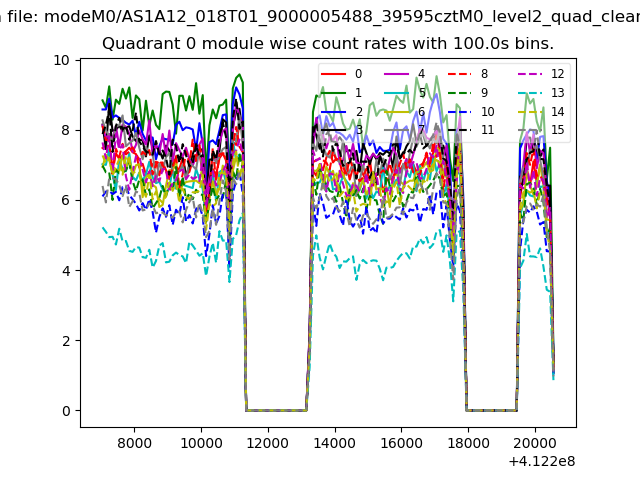 |
 |
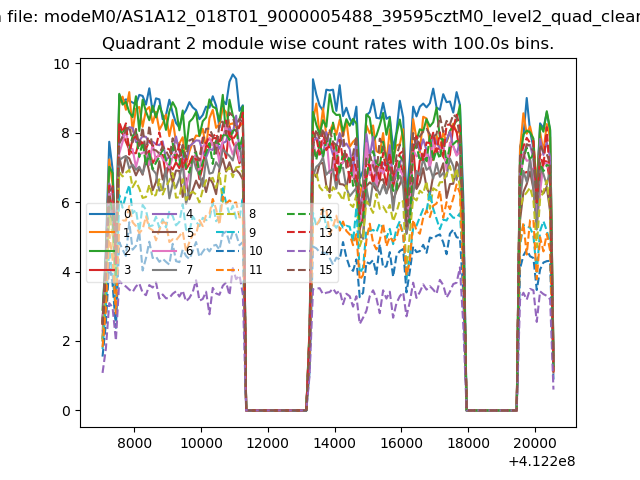
| Module-wise count rates for Quadrant B Data is divided into 100 sec bins |
 |
 |
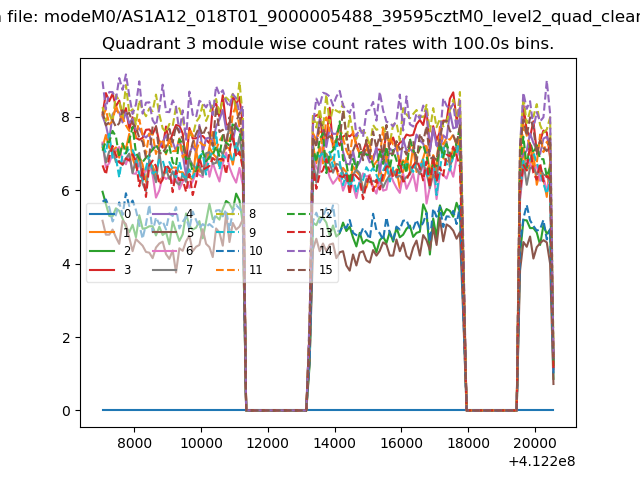
| Module-wise count rates for Quadrant C Data is divided into 100 sec bins |
 |
 |
| Module-wise count rates for Quadrant D Data is divided into 100 sec bins |
 |
 |
| Parameter | Plot |
|---|---|
| CZT HV Monitor | 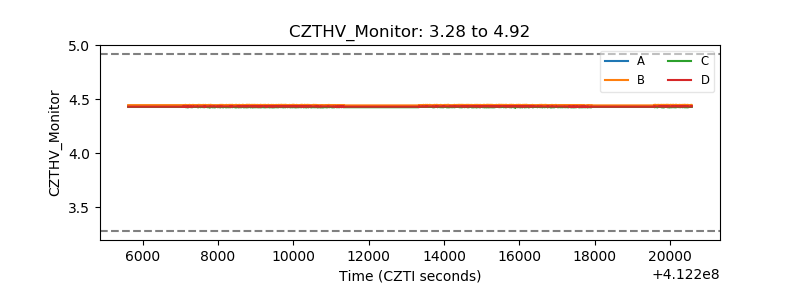 |
| D_VDD | 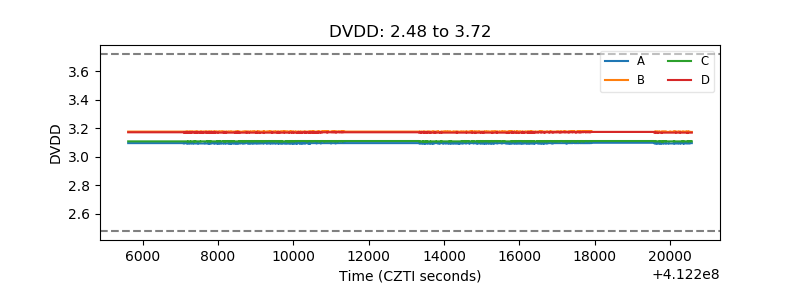 |
| Temperature 1 | 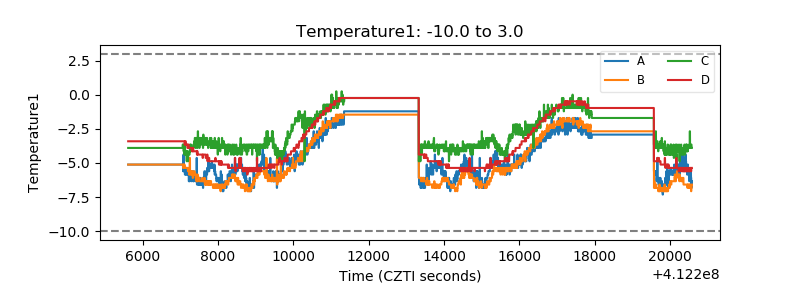 |
| Veto HV Monitor | 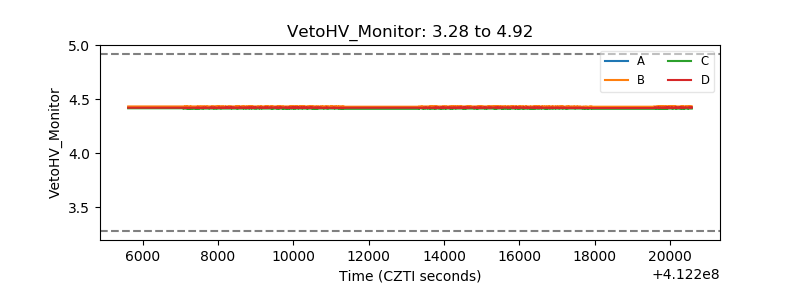 |
| Veto LLD | 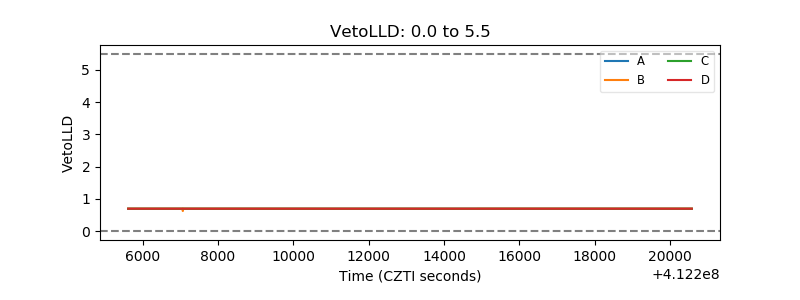 |
| Alpha Counter | 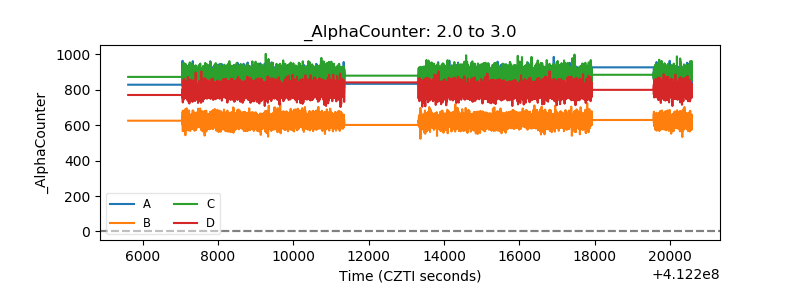 |
| _CPM_Rate | 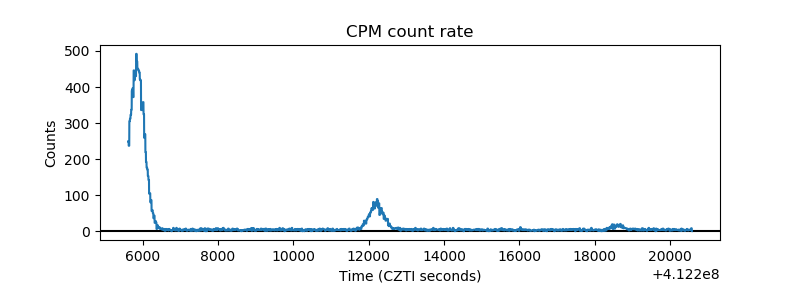 |
| CZT Counter | 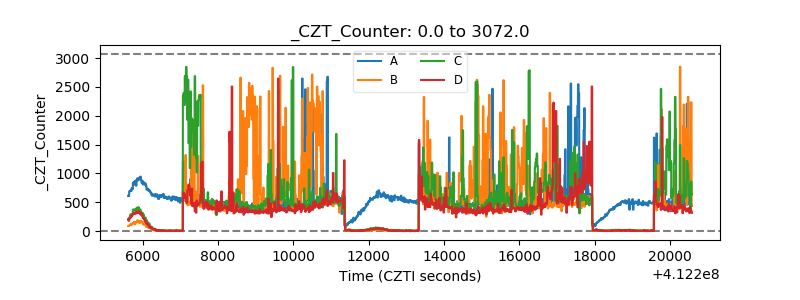 |
| +2.5 Volts monitor | 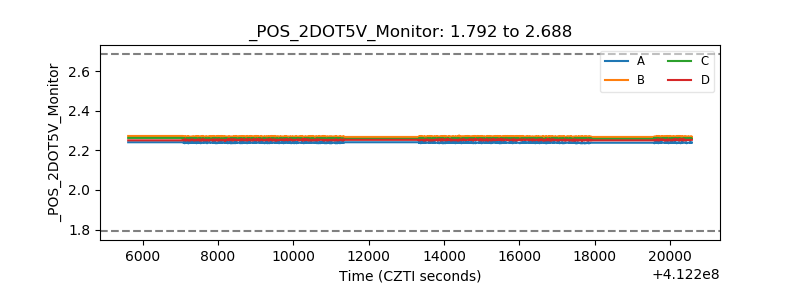 |
| +5 Volts monitor | 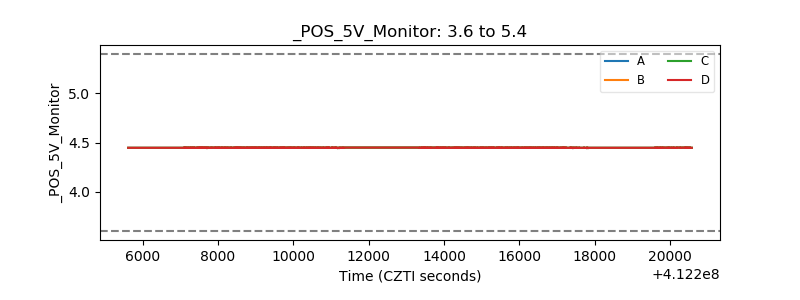 |
| _ROLL_ROT | 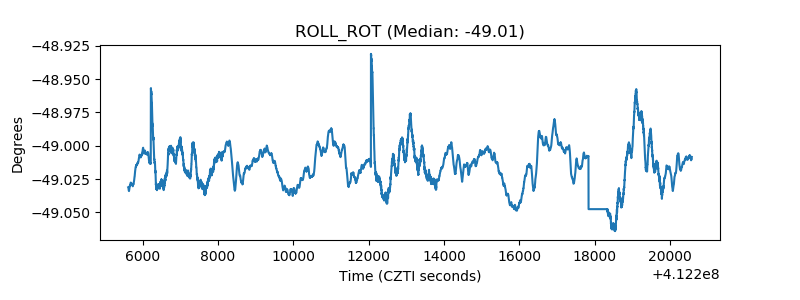 |
| _Roll_DEC | 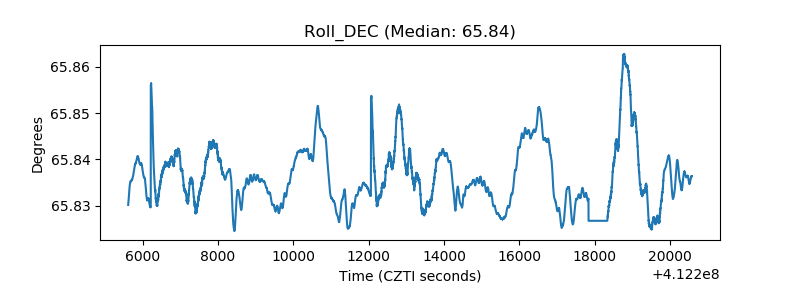 |
| _Roll_RA | 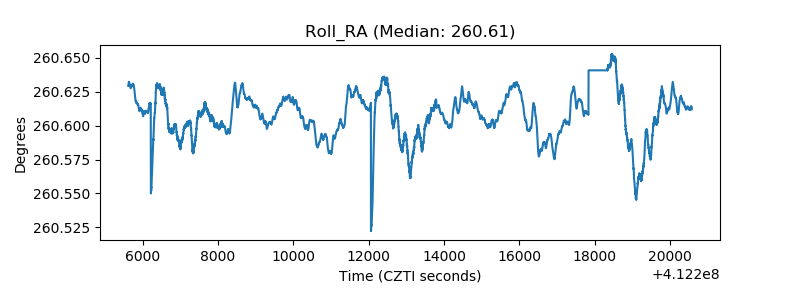 |
| Veto Counter | 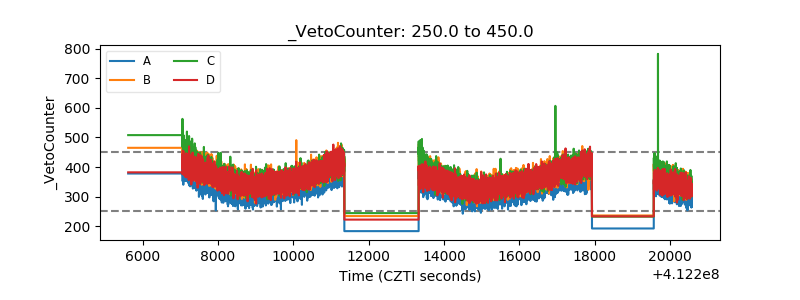 |