| Param | Original file | Final file |
|---|---|---|
| Filename | modeM0/AS1A12_018T01_9000005488_39596cztM0_level2.fits | modeM0/AS1A12_018T01_9000005488_39596cztM0_level2_quad_clean.evt |
| Size (bytes) | 473,846,400 | 91,198,080 |
| Size | 451.9 MB | 87.0 MB |
| Events in quadrant A | 3,904,589 | 604,934 |
| Events in quadrant B | 3,685,574 | 626,311 |
| Events in quadrant C | 5,577,194 | 581,948 |
| Events in quadrant D | 3,923,661 | 543,558 |
| Mode SS | |||
|---|---|---|---|
| Quadrant | BADHDUFLAG | Total packets | Discarded packets |
| A | 0 | 118 | 0 |
| B | 0 | 118 | 0 |
| C | 0 | 118 | 0 |
| D | 0 | 118 | 0 |
| Mode M0 | |||
|---|---|---|---|
| Quadrant | BADHDUFLAG | Total packets | Discarded packets |
| A | 0 | 15309 | 3 |
| B | 0 | 15024 | 2 |
| C | 0 | 20621 | 2 |
| D | 0 | 15880 | 2 |
| Mode M9 | |||
|---|---|---|---|
| Quadrant | BADHDUFLAG | Total packets | Discarded packets |
| A | 0 | 17 | 0 |
| B | 0 | 17 | 0 |
| C | 0 | 17 | 0 |
| D | 0 | 18 | 0 |
| Quadrant | Total seconds | Saturated seconds | Saturation percentage |
|---|---|---|---|
| A | 5784 | 303 | 5.238589% |
| B | 5784 | 288 | 4.979253% |
| C | 5784 | 466 | 8.056708% |
| D | 5784 | 334 | 5.774550% |
Noise dominated data is calculated using 1-second bins in cleaned event files. If a bin has >2000 counts, and if more than 50% of those come from <1% of pixels, then it is considered to be noise-dominated and hence unusable.
| Quadrant | # 1 sec bins | Bins with >0 counts | Bins with >2000 counts | High rate bins dominated by noise | Noise dominated (total time) | Noise dominated (detector-on time) | Marked lightcurve |
|---|---|---|---|---|---|---|---|
| A | 7156 | 5785 | 250 | 250 | 3.49% | 4.32% | 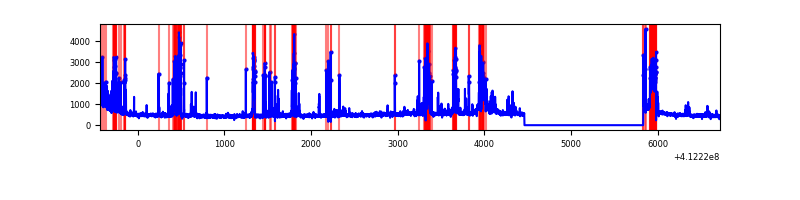 |
| B | 7156 | 5785 | 218 | 218 | 3.05% | 3.77% | 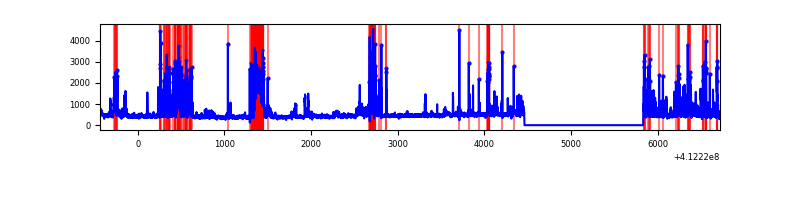 |
| C | 7156 | 5785 | 442 | 442 | 6.18% | 7.64% | 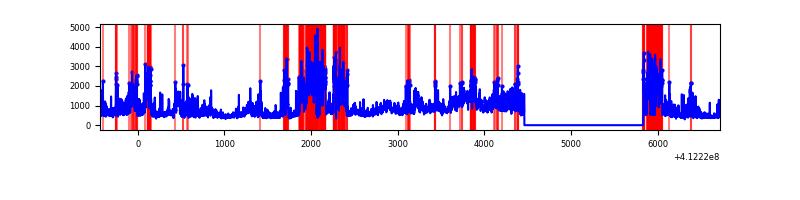 |
| D | 7156 | 5785 | 337 | 337 | 4.71% | 5.83% | 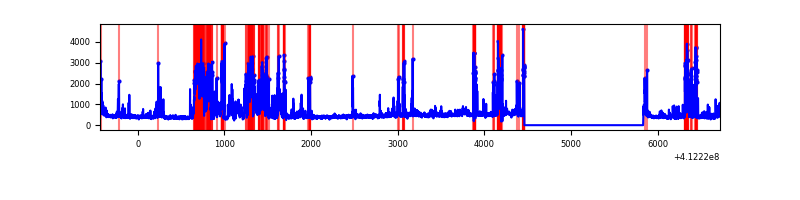 |
Top three noisy pixels from each quadrant. If the there are fewer than three noisy pixels in the level2.evt file, extra rows are filled as -1
| Pixel properties | Quadrant properties | ||||||
|---|---|---|---|---|---|---|---|
| Quadrant | DetID | PixID | Counts | Sigma | Mean | Median | Sigma |
| A | 9 | 143 | 760368 | 6203.23 | 601 | 589 | 122.5 |
| A | 10 | 83 | 452109 | 3686.45 | 601 | 589 | 122.5 |
| A | 13 | 248 | 310584 | 2530.96 | 601 | 589 | 122.5 |
| B | 5 | 255 | 809364 | 6969.59 | 602 | 586 | 116.0 |
| B | 5 | 172 | 509317 | 4383.96 | 602 | 586 | 116.0 |
| B | 12 | 111 | 14421 | 119.22 | 602 | 586 | 116.0 |
| C | 9 | 187 | 1716217 | 12591.84 | 585 | 587 | 136.2 |
| C | 15 | 208 | 1243651 | 9123.45 | 585 | 587 | 136.2 |
| C | 15 | 214 | 251816 | 1843.89 | 585 | 587 | 136.2 |
| D | 13 | 174 | 770238 | 5423.49 | 584 | 568 | 141.9 |
| D | 1 | 47 | 258645 | 1818.54 | 584 | 568 | 141.9 |
| D | 13 | 171 | 225744 | 1586.7 | 584 | 568 | 141.9 |
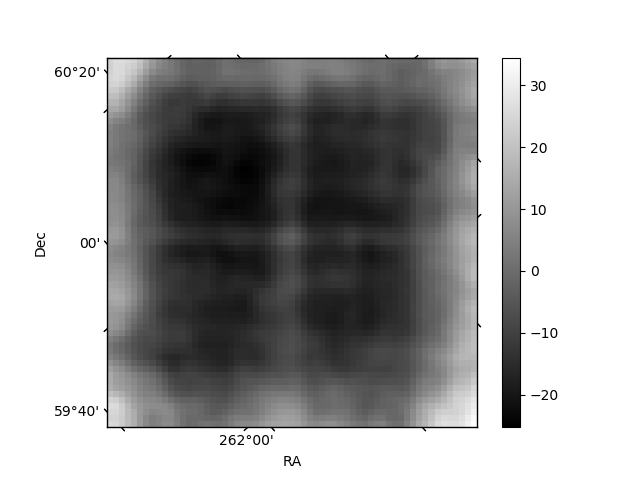
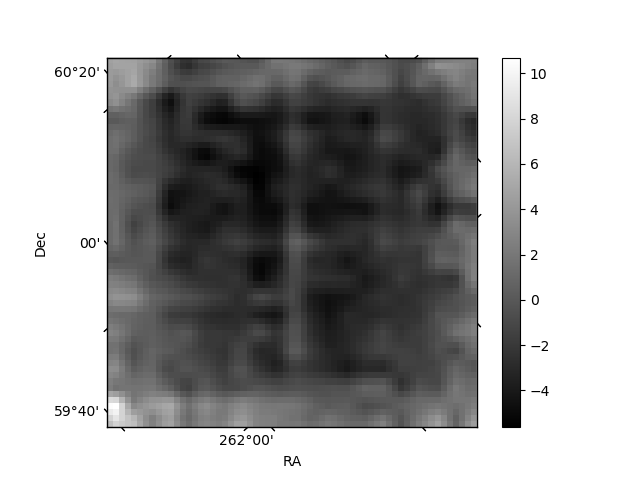
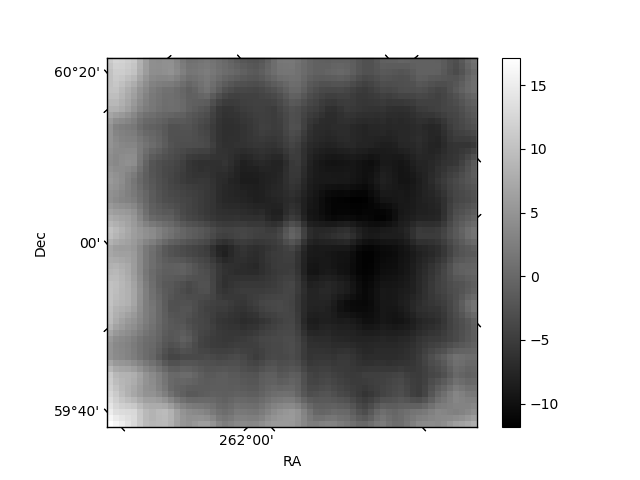
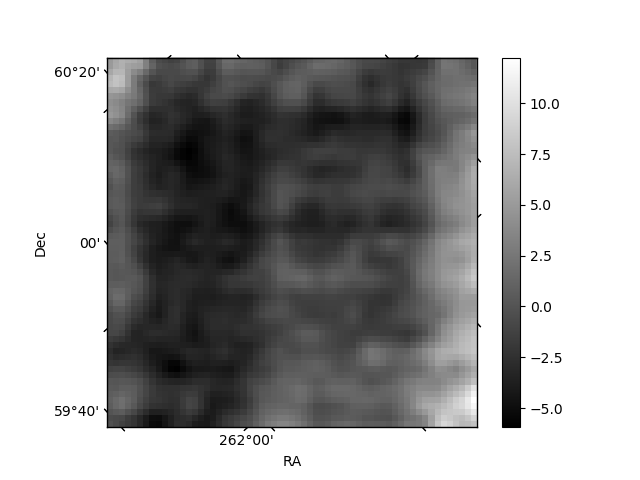
Histogram calculated using DETX and DETY for each event in the final _common_clean file
| Quadrant A | 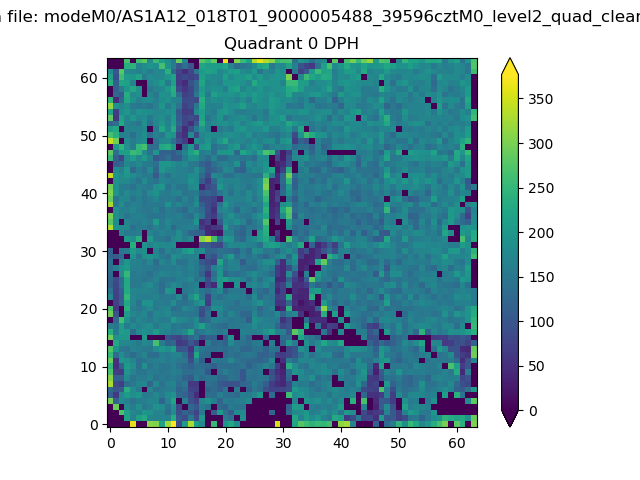 |
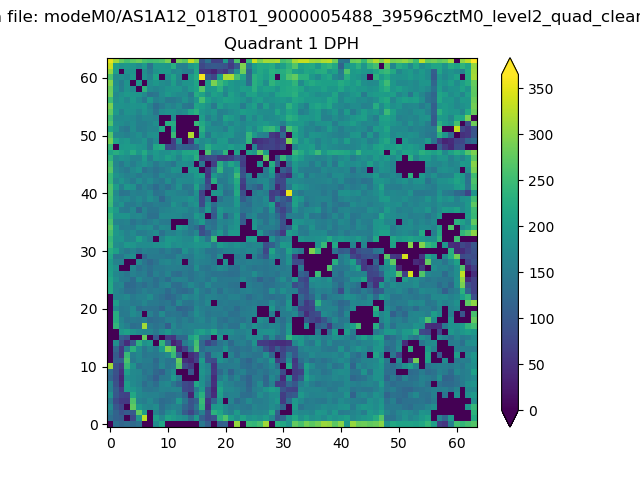 |
Quadrant B |
|---|---|---|---|
| Quadrant D | 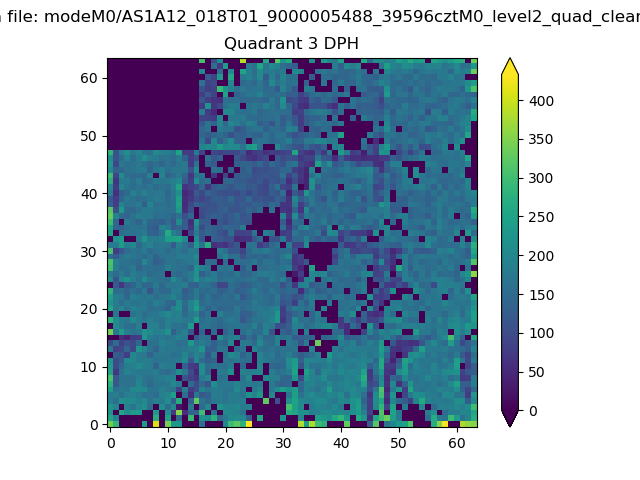 |
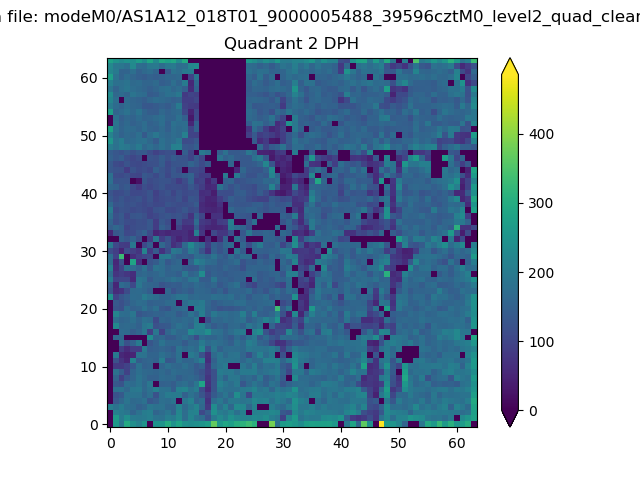 |
Quadrant C |
| Plot type | Count rate plots | Images |
|---|---|---|
| Comparison with Poisson distribution Blue bars denote a histogram of data divided into 1 sec bins. Red curve is a Poisson curve with rate = median count rate of data. |
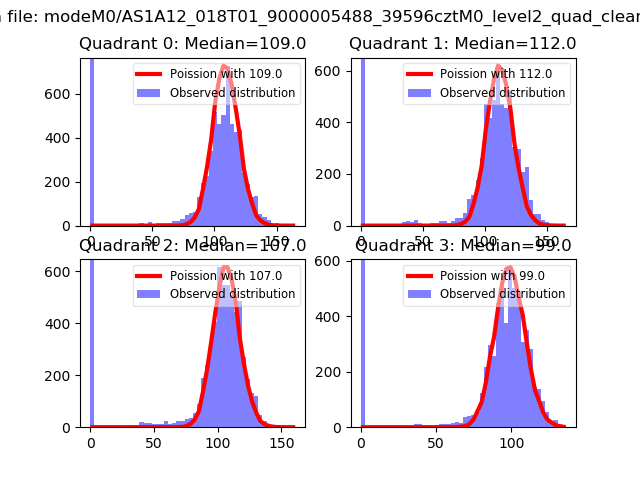 |
 |
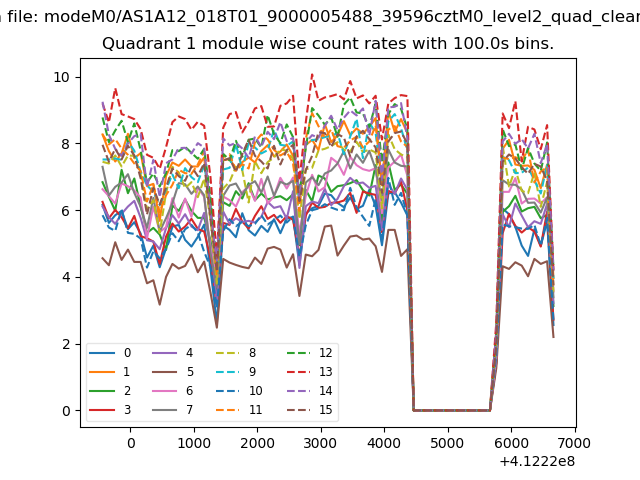
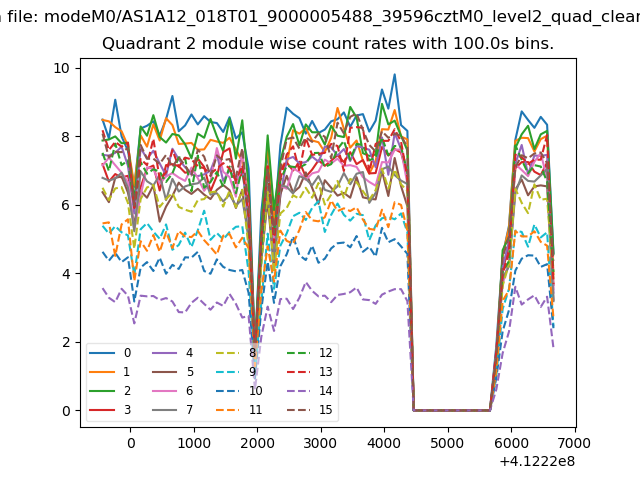
| Quadrant-wise count rates Data is divided into 100 sec bins |
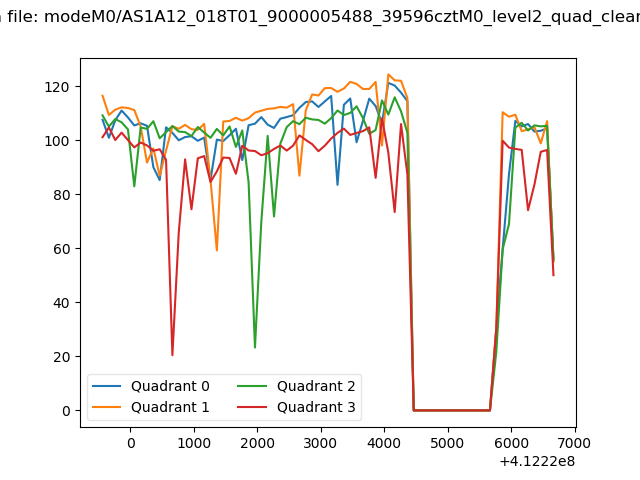 |
|
| Module-wise count rates for Quadrant A Data is divided into 100 sec bins |
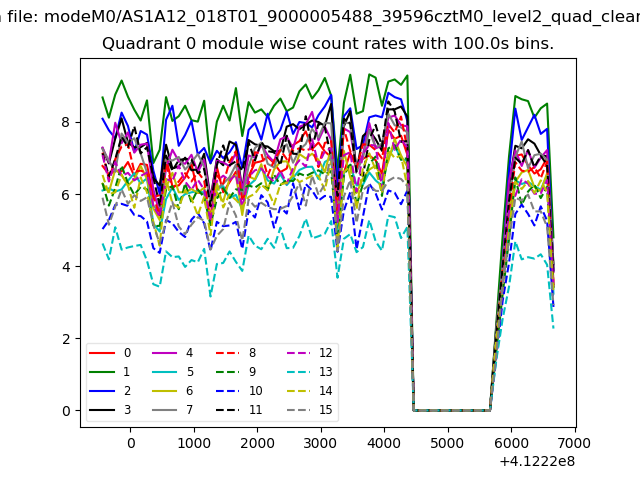 |
 |
| Module-wise count rates for Quadrant B Data is divided into 100 sec bins |
 |
 |
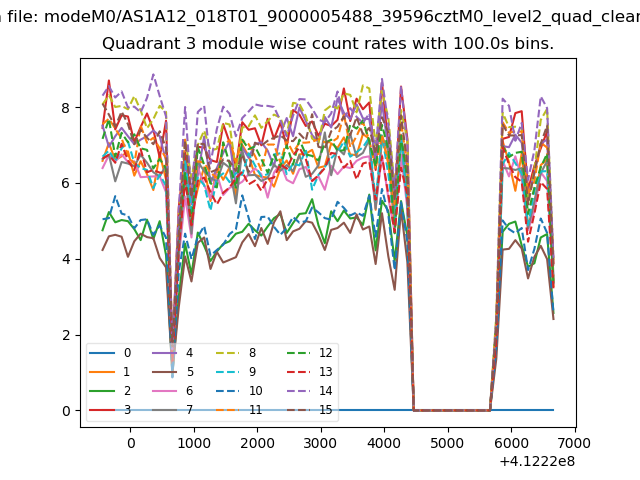
| Module-wise count rates for Quadrant C Data is divided into 100 sec bins |
 |
 |
| Module-wise count rates for Quadrant D Data is divided into 100 sec bins |
 |
 |
| Parameter | Plot |
|---|---|
| CZT HV Monitor | 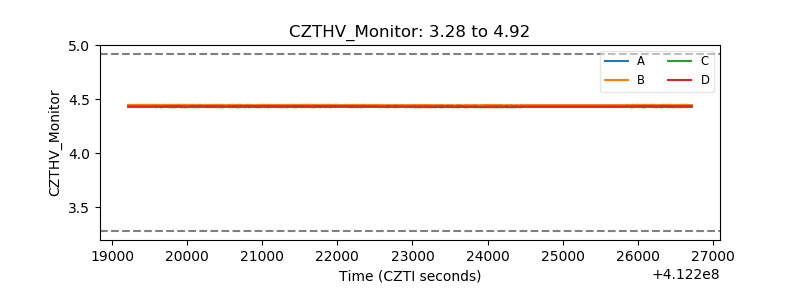 |
| D_VDD | 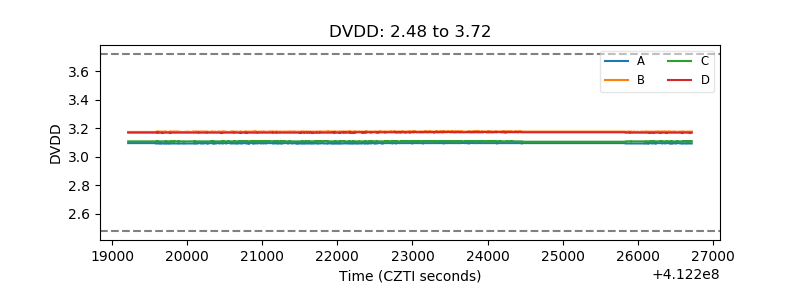 |
| Temperature 1 | 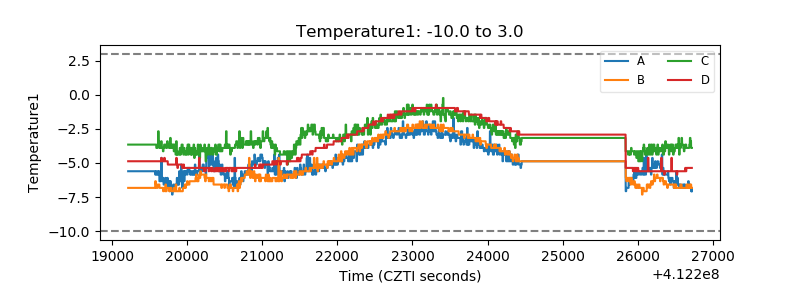 |
| Veto HV Monitor | 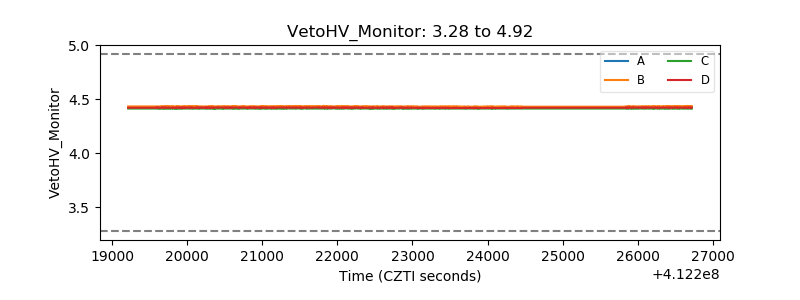 |
| Veto LLD | 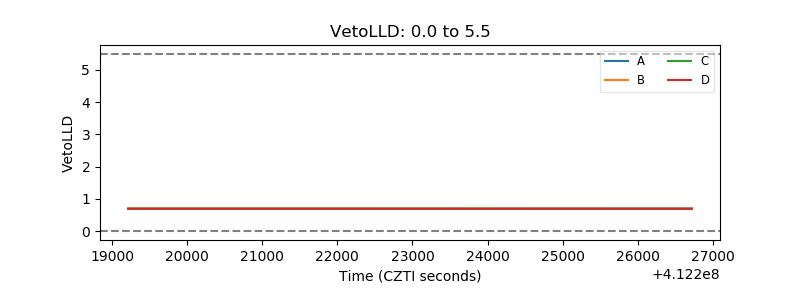 |
| Alpha Counter |  |
| _CPM_Rate | 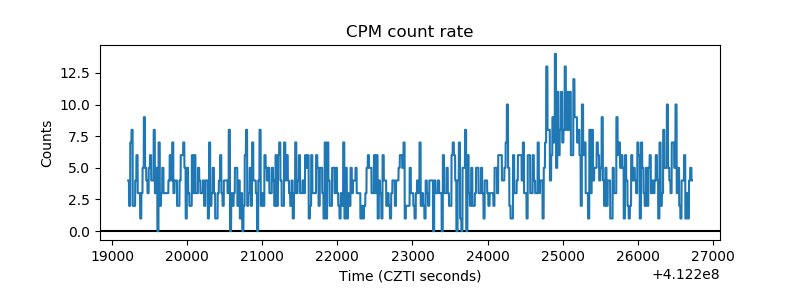 |
| CZT Counter | 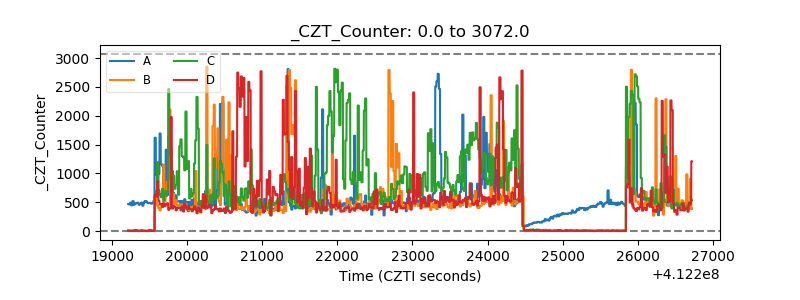 |
| +2.5 Volts monitor | 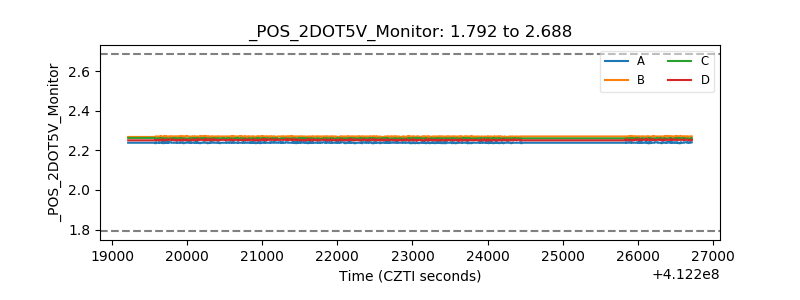 |
| +5 Volts monitor | 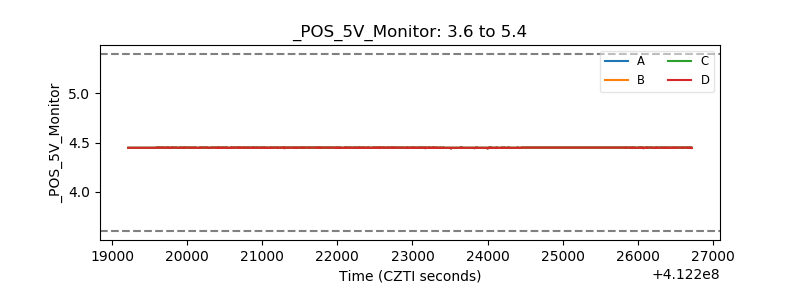 |
| _ROLL_ROT | 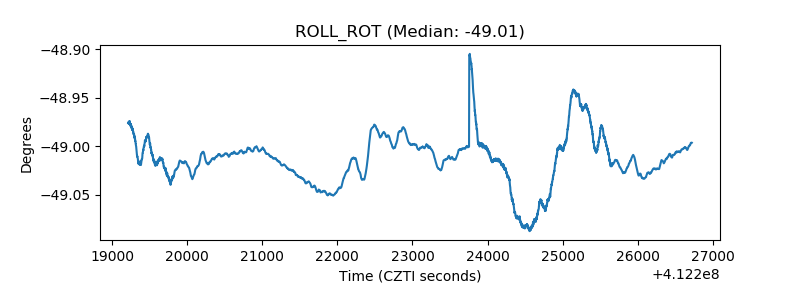 |
| _Roll_DEC | 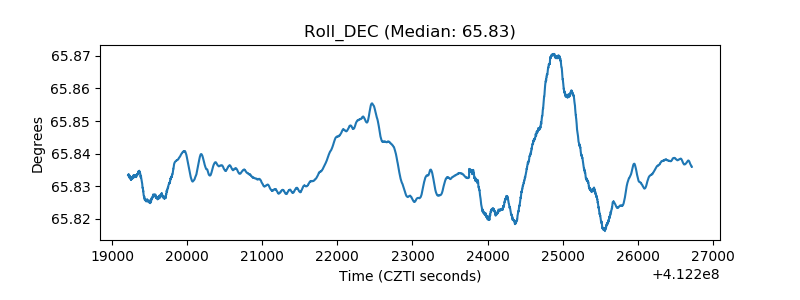 |
| _Roll_RA | 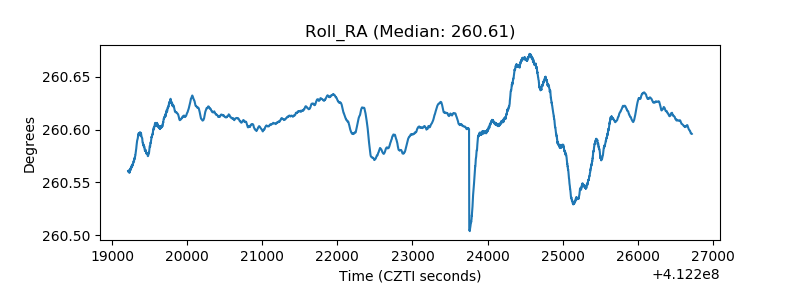 |
| Veto Counter | 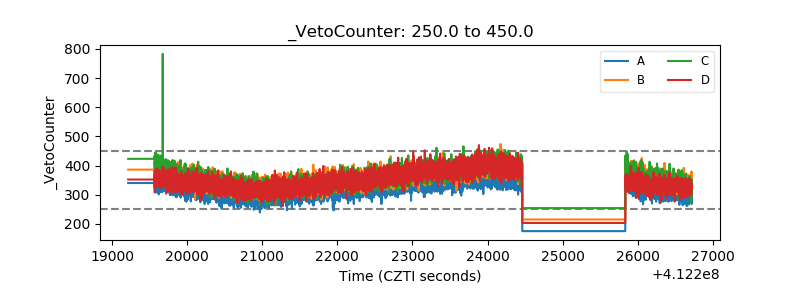 |