| Param | Original file | Final file |
|---|---|---|
| Filename | modeM0/AS1A12_018T01_9000005488_39597cztM0_level2.fits | modeM0/AS1A12_018T01_9000005488_39597cztM0_level2_quad_clean.evt |
| Size (bytes) | 469,198,080 | 96,053,760 |
| Size | 447.5 MB | 91.6 MB |
| Events in quadrant A | 4,064,736 | 633,105 |
| Events in quadrant B | 3,064,926 | 669,688 |
| Events in quadrant C | 6,412,974 | 600,542 |
| Events in quadrant D | 3,354,870 | 581,375 |
| Mode SS | |||
|---|---|---|---|
| Quadrant | BADHDUFLAG | Total packets | Discarded packets |
| A | 0 | 126 | 0 |
| B | 0 | 126 | 0 |
| C | 0 | 126 | 0 |
| D | 0 | 126 | 0 |
| Mode M0 | |||
|---|---|---|---|
| Quadrant | BADHDUFLAG | Total packets | Discarded packets |
| A | 0 | 15832 | 3 |
| B | 0 | 13457 | 2 |
| C | 0 | 23314 | 2 |
| D | 0 | 14477 | 2 |
| Mode M9 | |||
|---|---|---|---|
| Quadrant | BADHDUFLAG | Total packets | Discarded packets |
| A | 0 | 26 | 0 |
| B | 0 | 26 | 0 |
| C | 0 | 26 | 0 |
| D | 0 | 26 | 0 |
| Quadrant | Total seconds | Saturated seconds | Saturation percentage |
|---|---|---|---|
| A | 6062 | 306 | 5.047839% |
| B | 6062 | 95 | 1.567140% |
| C | 6062 | 604 | 9.963708% |
| D | 6062 | 177 | 2.919828% |
Noise dominated data is calculated using 1-second bins in cleaned event files. If a bin has >2000 counts, and if more than 50% of those come from <1% of pixels, then it is considered to be noise-dominated and hence unusable.
| Quadrant | # 1 sec bins | Bins with >0 counts | Bins with >2000 counts | High rate bins dominated by noise | Noise dominated (total time) | Noise dominated (detector-on time) | Marked lightcurve |
|---|---|---|---|---|---|---|---|
| A | 8716 | 6064 | 273 | 273 | 3.13% | 4.50% | 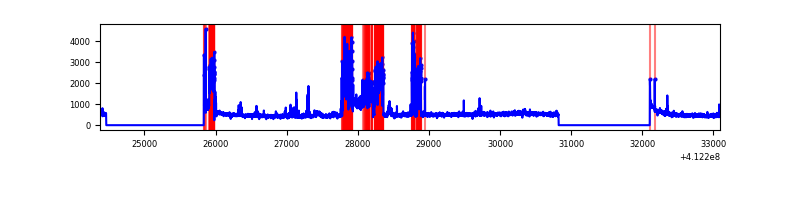 |
| B | 8716 | 6064 | 56 | 56 | 0.64% | 0.92% | 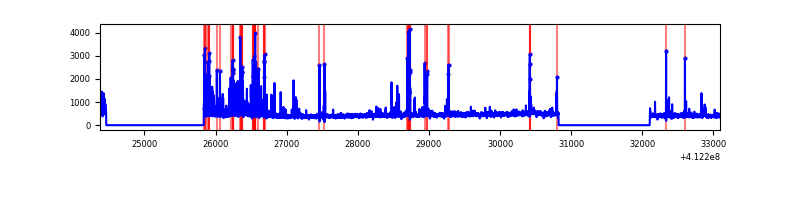 |
| C | 8716 | 6064 | 592 | 592 | 6.79% | 9.76% | 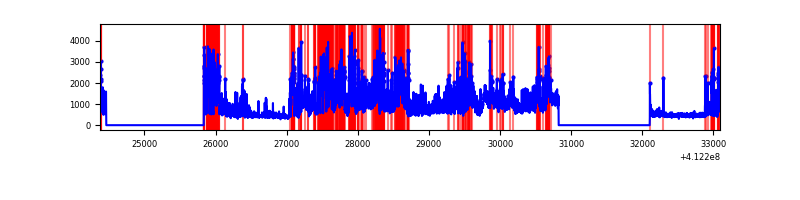 |
| D | 8716 | 6064 | 137 | 137 | 1.57% | 2.26% | 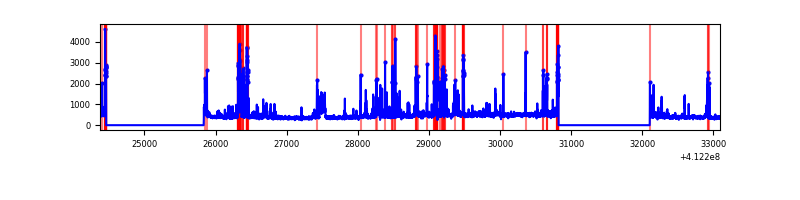 |
Top three noisy pixels from each quadrant. If the there are fewer than three noisy pixels in the level2.evt file, extra rows are filled as -1
| Pixel properties | Quadrant properties | ||||||
|---|---|---|---|---|---|---|---|
| Quadrant | DetID | PixID | Counts | Sigma | Mean | Median | Sigma |
| A | 9 | 143 | 1092332 | 8394.73 | 636 | 623 | 130.0 |
| A | 10 | 83 | 467351 | 3588.92 | 636 | 623 | 130.0 |
| A | 15 | 222 | 29768 | 224.11 | 636 | 623 | 130.0 |
| B | 5 | 255 | 388210 | 3167.06 | 639 | 620 | 122.4 |
| B | 5 | 172 | 139291 | 1133.1 | 639 | 620 | 122.4 |
| B | 0 | 230 | 18229 | 143.89 | 639 | 620 | 122.4 |
| C | 9 | 187 | 2180077 | 15152.78 | 612 | 614 | 143.8 |
| C | 15 | 208 | 1566870 | 10889.44 | 612 | 614 | 143.8 |
| C | 15 | 214 | 262441 | 1820.36 | 612 | 614 | 143.8 |
| D | 13 | 171 | 501237 | 3294.27 | 621 | 603 | 152.0 |
| D | 13 | 174 | 120751 | 790.6 | 621 | 603 | 152.0 |
| D | 2 | 249 | 109765 | 718.31 | 621 | 603 | 152.0 |
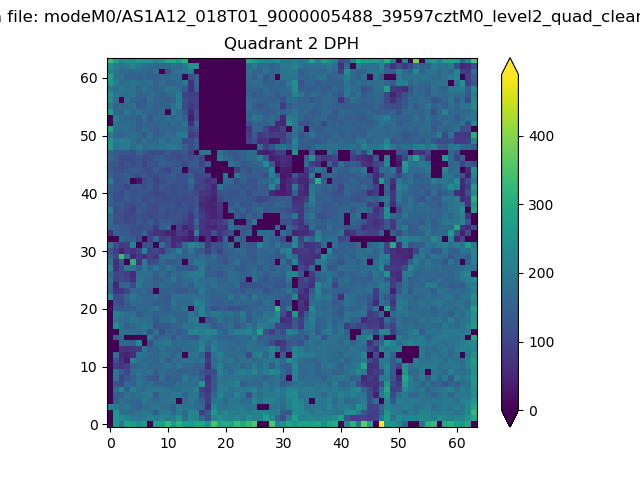
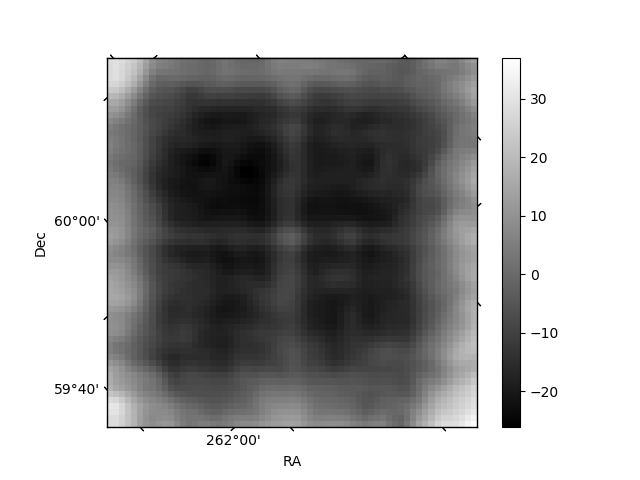
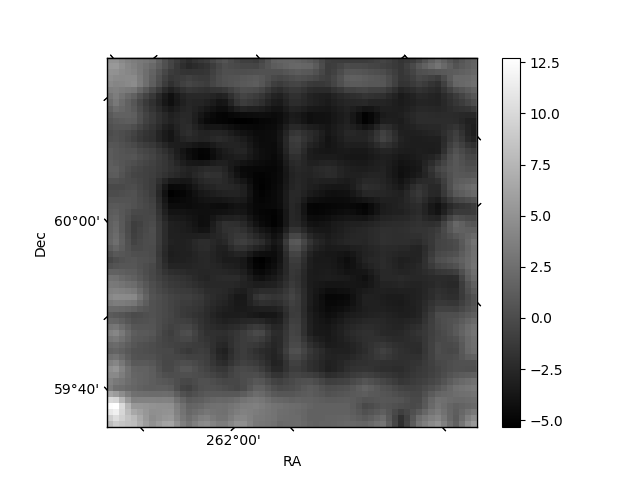
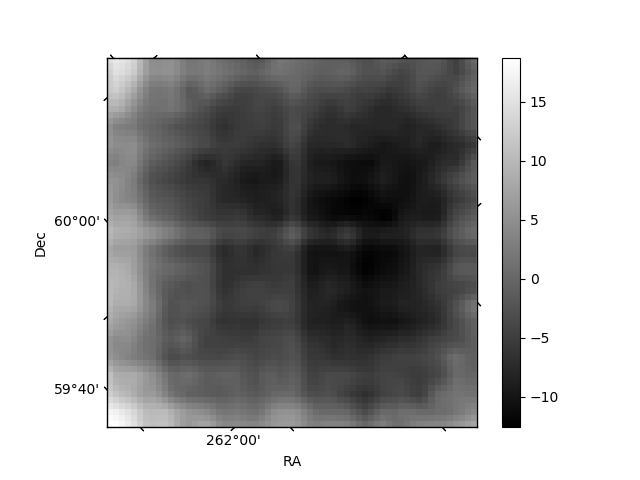
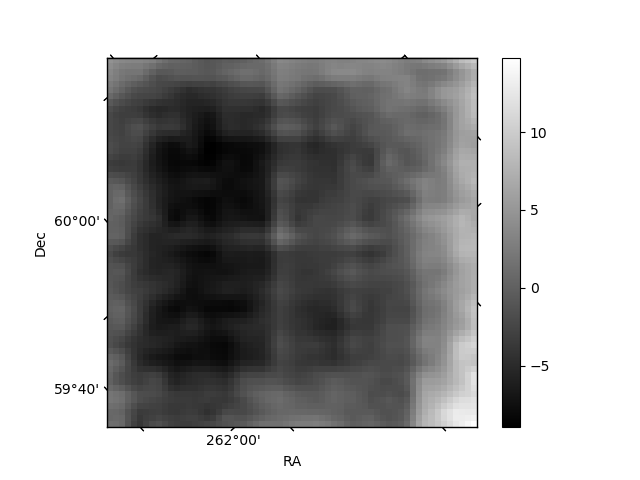
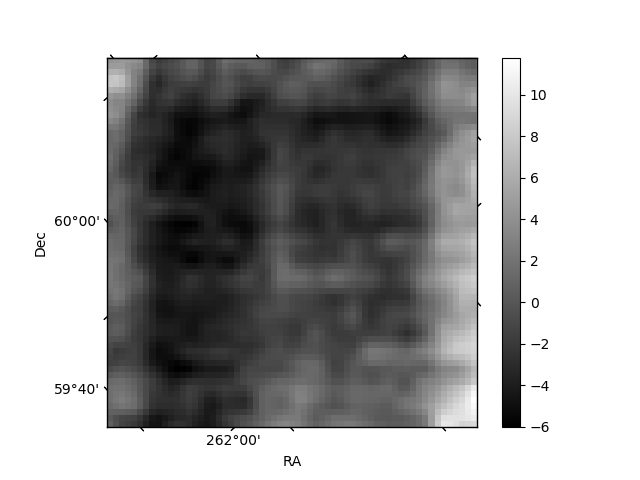
Histogram calculated using DETX and DETY for each event in the final _common_clean file
| Quadrant A | 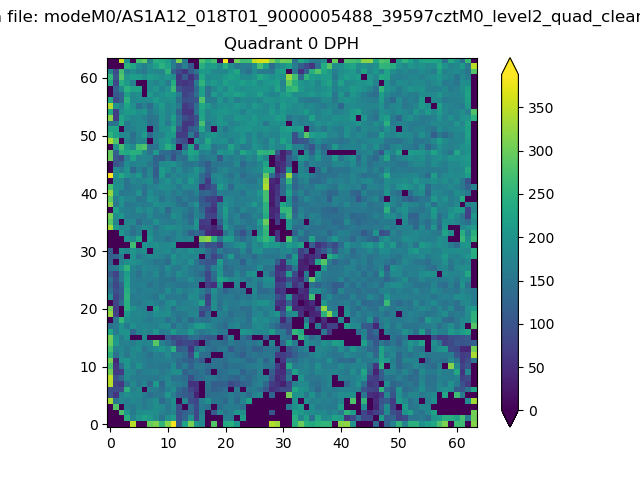 |
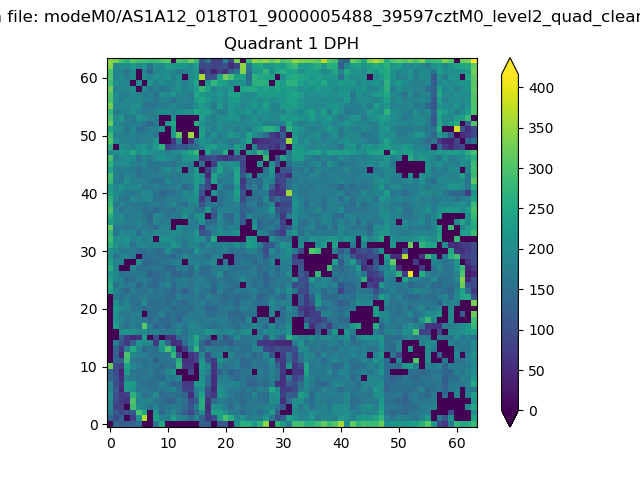 |
Quadrant B |
|---|---|---|---|
| Quadrant D | 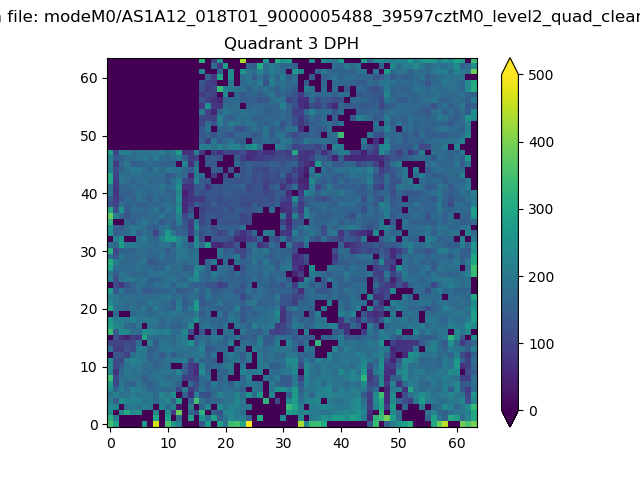 |
 |
Quadrant C |
| Plot type | Count rate plots | Images |
|---|---|---|
| Comparison with Poisson distribution Blue bars denote a histogram of data divided into 1 sec bins. Red curve is a Poisson curve with rate = median count rate of data. |
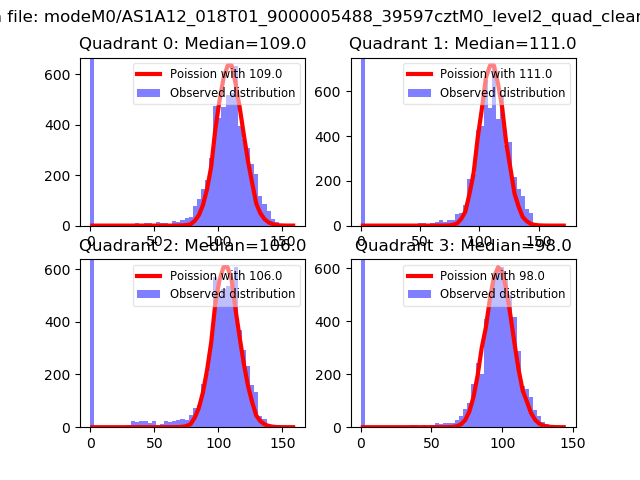 |
 |
| Quadrant-wise count rates Data is divided into 100 sec bins |
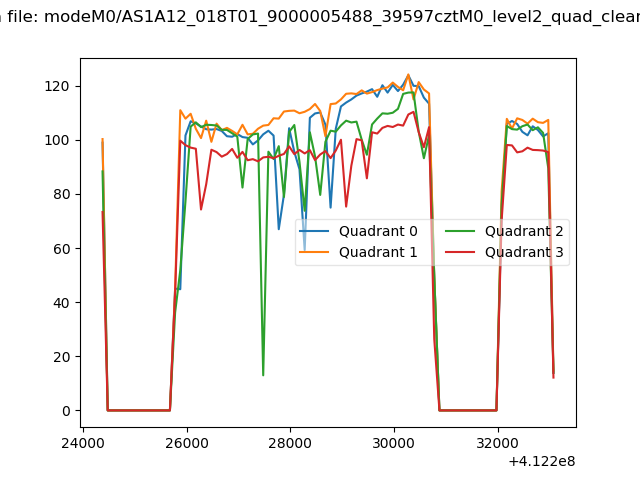 |
|
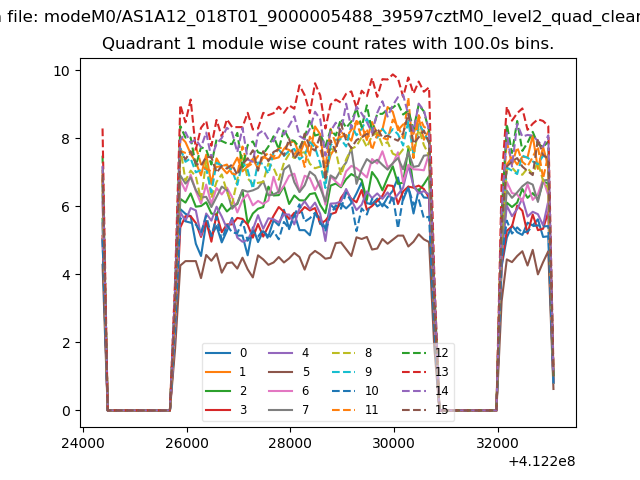
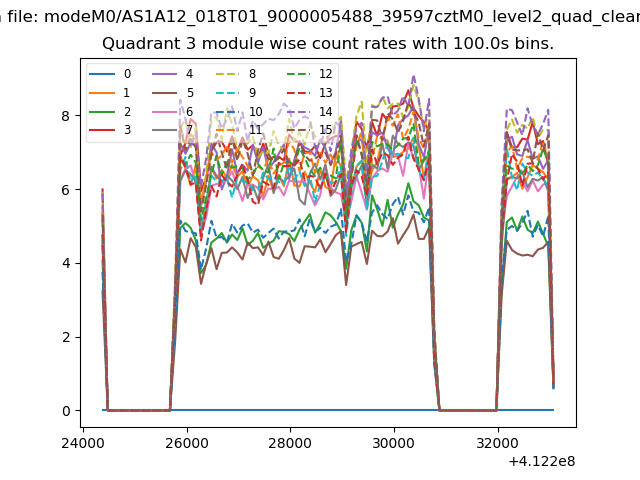
| Module-wise count rates for Quadrant A Data is divided into 100 sec bins |
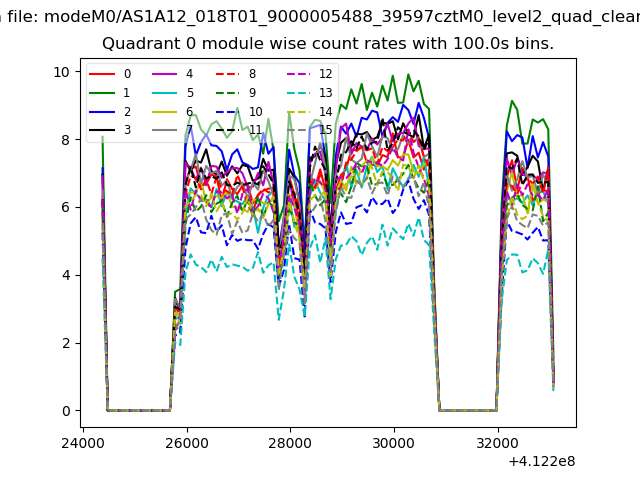 |
 |
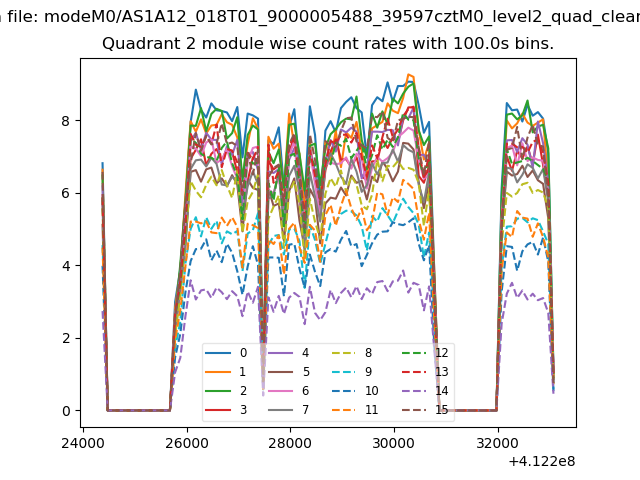
| Module-wise count rates for Quadrant B Data is divided into 100 sec bins |
 |
 |
| Module-wise count rates for Quadrant C Data is divided into 100 sec bins |
 |
 |
| Module-wise count rates for Quadrant D Data is divided into 100 sec bins |
 |
 |
| Parameter | Plot |
|---|---|
| CZT HV Monitor | 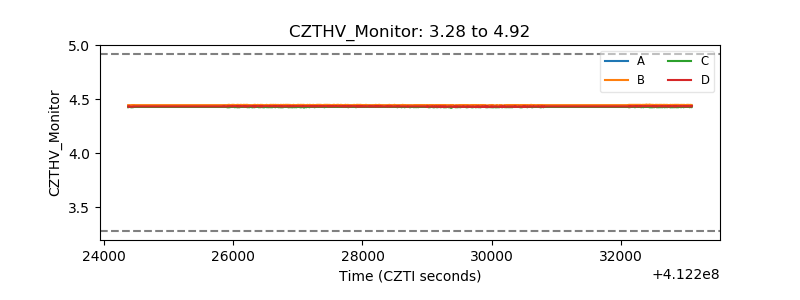 |
| D_VDD | 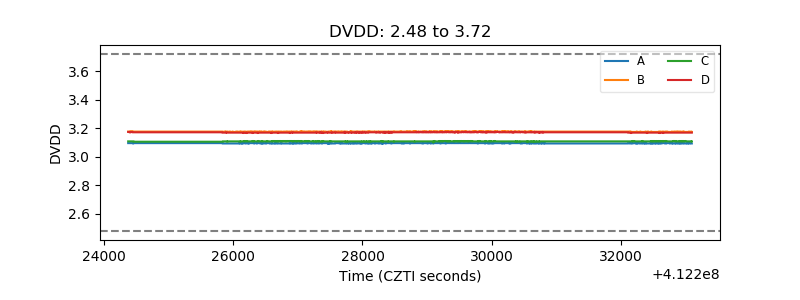 |
| Temperature 1 | 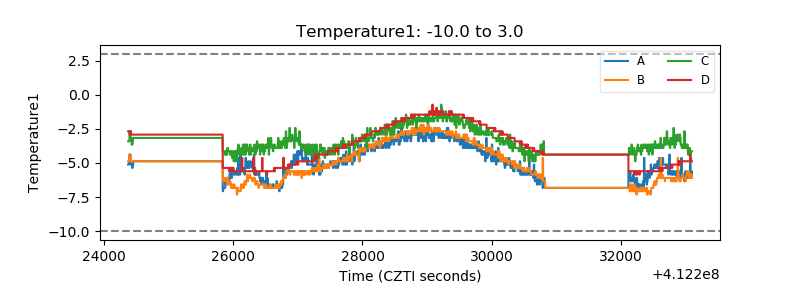 |
| Veto HV Monitor | 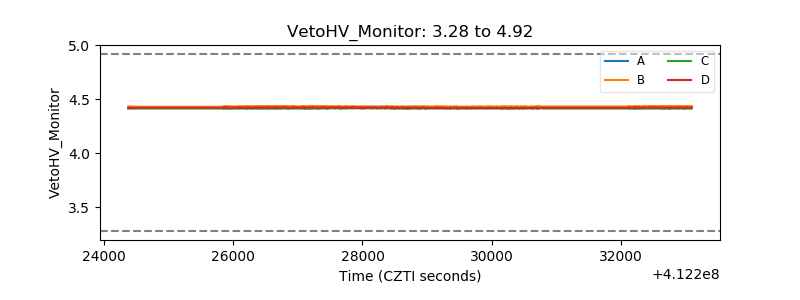 |
| Veto LLD | 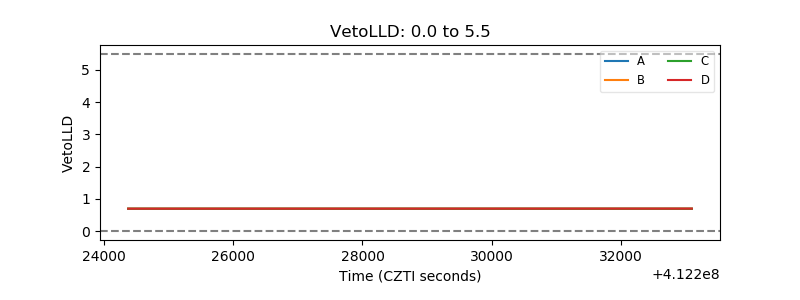 |
| Alpha Counter | 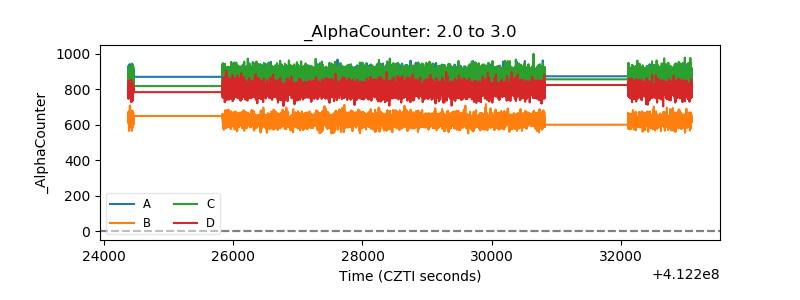 |
| _CPM_Rate | 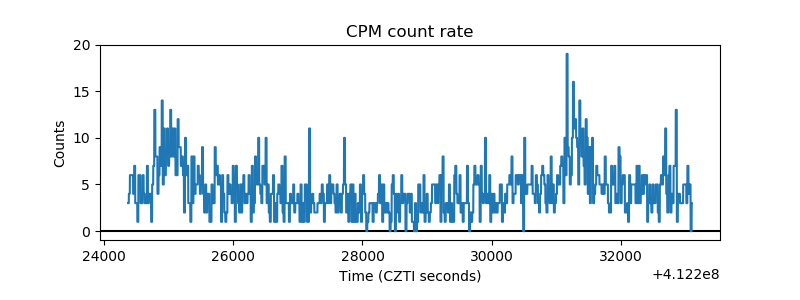 |
| CZT Counter | 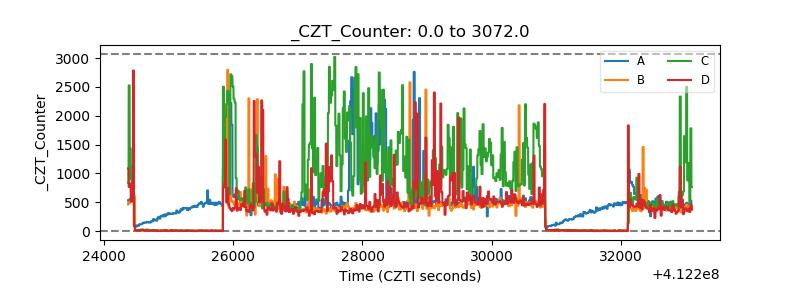 |
| +2.5 Volts monitor | 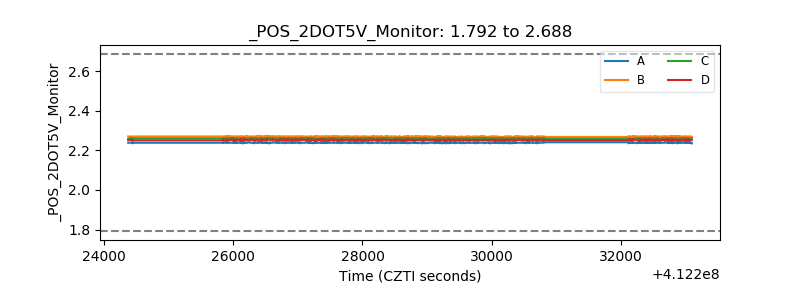 |
| +5 Volts monitor | 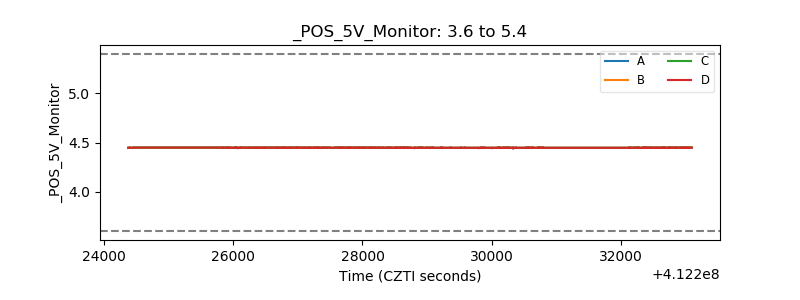 |
| _ROLL_ROT | 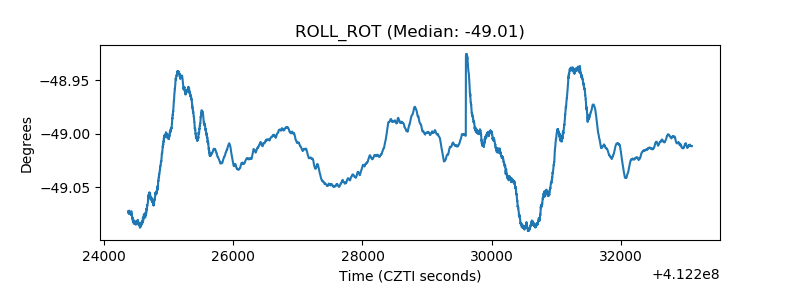 |
| _Roll_DEC | 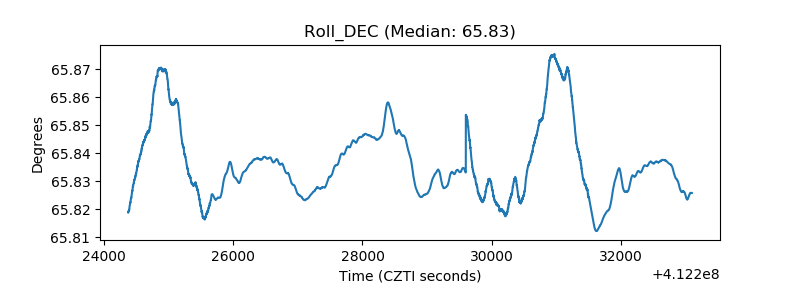 |
| _Roll_RA | 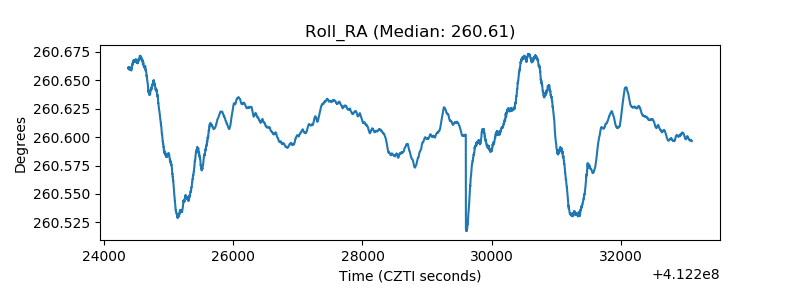 |
| Veto Counter | 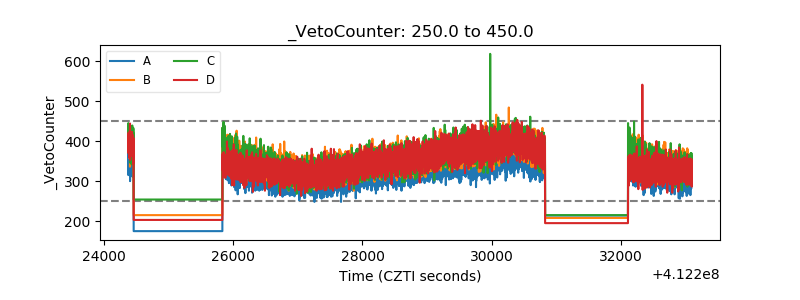 |