| Param | Original file | Final file |
|---|---|---|
| Filename | modeM0/AS1A12_018T01_9000005488_39600cztM0_level2.fits | modeM0/AS1A12_018T01_9000005488_39600cztM0_level2_quad_clean.evt |
| Size (bytes) | 1,122,261,120 | 244,546,560 |
| Size | 1.0 GB | 233.2 MB |
| Events in quadrant A | 8,276,553 | 1,682,471 |
| Events in quadrant B | 7,059,041 | 1,728,360 |
| Events in quadrant C | 14,893,387 | 1,514,702 |
| Events in quadrant D | 10,108,014 | 1,403,505 |
| Mode SS | |||
|---|---|---|---|
| Quadrant | BADHDUFLAG | Total packets | Discarded packets |
| A | 0 | 318 | 0 |
| B | 0 | 318 | 0 |
| C | 0 | 318 | 0 |
| D | 0 | 318 | 0 |
| Mode M0 | |||
|---|---|---|---|
| Quadrant | BADHDUFLAG | Total packets | Discarded packets |
| A | 0 | 33853 | 4 |
| B | 0 | 32325 | 3 |
| C | 0 | 54873 | 3 |
| D | 0 | 41223 | 3 |
| Mode M9 | |||
|---|---|---|---|
| Quadrant | BADHDUFLAG | Total packets | Discarded packets |
| A | 0 | 43 | 0 |
| B | 0 | 43 | 0 |
| C | 0 | 43 | 0 |
| D | 0 | 44 | 0 |
| Quadrant | Total seconds | Saturated seconds | Saturation percentage |
|---|---|---|---|
| A | 15581 | 56 | 0.359412% |
| B | 15581 | 84 | 0.539118% |
| C | 15581 | 1399 | 8.978885% |
| D | 15581 | 1043 | 6.694050% |
Noise dominated data is calculated using 1-second bins in cleaned event files. If a bin has >2000 counts, and if more than 50% of those come from <1% of pixels, then it is considered to be noise-dominated and hence unusable.
| Quadrant | # 1 sec bins | Bins with >0 counts | Bins with >2000 counts | High rate bins dominated by noise | Noise dominated (total time) | Noise dominated (detector-on time) | Marked lightcurve |
|---|---|---|---|---|---|---|---|
| A | 19819 | 15584 | 36 | 36 | 0.18% | 0.23% | 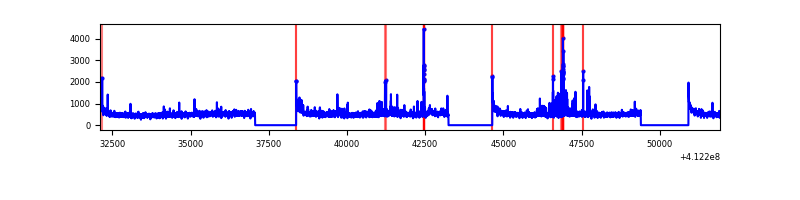 |
| B | 19819 | 15584 | 37 | 37 | 0.19% | 0.24% | 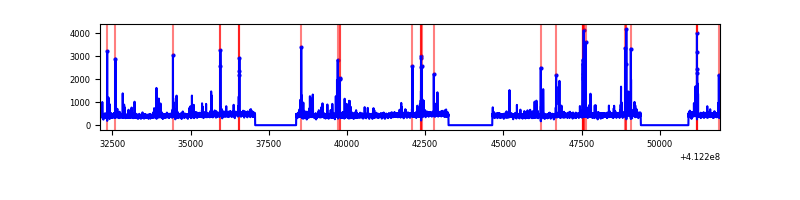 |
| C | 19819 | 15584 | 1290 | 1290 | 6.51% | 8.28% | 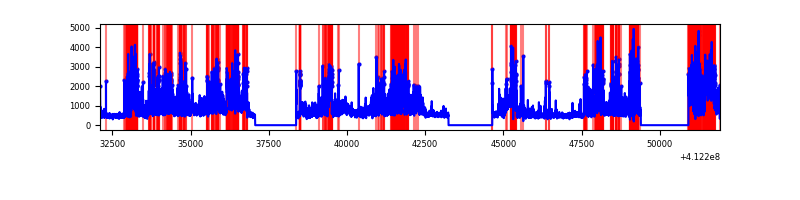 |
| D | 19819 | 15584 | 877 | 877 | 4.43% | 5.63% | 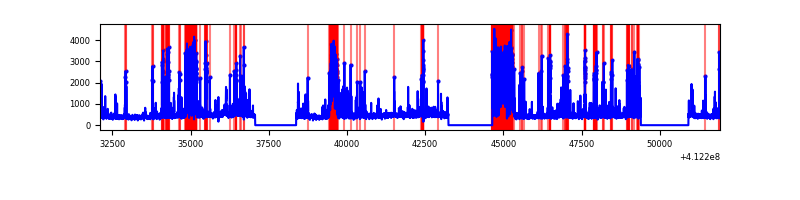 |
Top three noisy pixels from each quadrant. If the there are fewer than three noisy pixels in the level2.evt file, extra rows are filled as -1
| Pixel properties | Quadrant properties | ||||||
|---|---|---|---|---|---|---|---|
| Quadrant | DetID | PixID | Counts | Sigma | Mean | Median | Sigma |
| A | 10 | 83 | 1102301 | 3237.4 | 1685 | 1650 | 340.0 |
| A | 15 | 222 | 368373 | 1078.66 | 1685 | 1650 | 340.0 |
| A | 13 | 248 | 206613 | 602.87 | 1685 | 1650 | 340.0 |
| B | 5 | 255 | 420418 | 1305.21 | 1671 | 1621 | 320.9 |
| B | 12 | 111 | 41096 | 123.03 | 1671 | 1621 | 320.9 |
| B | 11 | 111 | 38655 | 115.42 | 1671 | 1621 | 320.9 |
| C | 9 | 187 | 5454906 | 14764.91 | 1596 | 1602 | 369.3 |
| C | 15 | 208 | 2446645 | 6619.99 | 1596 | 1602 | 369.3 |
| C | 15 | 214 | 668106 | 1804.57 | 1596 | 1602 | 369.3 |
| D | 2 | 249 | 1391284 | 3532.91 | 1604 | 1556 | 393.4 |
| D | 13 | 171 | 1195715 | 3035.75 | 1604 | 1556 | 393.4 |
| D | 12 | 227 | 645568 | 1637.18 | 1604 | 1556 | 393.4 |
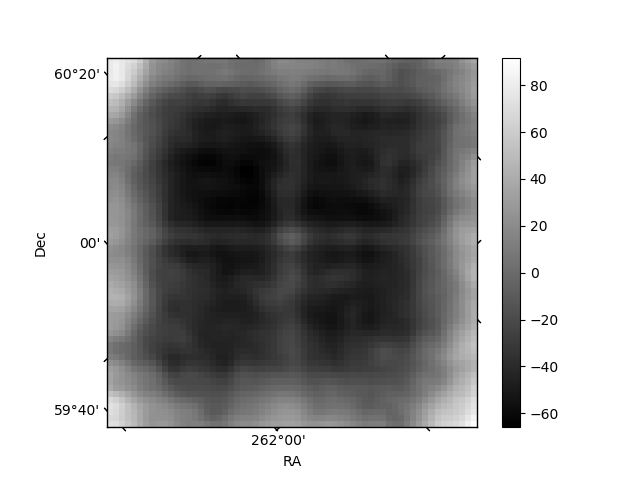
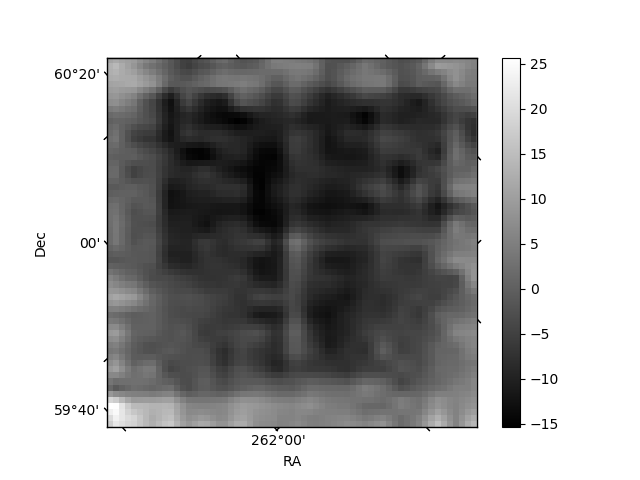
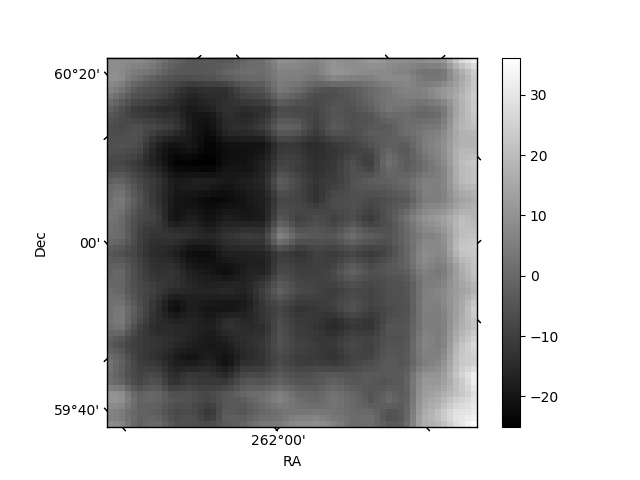
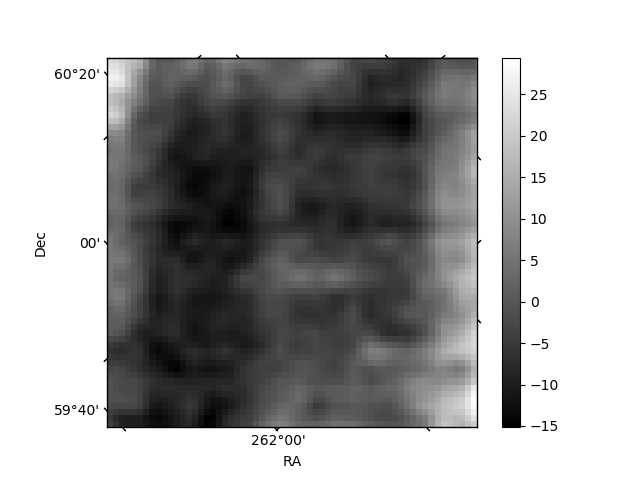
Histogram calculated using DETX and DETY for each event in the final _common_clean file
| Quadrant A | 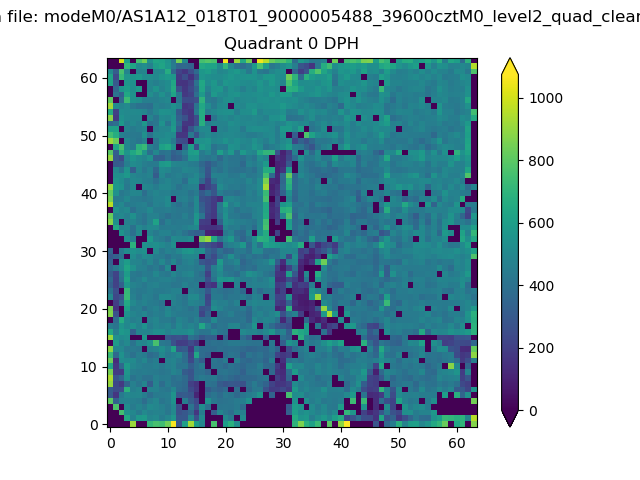 |
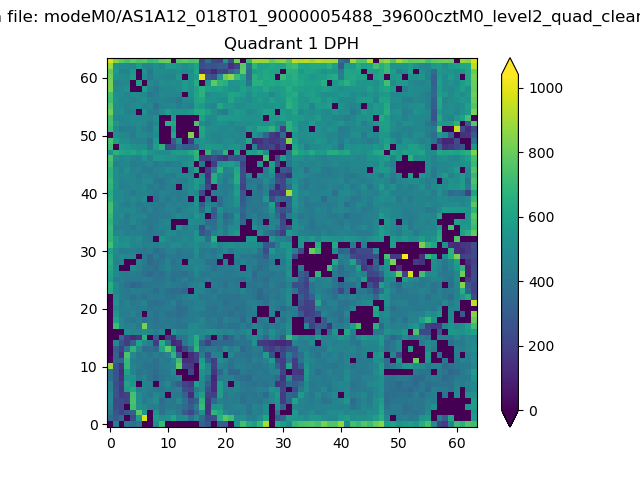 |
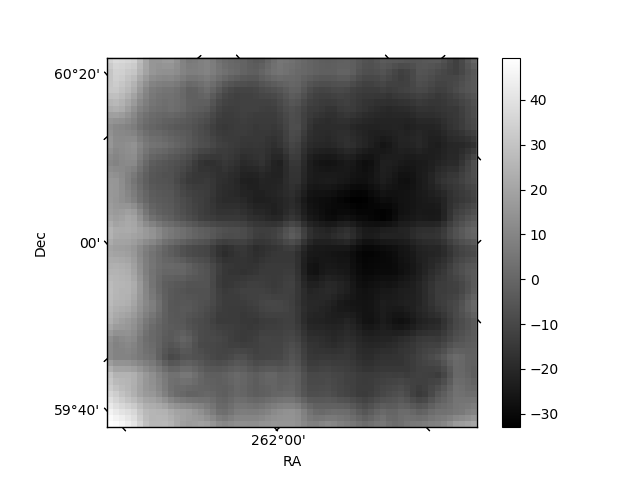
Quadrant B |
|---|---|---|---|
| Quadrant D | 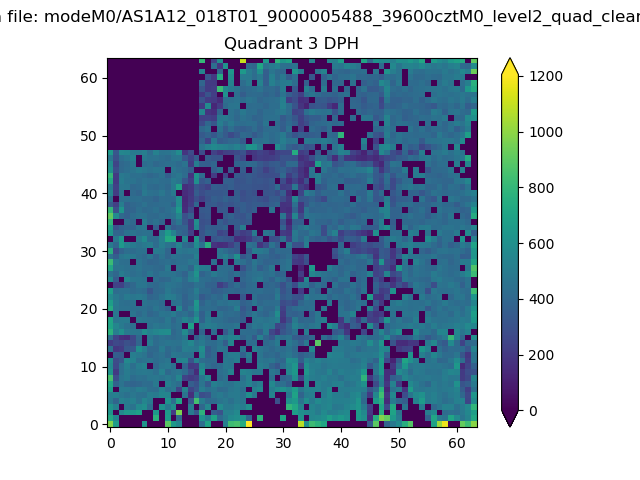 |
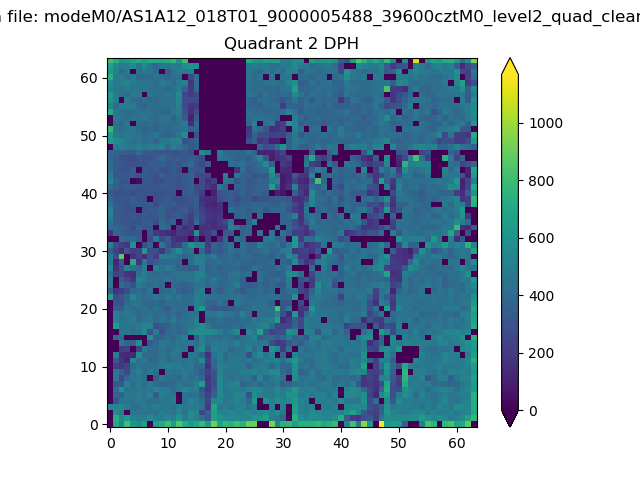 |
Quadrant C |
| Plot type | Count rate plots | Images |
|---|---|---|
| Comparison with Poisson distribution Blue bars denote a histogram of data divided into 1 sec bins. Red curve is a Poisson curve with rate = median count rate of data. |
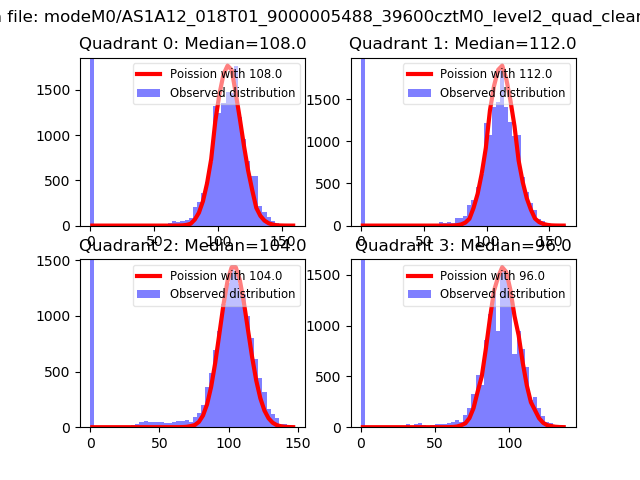 |
 |
| Quadrant-wise count rates Data is divided into 100 sec bins |
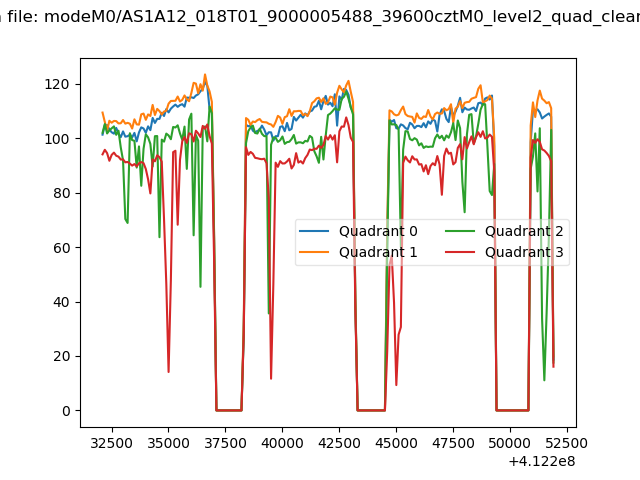 |
|
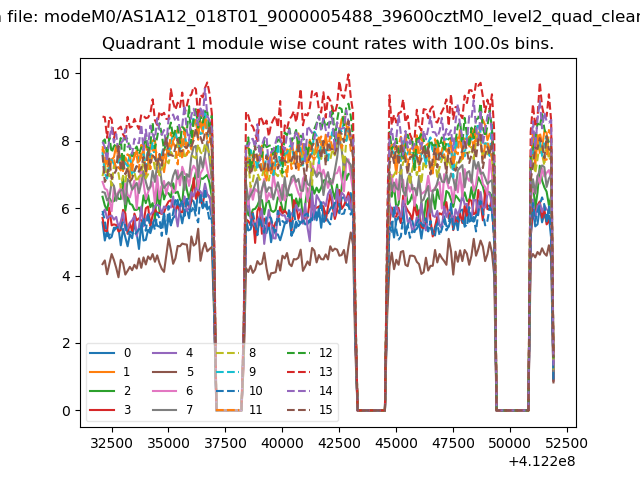
| Module-wise count rates for Quadrant A Data is divided into 100 sec bins |
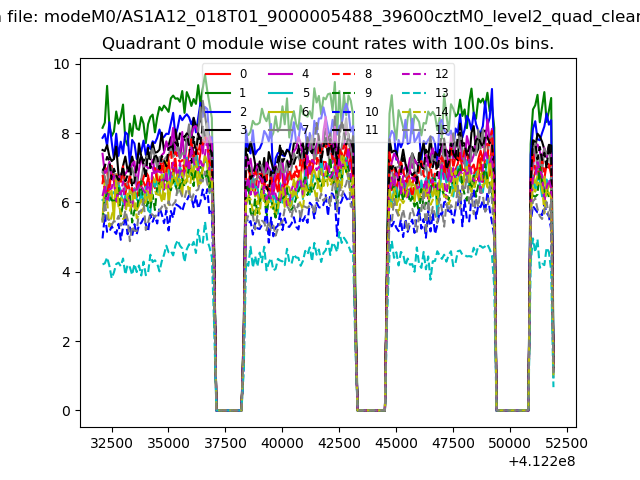 |
 |
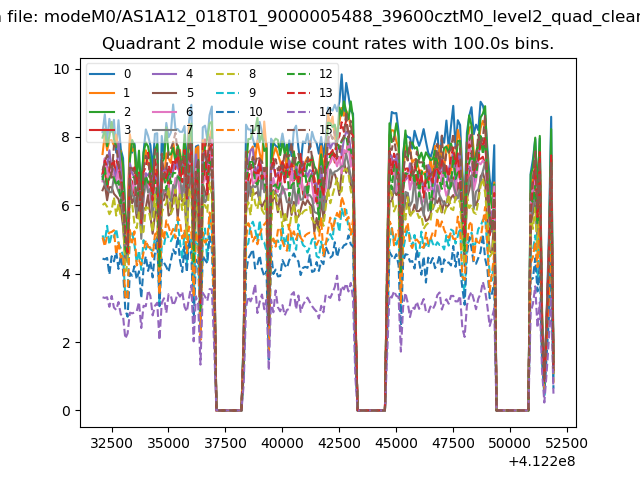
| Module-wise count rates for Quadrant B Data is divided into 100 sec bins |
 |
 |
| Module-wise count rates for Quadrant C Data is divided into 100 sec bins |
 |
 |
| Module-wise count rates for Quadrant D Data is divided into 100 sec bins |
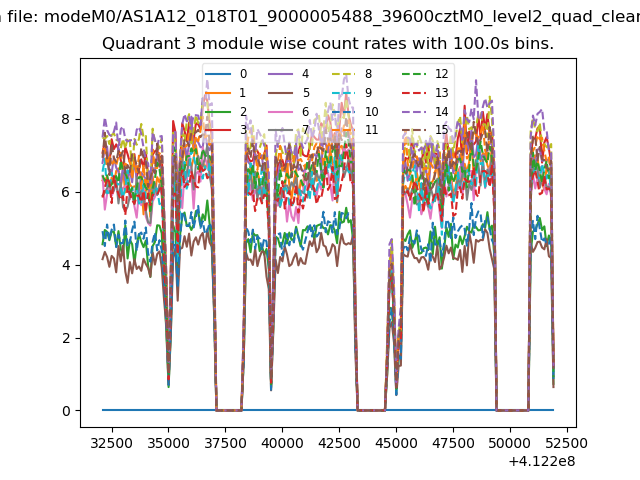 |
 |
| Parameter | Plot |
|---|---|
| CZT HV Monitor | 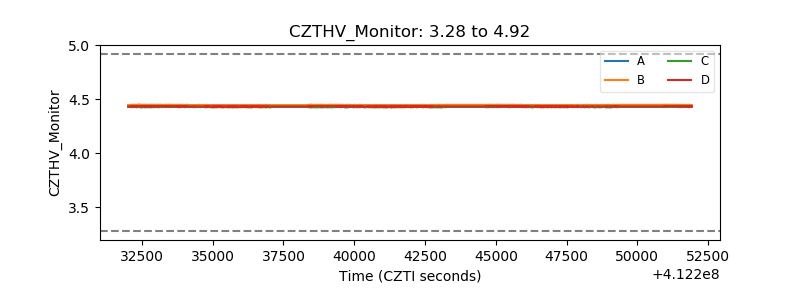 |
| D_VDD | 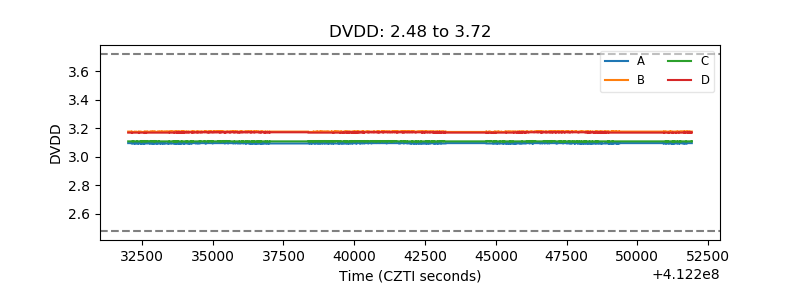 |
| Temperature 1 | 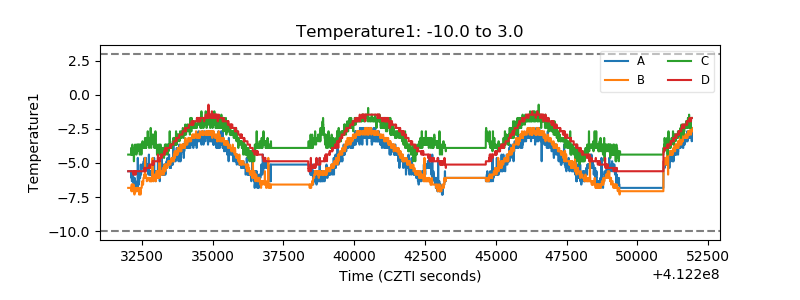 |
| Veto HV Monitor | 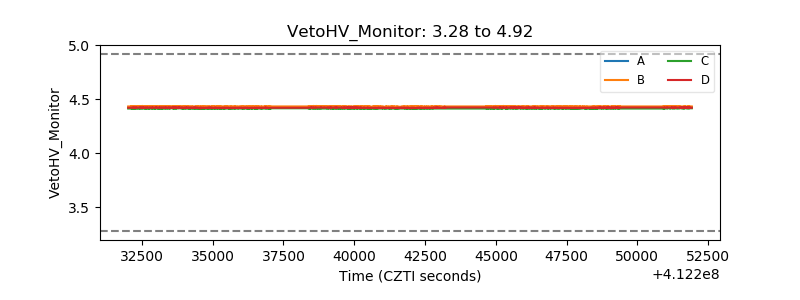 |
| Veto LLD | 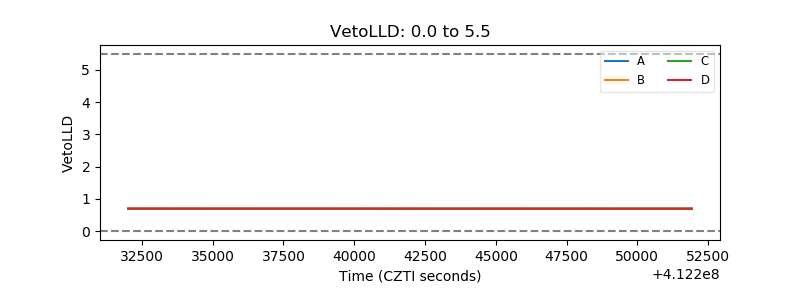 |
| Alpha Counter | 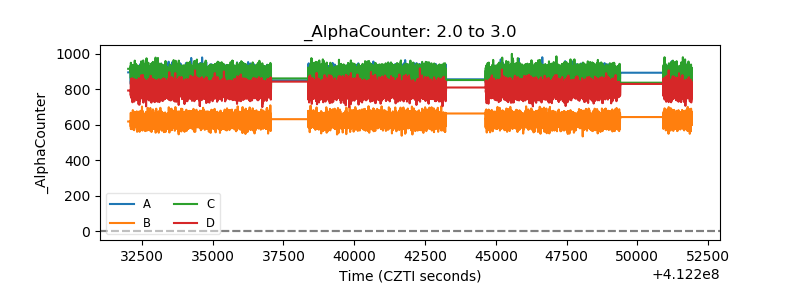 |
| _CPM_Rate | 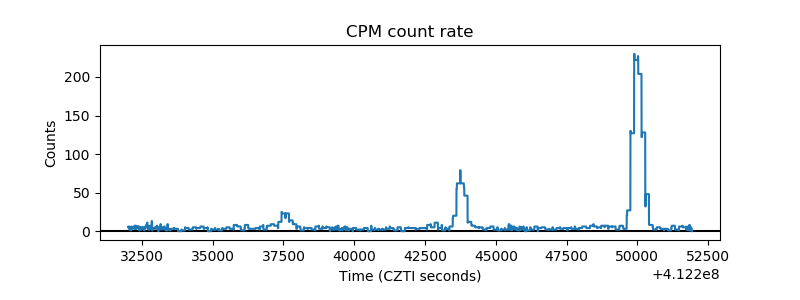 |
| CZT Counter | 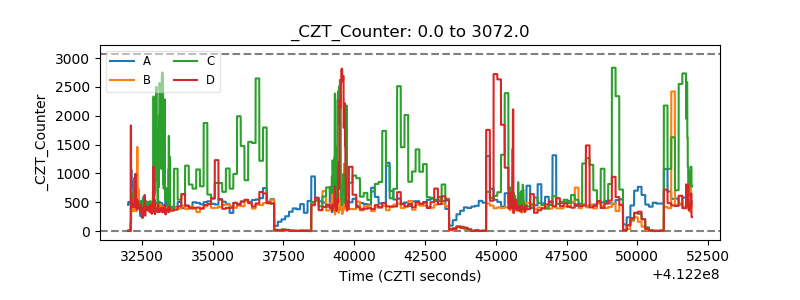 |
| +2.5 Volts monitor | 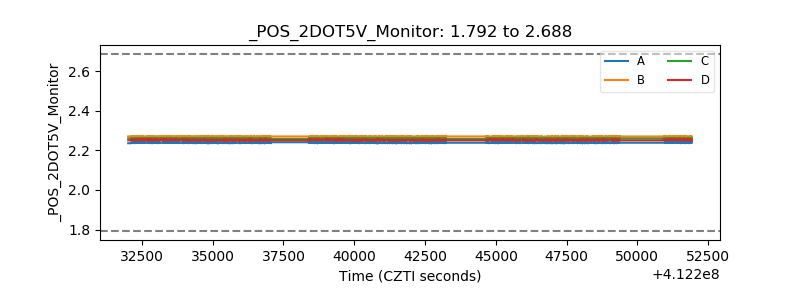 |
| +5 Volts monitor | 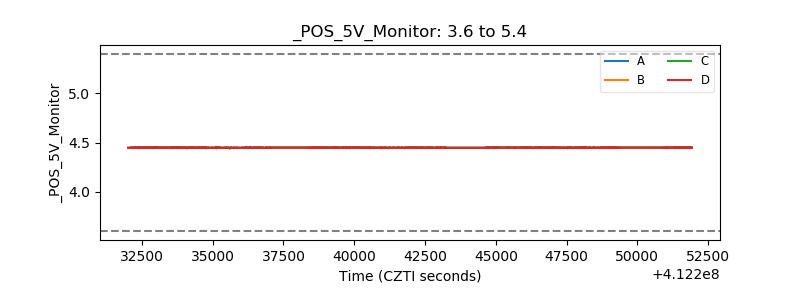 |
| _ROLL_ROT | 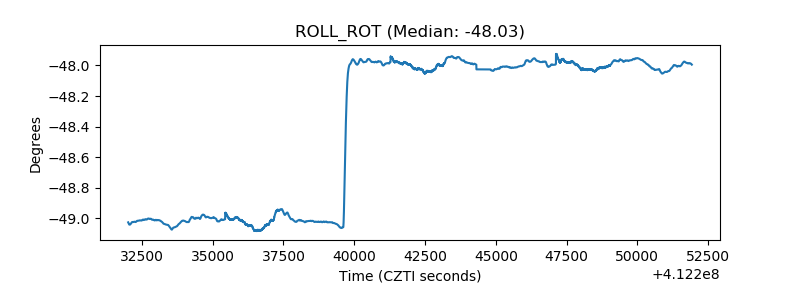 |
| _Roll_DEC | 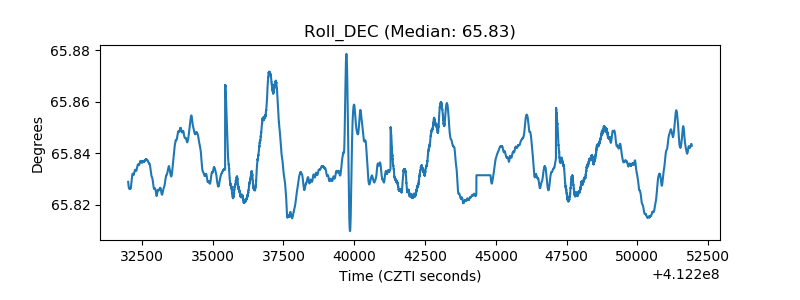 |
| _Roll_RA | 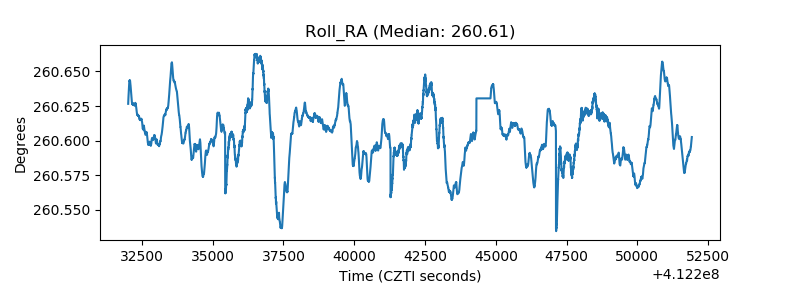 |
| Veto Counter | 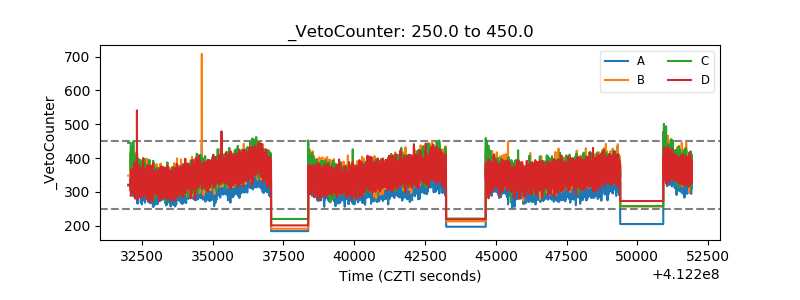 |