| Param | Original file | Final file |
|---|---|---|
| Filename | modeM0/AS1A12_018T01_9000005488_39603cztM0_level2.fits | modeM0/AS1A12_018T01_9000005488_39603cztM0_level2_quad_clean.evt |
| Size (bytes) | 382,109,760 | 89,147,520 |
| Size | 364.4 MB | 85.0 MB |
| Events in quadrant A | 2,717,088 | 616,327 |
| Events in quadrant B | 2,400,270 | 626,441 |
| Events in quadrant C | 4,814,118 | 563,202 |
| Events in quadrant D | 3,805,055 | 526,324 |
| Mode SS | |||
|---|---|---|---|
| Quadrant | BADHDUFLAG | Total packets | Discarded packets |
| A | 0 | 106 | 0 |
| B | 0 | 106 | 0 |
| C | 0 | 106 | 0 |
| D | 0 | 106 | 0 |
| Mode M0 | |||
|---|---|---|---|
| Quadrant | BADHDUFLAG | Total packets | Discarded packets |
| A | 0 | 11317 | 2 |
| B | 0 | 10791 | 1 |
| C | 0 | 17827 | 1 |
| D | 0 | 15001 | 1 |
| Mode M9 | |||
|---|---|---|---|
| Quadrant | BADHDUFLAG | Total packets | Discarded packets |
| A | 0 | 18 | 0 |
| B | 0 | 18 | 0 |
| C | 0 | 18 | 0 |
| D | 0 | 18 | 0 |
| Quadrant | Total seconds | Saturated seconds | Saturation percentage |
|---|---|---|---|
| A | 5244 | 9 | 0.171625% |
| B | 5244 | 19 | 0.362319% |
| C | 5244 | 315 | 6.006865% |
| D | 5244 | 327 | 6.235698% |
Noise dominated data is calculated using 1-second bins in cleaned event files. If a bin has >2000 counts, and if more than 50% of those come from <1% of pixels, then it is considered to be noise-dominated and hence unusable.
| Quadrant | # 1 sec bins | Bins with >0 counts | Bins with >2000 counts | High rate bins dominated by noise | Noise dominated (total time) | Noise dominated (detector-on time) | Marked lightcurve |
|---|---|---|---|---|---|---|---|
| A | 7037 | 5245 | 1 | 1 | 0.01% | 0.02% | 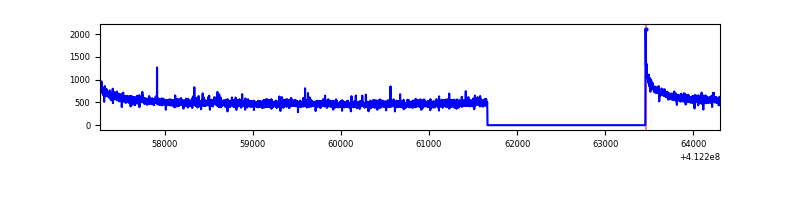 |
| B | 7037 | 5245 | 11 | 11 | 0.16% | 0.21% | 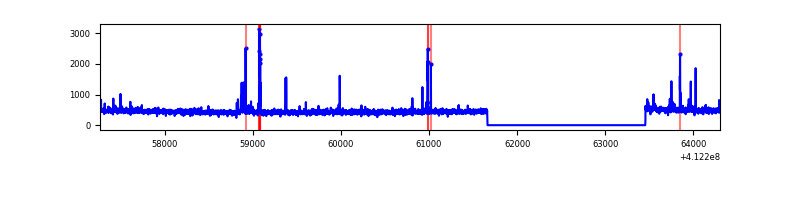 |
| C | 7037 | 5245 | 313 | 313 | 4.45% | 5.97% | 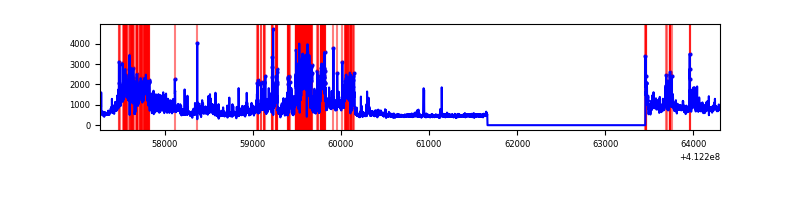 |
| D | 7037 | 5245 | 293 | 293 | 4.16% | 5.59% | 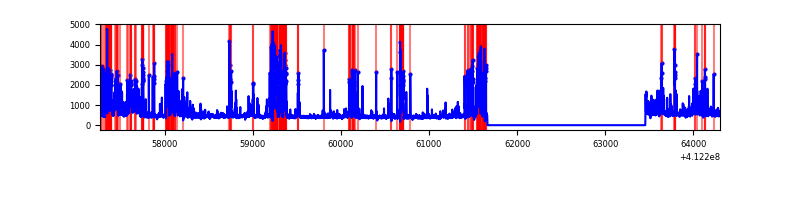 |
Top three noisy pixels from each quadrant. If the there are fewer than three noisy pixels in the level2.evt file, extra rows are filled as -1
| Pixel properties | Quadrant properties | ||||||
|---|---|---|---|---|---|---|---|
| Quadrant | DetID | PixID | Counts | Sigma | Mean | Median | Sigma |
| A | 10 | 83 | 405175 | 3367.46 | 589 | 577 | 120.1 |
| A | 6 | 10 | 14235 | 113.68 | 589 | 577 | 120.1 |
| A | 13 | 248 | 12102 | 95.92 | 589 | 577 | 120.1 |
| B | 5 | 255 | 55925 | 492.05 | 581 | 564 | 112.5 |
| B | 15 | 85 | 26223 | 228.06 | 581 | 564 | 112.5 |
| B | 5 | 172 | 25980 | 225.9 | 581 | 564 | 112.5 |
| C | 9 | 187 | 2163985 | 16556.41 | 561 | 563 | 130.7 |
| C | 15 | 214 | 228009 | 1740.62 | 561 | 563 | 130.7 |
| C | 15 | 208 | 202756 | 1547.36 | 561 | 563 | 130.7 |
| D | 12 | 227 | 701338 | 5110.08 | 563 | 546 | 137.1 |
| D | 13 | 249 | 398823 | 2904.18 | 563 | 546 | 137.1 |
| D | 13 | 171 | 190995 | 1388.73 | 563 | 546 | 137.1 |
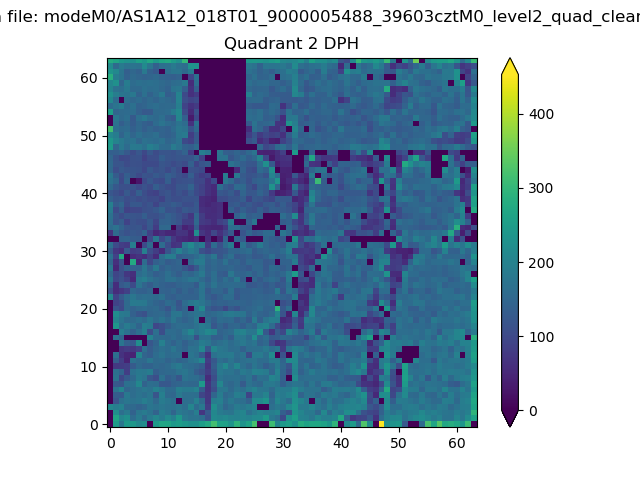
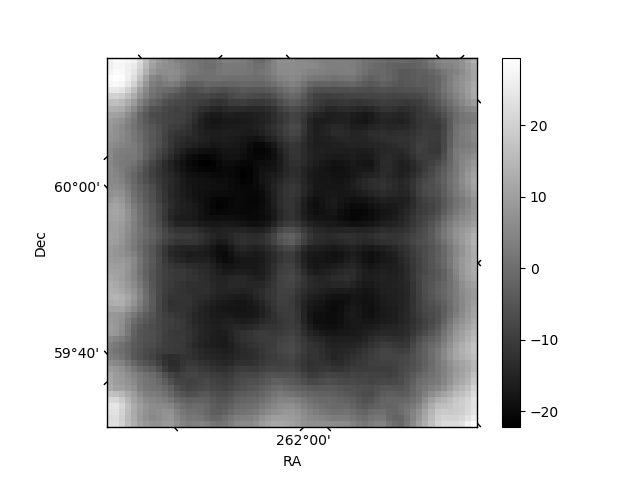
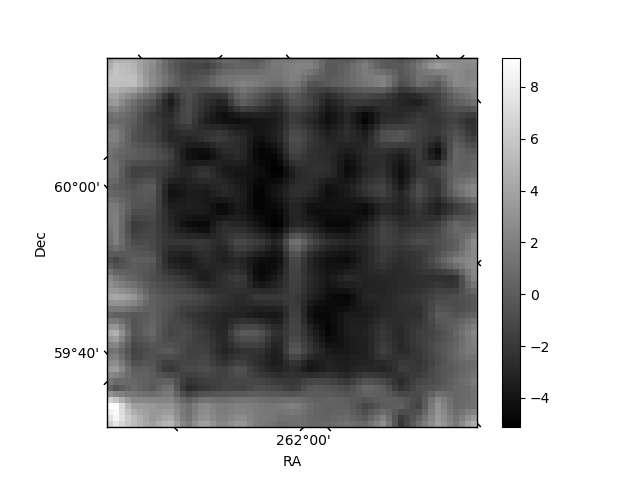
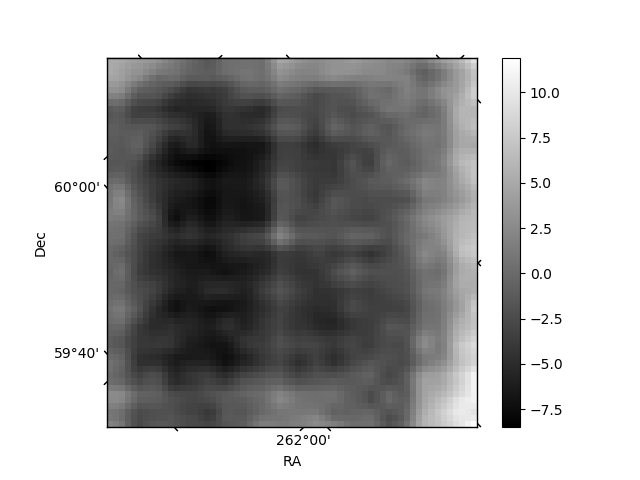
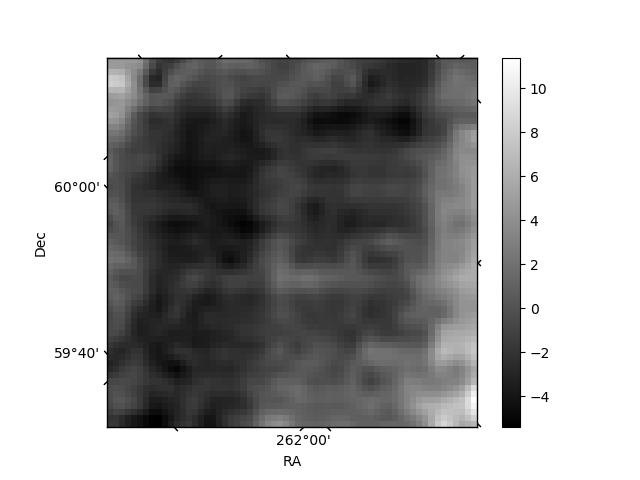
Histogram calculated using DETX and DETY for each event in the final _common_clean file
| Quadrant A | 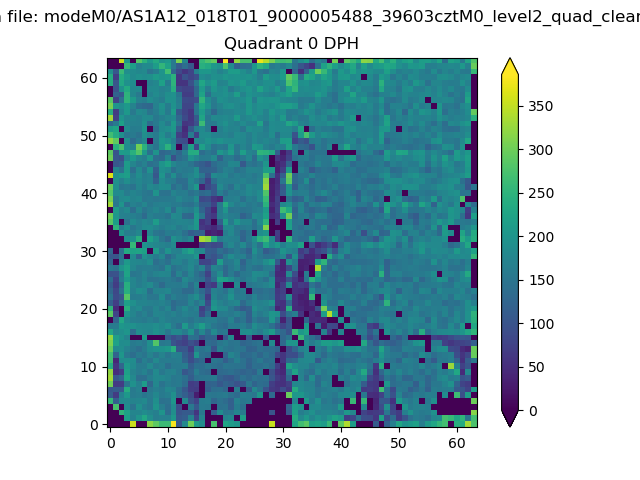 |
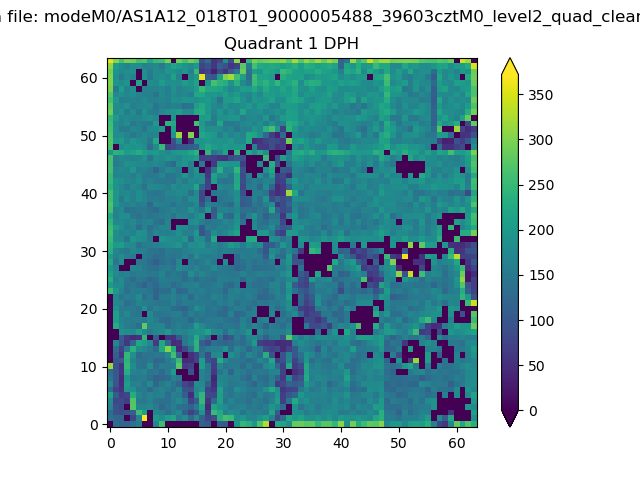 |
Quadrant B |
|---|---|---|---|
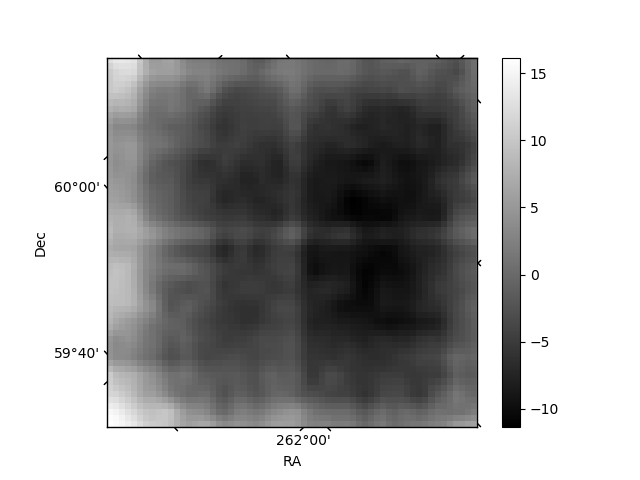
| Quadrant D | 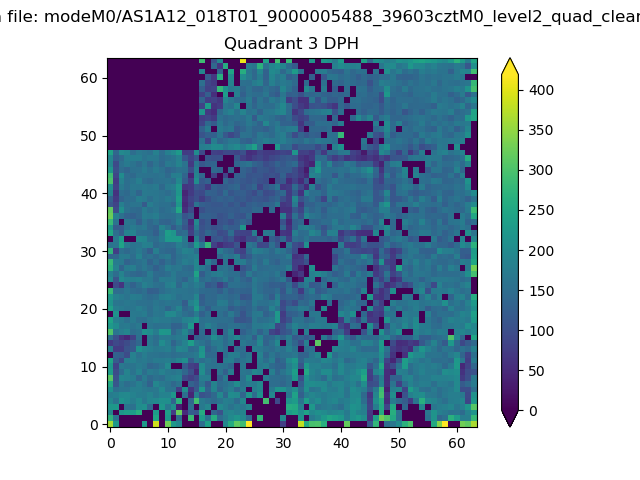 |
 |
Quadrant C |
| Plot type | Count rate plots | Images |
|---|---|---|
| Comparison with Poisson distribution Blue bars denote a histogram of data divided into 1 sec bins. Red curve is a Poisson curve with rate = median count rate of data. |
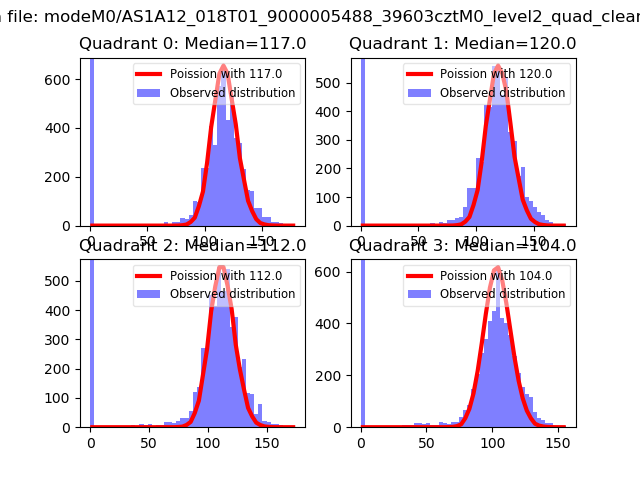 |
 |
| Quadrant-wise count rates Data is divided into 100 sec bins |
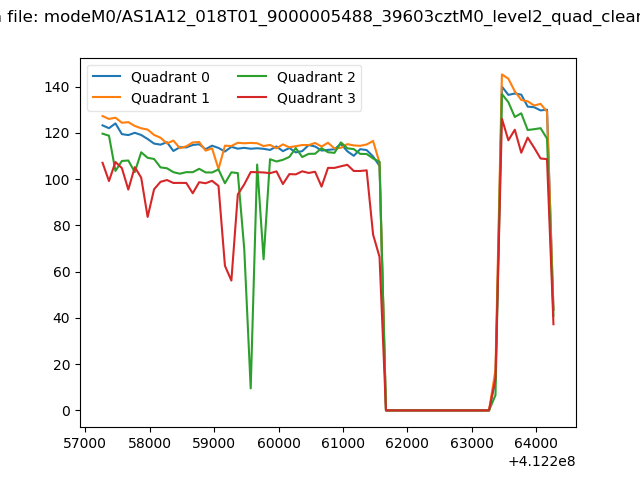 |
|
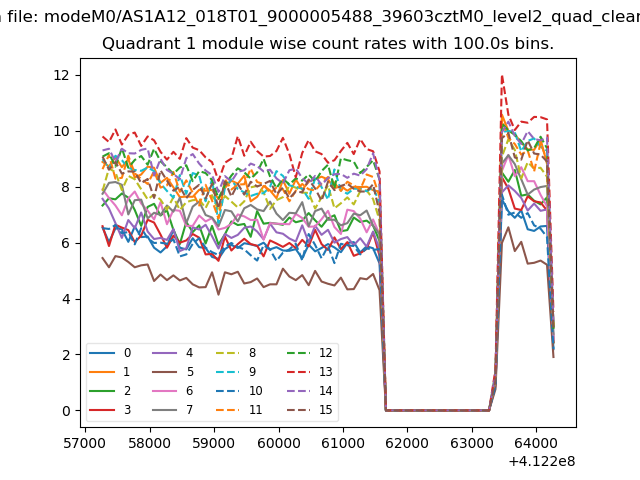
| Module-wise count rates for Quadrant A Data is divided into 100 sec bins |
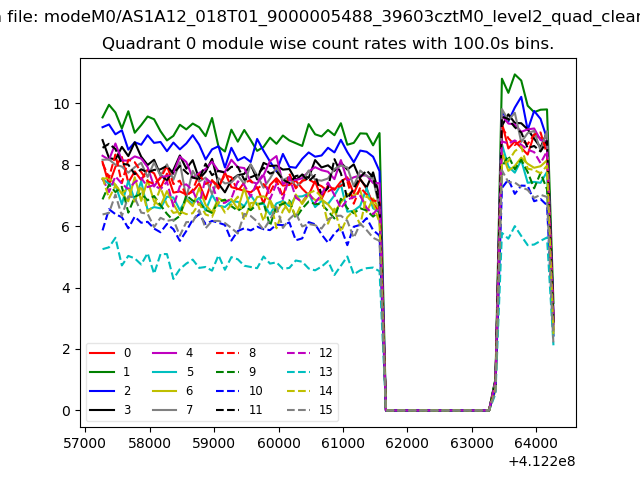 |
 |
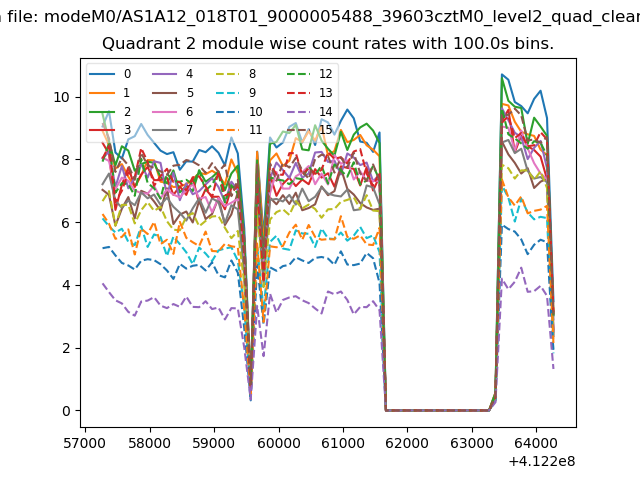
| Module-wise count rates for Quadrant B Data is divided into 100 sec bins |
 |
 |
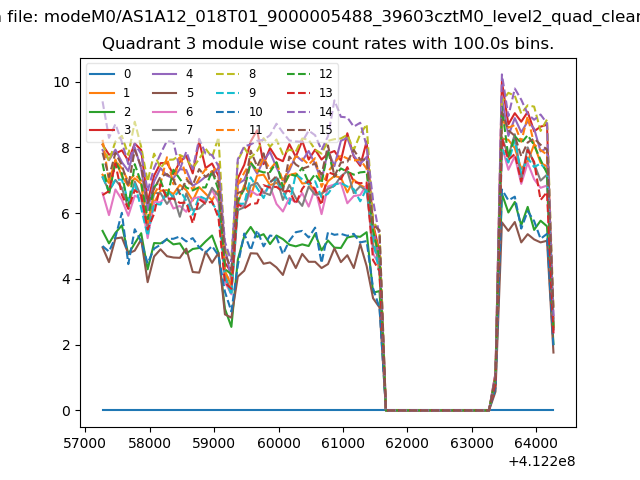
| Module-wise count rates for Quadrant C Data is divided into 100 sec bins |
 |
 |
| Module-wise count rates for Quadrant D Data is divided into 100 sec bins |
 |
 |
| Parameter | Plot |
|---|---|
| CZT HV Monitor | 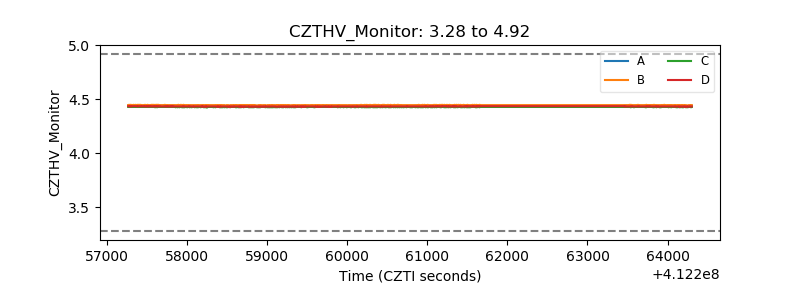 |
| D_VDD | 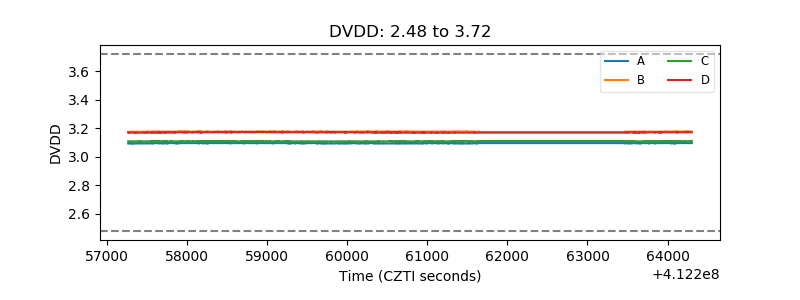 |
| Temperature 1 | 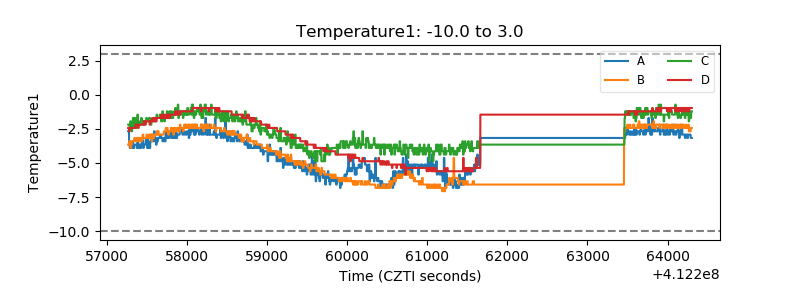 |
| Veto HV Monitor |  |
| Veto LLD | 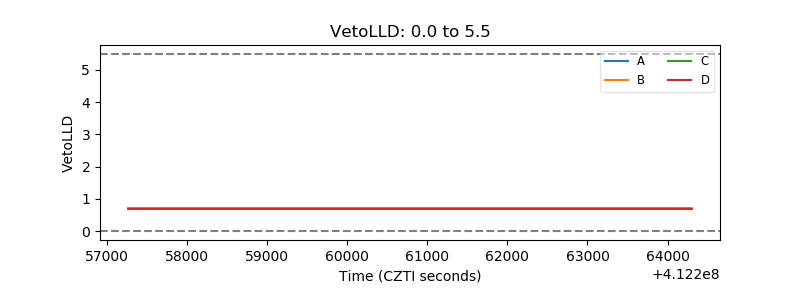 |
| Alpha Counter | 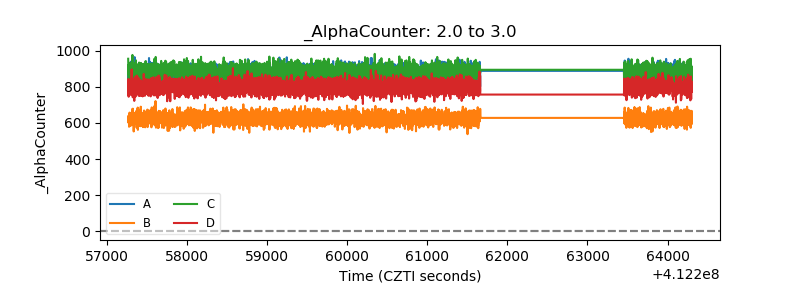 |
| _CPM_Rate | 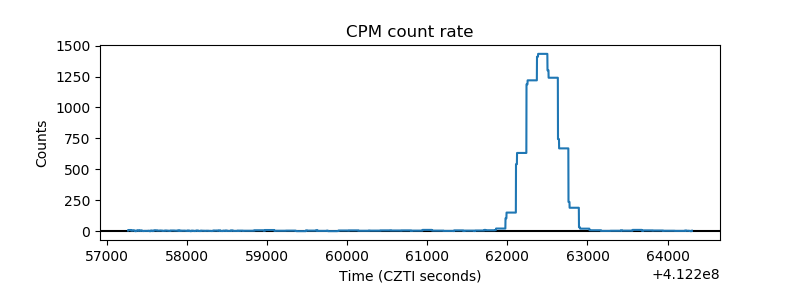 |
| CZT Counter | 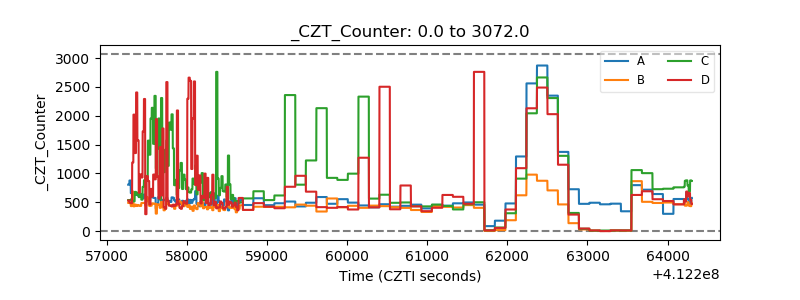 |
| +2.5 Volts monitor | 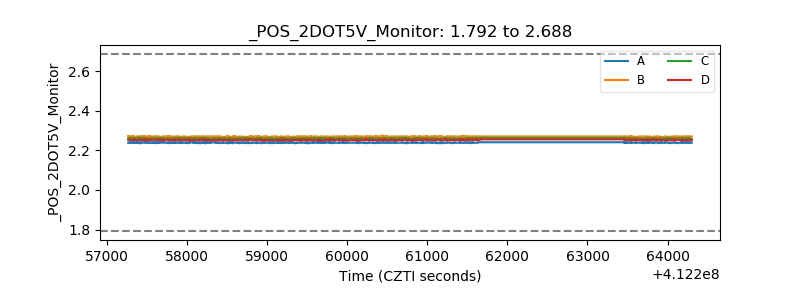 |
| +5 Volts monitor | 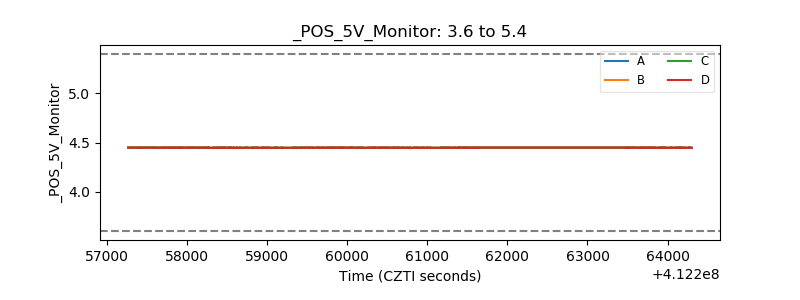 |
| _ROLL_ROT | 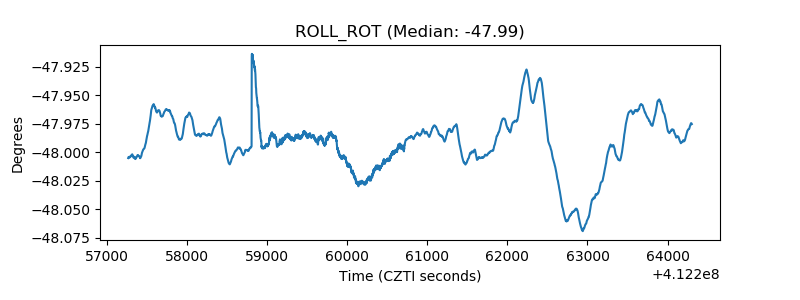 |
| _Roll_DEC | 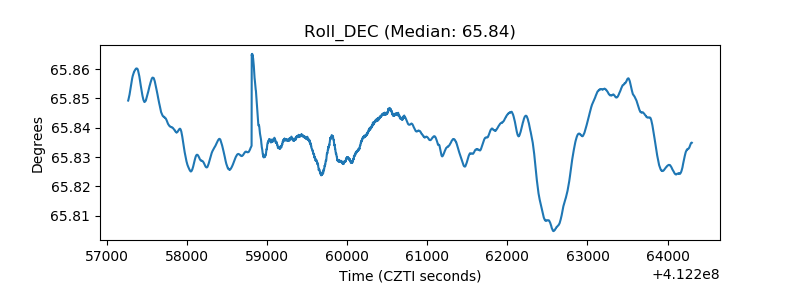 |
| _Roll_RA | 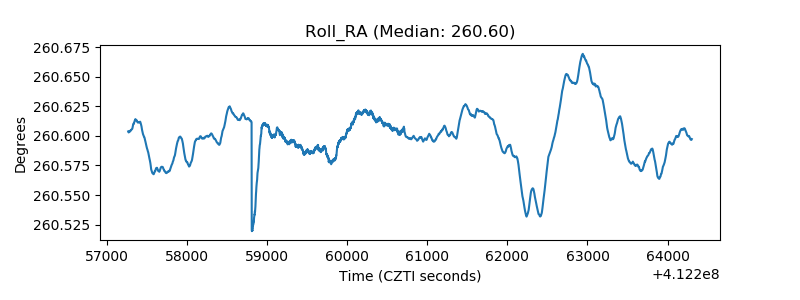 |
| Veto Counter | 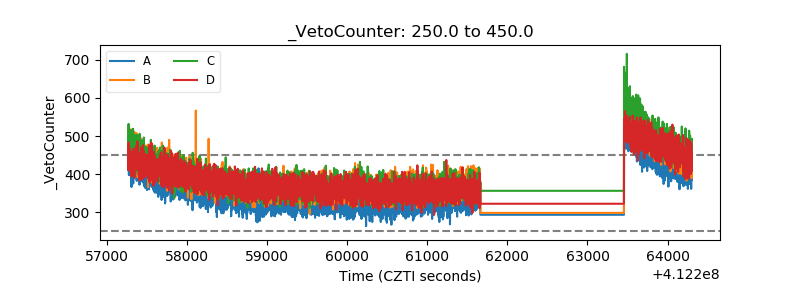 |