| Param | Original file | Final file |
|---|---|---|
| Filename | modeM0/AS1A12_018T01_9000005488_39604cztM0_level2.fits | modeM0/AS1A12_018T01_9000005488_39604cztM0_level2_quad_clean.evt |
| Size (bytes) | 404,576,640 | 96,249,600 |
| Size | 385.8 MB | 91.8 MB |
| Events in quadrant A | 3,005,397 | 668,923 |
| Events in quadrant B | 2,715,375 | 674,371 |
| Events in quadrant C | 5,306,408 | 616,538 |
| Events in quadrant D | 3,534,188 | 581,281 |
| Mode SS | |||
|---|---|---|---|
| Quadrant | BADHDUFLAG | Total packets | Discarded packets |
| A | 0 | 108 | 0 |
| B | 0 | 108 | 0 |
| C | 0 | 108 | 0 |
| D | 0 | 108 | 0 |
| Mode M0 | |||
|---|---|---|---|
| Quadrant | BADHDUFLAG | Total packets | Discarded packets |
| A | 0 | 12345 | 3 |
| B | 0 | 11671 | 2 |
| C | 0 | 19468 | 2 |
| D | 0 | 14073 | 2 |
| Mode M9 | |||
|---|---|---|---|
| Quadrant | BADHDUFLAG | Total packets | Discarded packets |
| A | 0 | 20 | 0 |
| B | 0 | 20 | 0 |
| C | 0 | 20 | 0 |
| D | 0 | 21 | 0 |
| Quadrant | Total seconds | Saturated seconds | Saturation percentage |
|---|---|---|---|
| A | 5338 | 14 | 0.262271% |
| B | 5338 | 55 | 1.030348% |
| C | 5338 | 356 | 6.669164% |
| D | 5338 | 217 | 4.065193% |
Noise dominated data is calculated using 1-second bins in cleaned event files. If a bin has >2000 counts, and if more than 50% of those come from <1% of pixels, then it is considered to be noise-dominated and hence unusable.
| Quadrant | # 1 sec bins | Bins with >0 counts | Bins with >2000 counts | High rate bins dominated by noise | Noise dominated (total time) | Noise dominated (detector-on time) | Marked lightcurve |
|---|---|---|---|---|---|---|---|
| A | 7221 | 5339 | 5 | 5 | 0.07% | 0.09% | 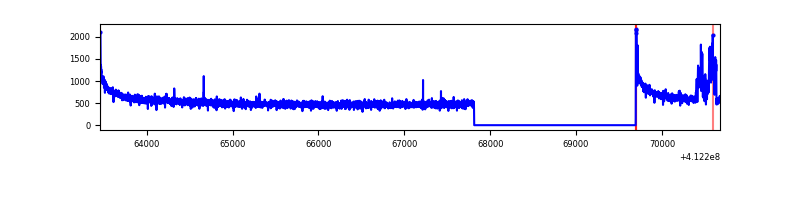 |
| B | 7221 | 5339 | 31 | 31 | 0.43% | 0.58% | 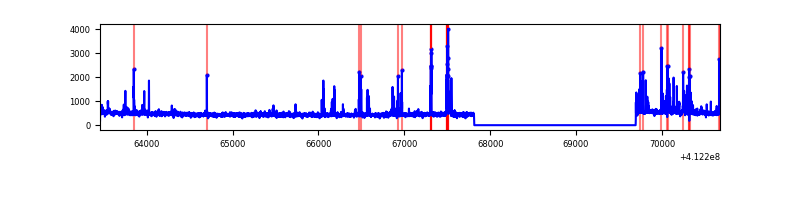 |
| C | 7221 | 5339 | 344 | 344 | 4.76% | 6.44% | 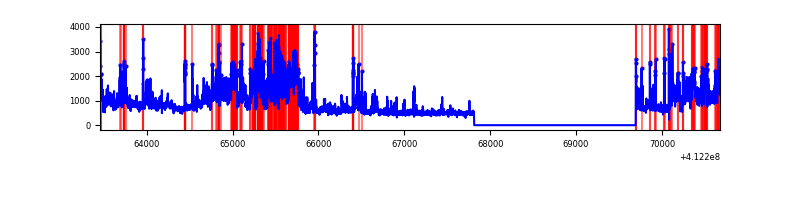 |
| D | 7221 | 5339 | 167 | 167 | 2.31% | 3.13% | 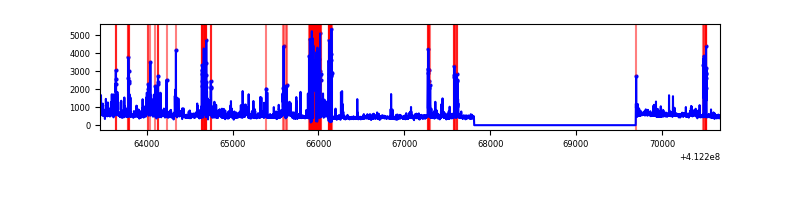 |
Top three noisy pixels from each quadrant. If the there are fewer than three noisy pixels in the level2.evt file, extra rows are filled as -1
| Pixel properties | Quadrant properties | ||||||
|---|---|---|---|---|---|---|---|
| Quadrant | DetID | PixID | Counts | Sigma | Mean | Median | Sigma |
| A | 10 | 83 | 456854 | 3631.79 | 618 | 605 | 125.6 |
| A | 15 | 222 | 140424 | 1112.97 | 618 | 605 | 125.6 |
| A | 13 | 254 | 7975 | 58.67 | 618 | 605 | 125.6 |
| B | 5 | 255 | 221267 | 1890.81 | 612 | 596 | 116.7 |
| B | 5 | 172 | 79138 | 672.98 | 612 | 596 | 116.7 |
| B | 12 | 111 | 13994 | 114.8 | 612 | 596 | 116.7 |
| C | 9 | 187 | 2227880 | 16260.47 | 597 | 602 | 137.0 |
| C | 15 | 208 | 350267 | 2552.77 | 597 | 602 | 137.0 |
| C | 15 | 214 | 234115 | 1704.79 | 597 | 602 | 137.0 |
| D | 12 | 227 | 665468 | 4540.28 | 599 | 584 | 146.4 |
| D | 12 | 233 | 133699 | 909.0 | 599 | 584 | 146.4 |
| D | 13 | 249 | 125207 | 851.01 | 599 | 584 | 146.4 |
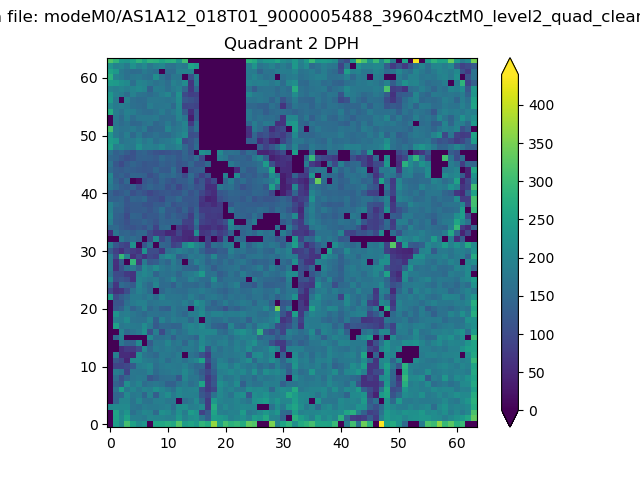
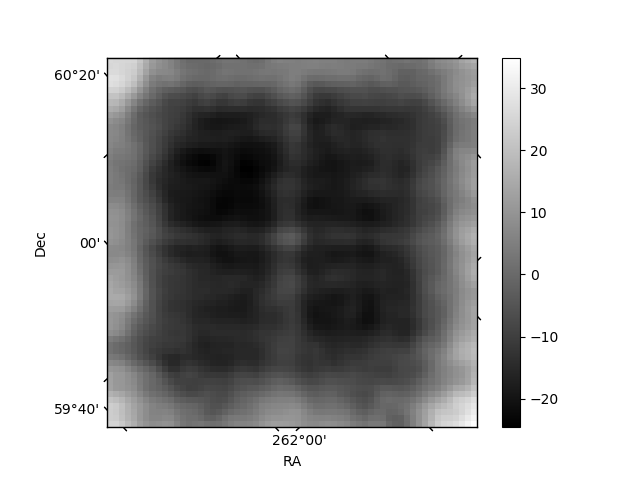
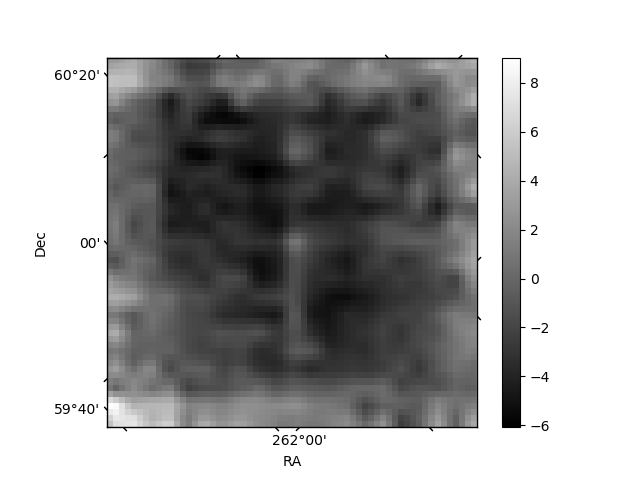
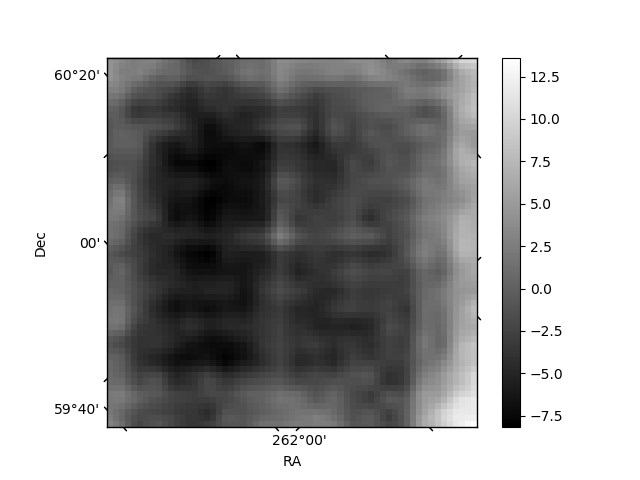
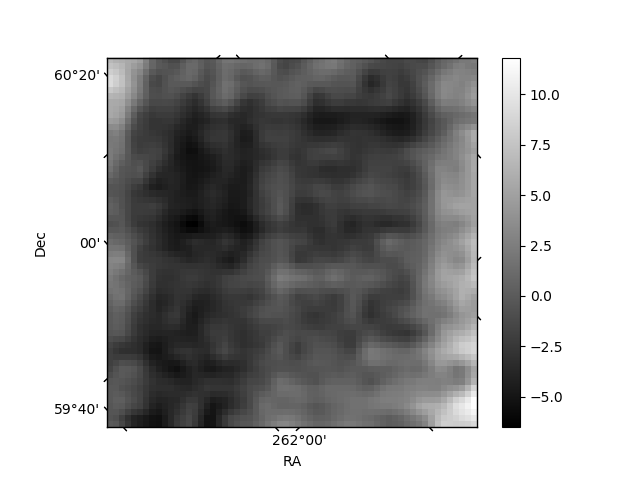
Histogram calculated using DETX and DETY for each event in the final _common_clean file
| Quadrant A | 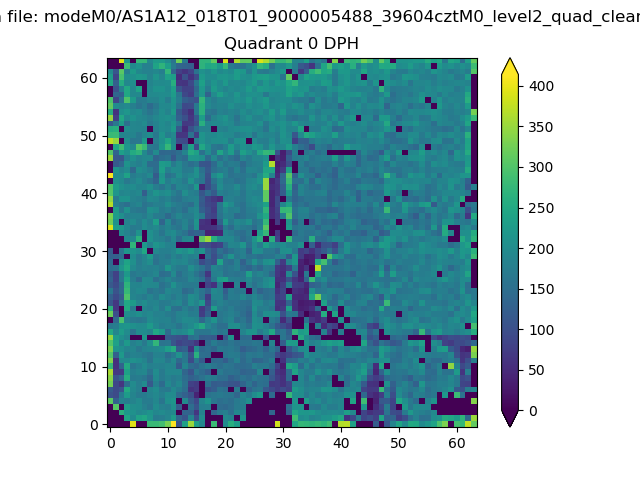 |
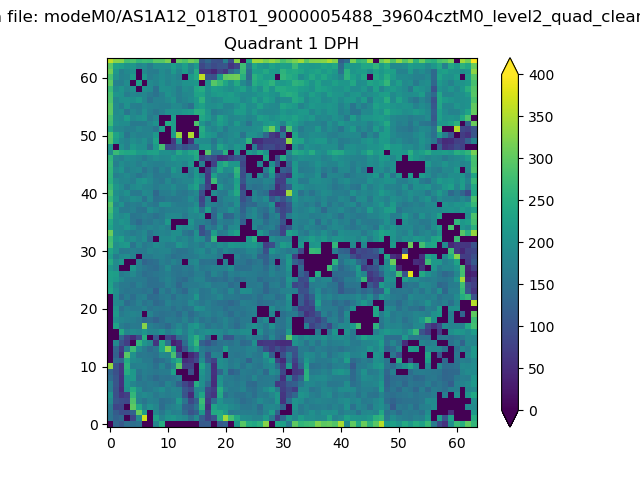 |
Quadrant B |
|---|---|---|---|
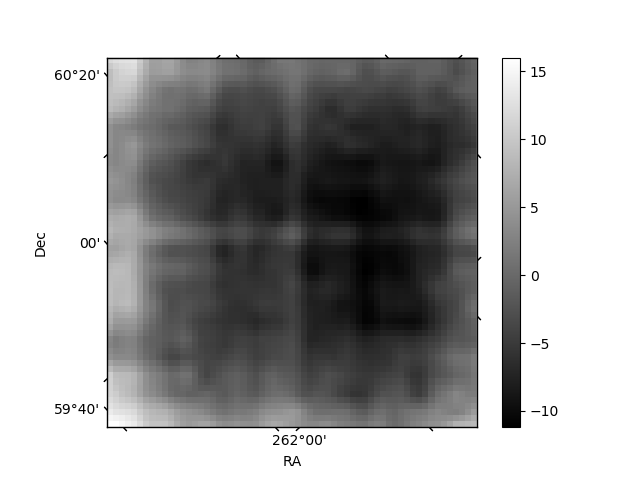
| Quadrant D | 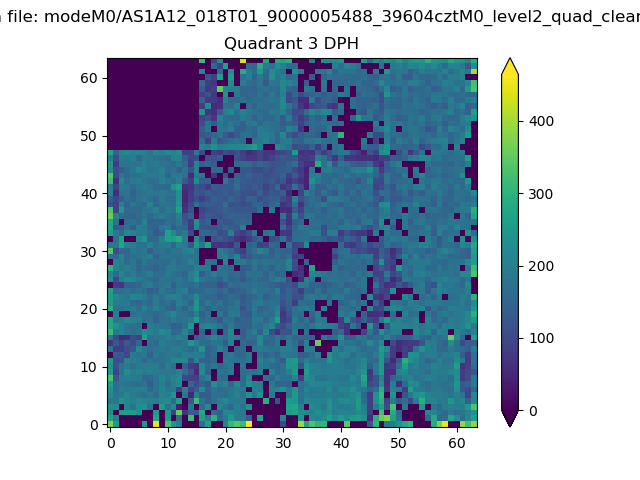 |
 |
Quadrant C |
| Plot type | Count rate plots | Images |
|---|---|---|
| Comparison with Poisson distribution Blue bars denote a histogram of data divided into 1 sec bins. Red curve is a Poisson curve with rate = median count rate of data. |
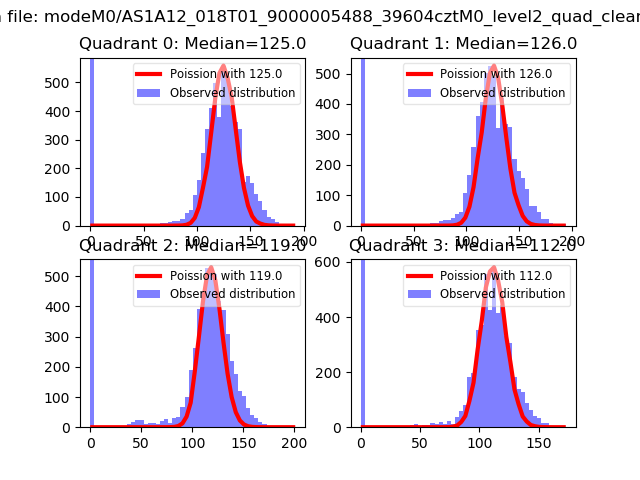 |
 |
| Quadrant-wise count rates Data is divided into 100 sec bins |
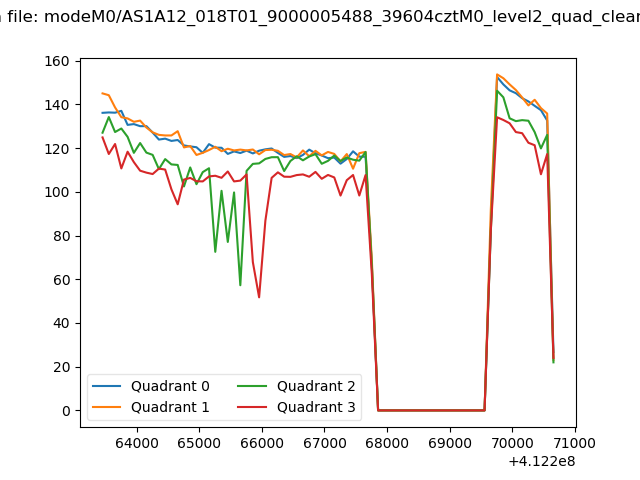 |
|
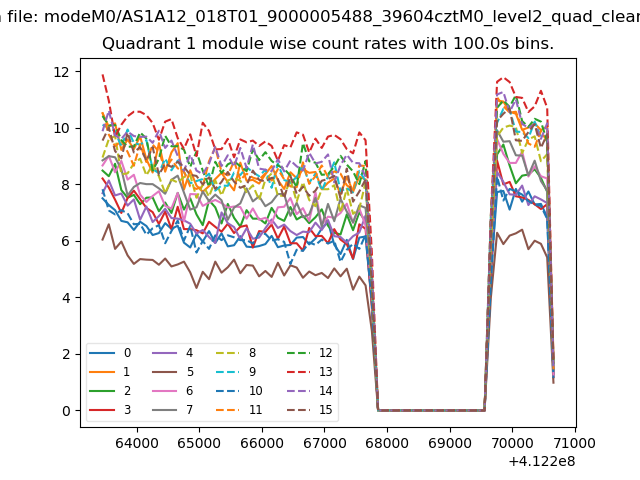
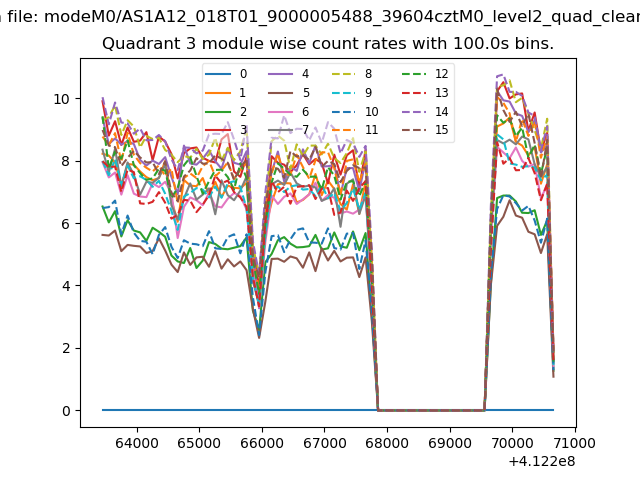
| Module-wise count rates for Quadrant A Data is divided into 100 sec bins |
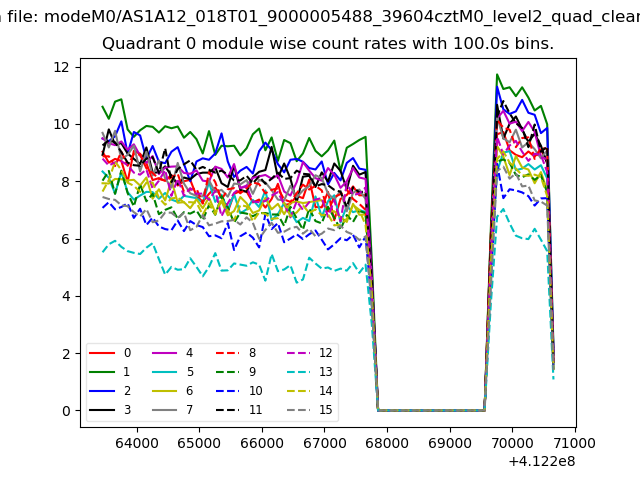 |
 |
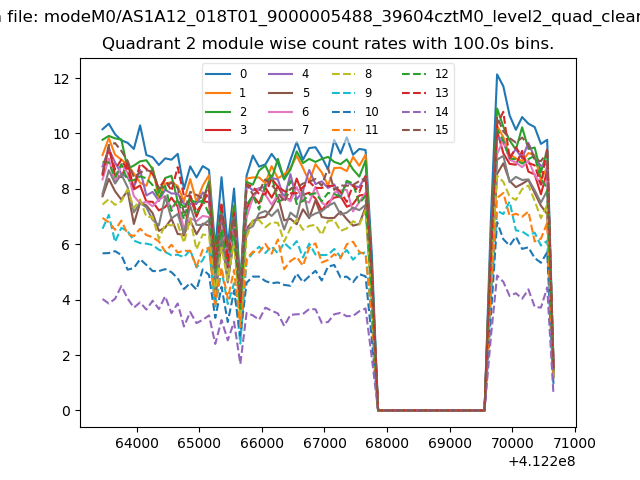
| Module-wise count rates for Quadrant B Data is divided into 100 sec bins |
 |
 |
| Module-wise count rates for Quadrant C Data is divided into 100 sec bins |
 |
 |
| Module-wise count rates for Quadrant D Data is divided into 100 sec bins |
 |
 |
| Parameter | Plot |
|---|---|
| CZT HV Monitor | 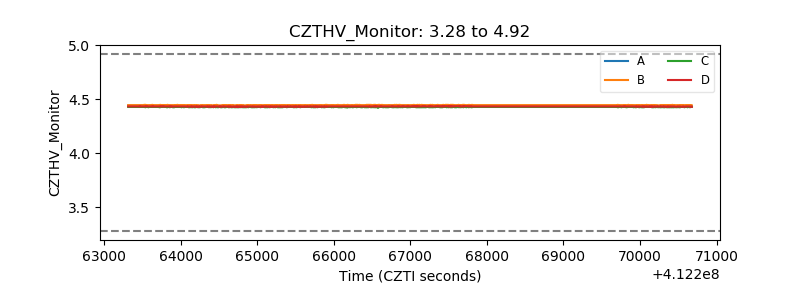 |
| D_VDD | 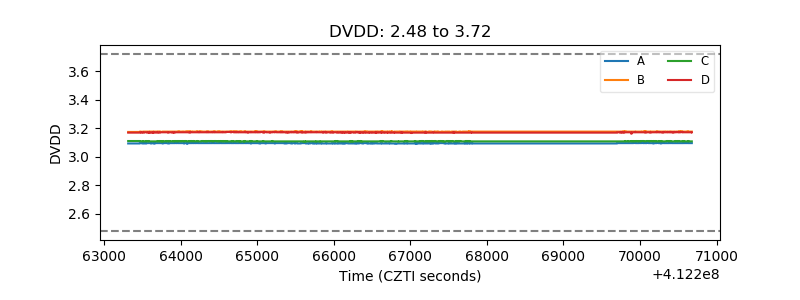 |
| Temperature 1 | 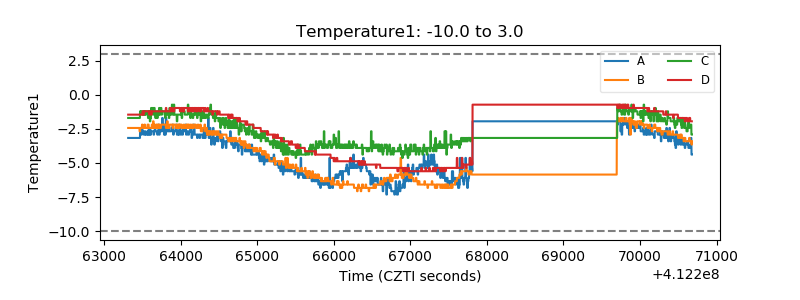 |
| Veto HV Monitor | 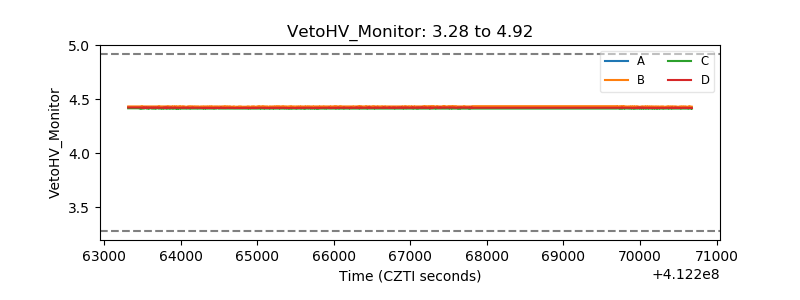 |
| Veto LLD | 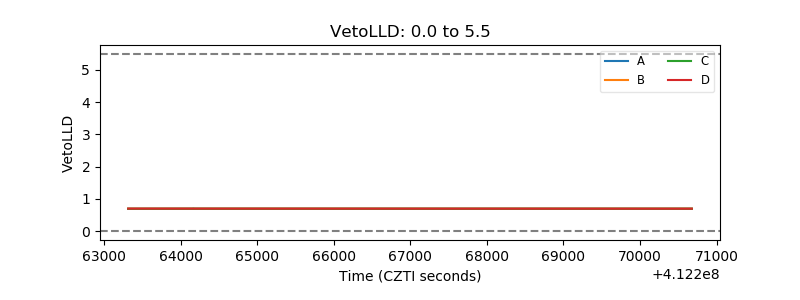 |
| Alpha Counter | 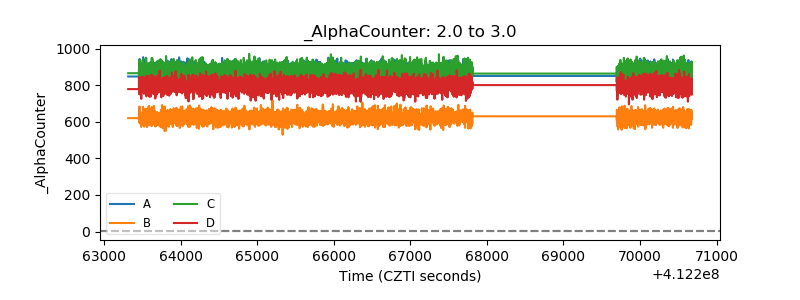 |
| _CPM_Rate | 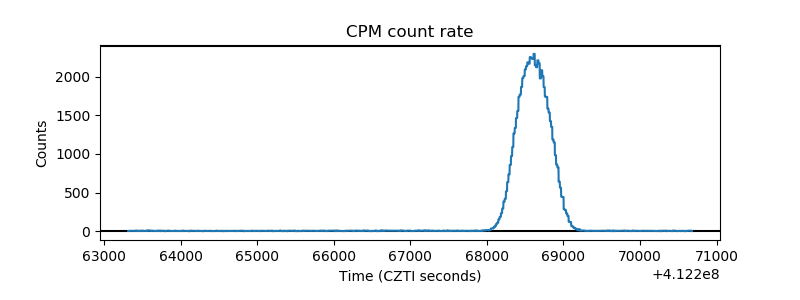 |
| CZT Counter | 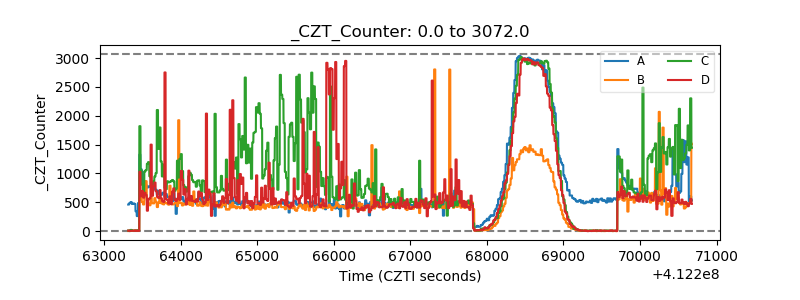 |
| +2.5 Volts monitor | 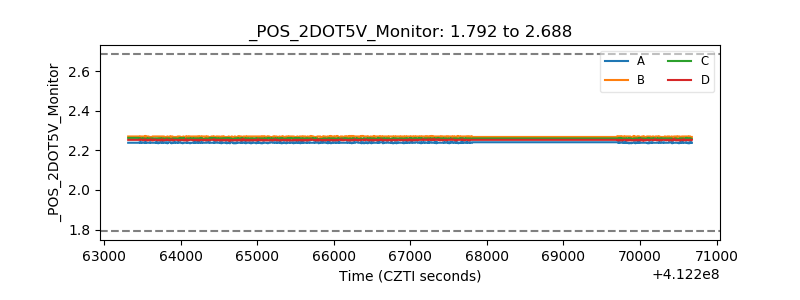 |
| +5 Volts monitor | 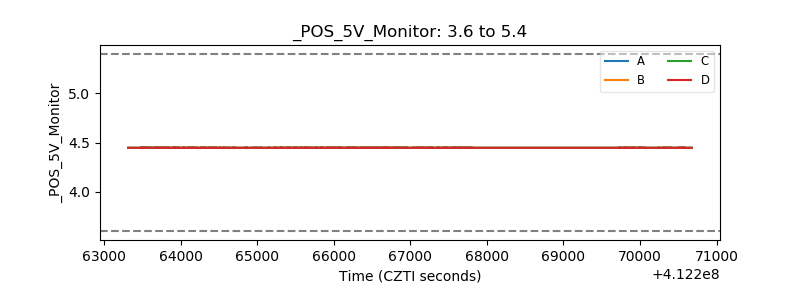 |
| _ROLL_ROT | 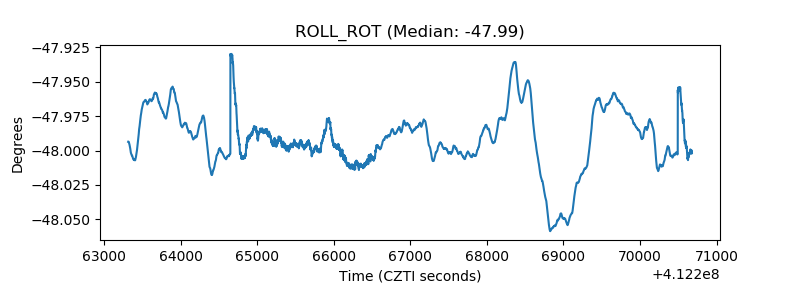 |
| _Roll_DEC | 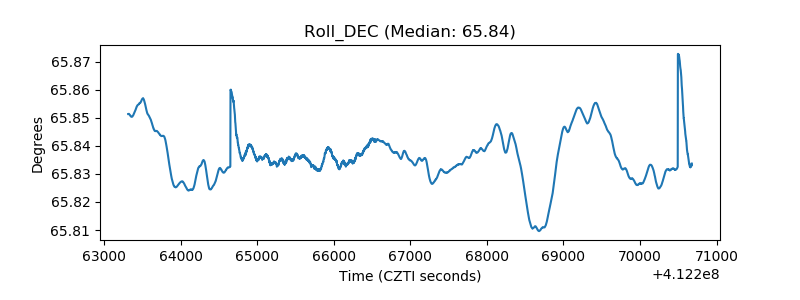 |
| _Roll_RA | 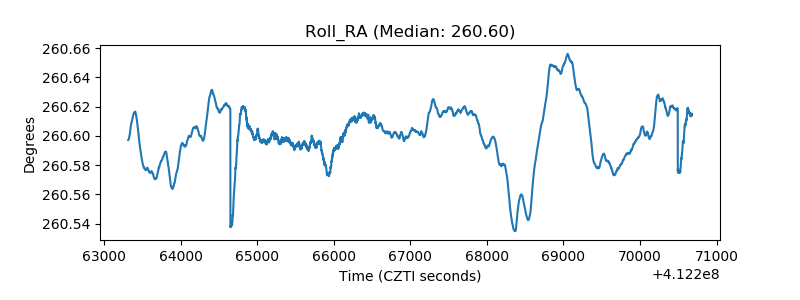 |
| Veto Counter | 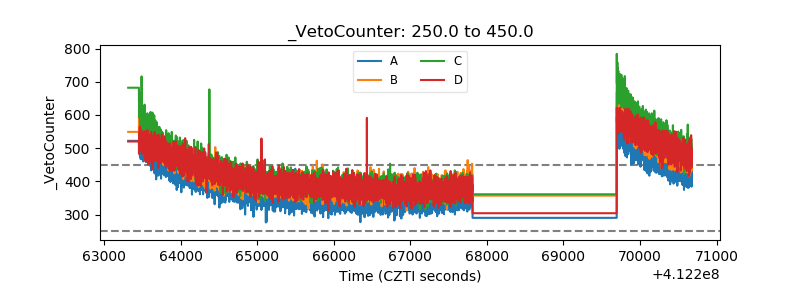 |