| Param | Original file | Final file |
|---|---|---|
| Filename | modeM0/AS1A12_018T01_9000005488_39605cztM0_level2.fits | modeM0/AS1A12_018T01_9000005488_39605cztM0_level2_quad_clean.evt |
| Size (bytes) | 401,935,680 | 97,839,360 |
| Size | 383.3 MB | 93.3 MB |
| Events in quadrant A | 3,231,575 | 676,248 |
| Events in quadrant B | 3,059,428 | 685,650 |
| Events in quadrant C | 4,681,100 | 642,658 |
| Events in quadrant D | 3,500,303 | 592,118 |
| Mode SS | |||
|---|---|---|---|
| Quadrant | BADHDUFLAG | Total packets | Discarded packets |
| A | 0 | 108 | 0 |
| B | 0 | 108 | 0 |
| C | 0 | 108 | 0 |
| D | 0 | 108 | 0 |
| Mode M0 | |||
|---|---|---|---|
| Quadrant | BADHDUFLAG | Total packets | Discarded packets |
| A | 0 | 13000 | 3 |
| B | 0 | 12528 | 2 |
| C | 0 | 17461 | 2 |
| D | 0 | 14087 | 2 |
| Mode M9 | |||
|---|---|---|---|
| Quadrant | BADHDUFLAG | Total packets | Discarded packets |
| A | 0 | 23 | 0 |
| B | 0 | 23 | 0 |
| C | 0 | 23 | 0 |
| D | 0 | 24 | 0 |
| Quadrant | Total seconds | Saturated seconds | Saturation percentage |
|---|---|---|---|
| A | 5223 | 44 | 0.842428% |
| B | 5223 | 124 | 2.374114% |
| C | 5223 | 295 | 5.648095% |
| D | 5223 | 254 | 4.863105% |
Noise dominated data is calculated using 1-second bins in cleaned event files. If a bin has >2000 counts, and if more than 50% of those come from <1% of pixels, then it is considered to be noise-dominated and hence unusable.
| Quadrant | # 1 sec bins | Bins with >0 counts | Bins with >2000 counts | High rate bins dominated by noise | Noise dominated (total time) | Noise dominated (detector-on time) | Marked lightcurve |
|---|---|---|---|---|---|---|---|
| A | 7226 | 5224 | 29 | 29 | 0.40% | 0.56% | 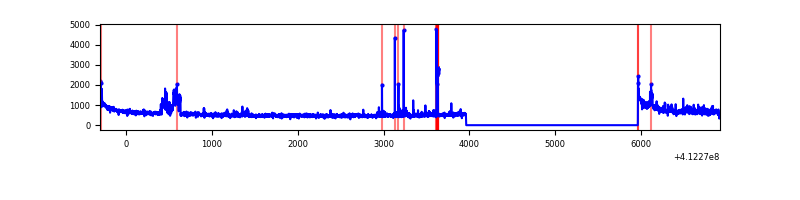 |
| B | 7226 | 5224 | 78 | 78 | 1.08% | 1.49% | 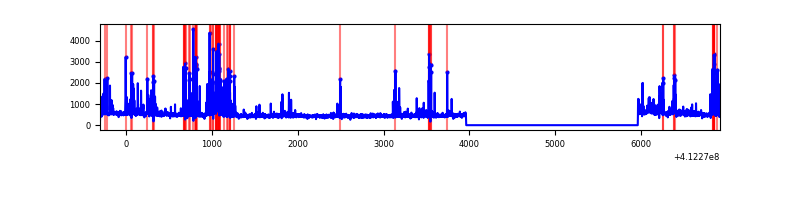 |
| C | 7226 | 5224 | 291 | 291 | 4.03% | 5.57% | 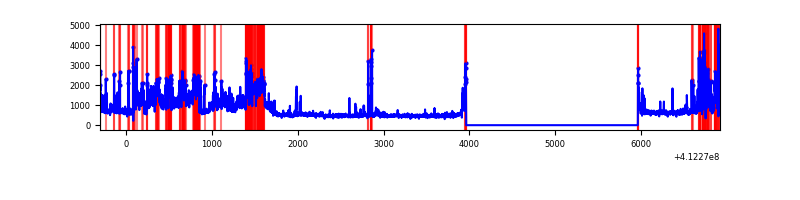 |
| D | 7226 | 5224 | 203 | 203 | 2.81% | 3.89% | 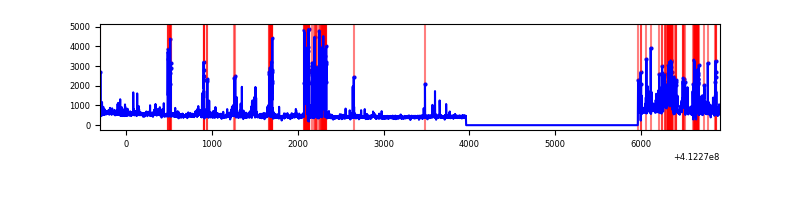 |
Top three noisy pixels from each quadrant. If the there are fewer than three noisy pixels in the level2.evt file, extra rows are filled as -1
| Pixel properties | Quadrant properties | ||||||
|---|---|---|---|---|---|---|---|
| Quadrant | DetID | PixID | Counts | Sigma | Mean | Median | Sigma |
| A | 10 | 83 | 458445 | 3707.04 | 615 | 605 | 123.5 |
| A | 15 | 222 | 206907 | 1670.39 | 615 | 605 | 123.5 |
| A | 6 | 10 | 155123 | 1251.1 | 615 | 605 | 123.5 |
| B | 5 | 255 | 336953 | 2960.15 | 608 | 592 | 113.6 |
| B | 5 | 172 | 286800 | 2518.77 | 608 | 592 | 113.6 |
| B | 4 | 170 | 20327 | 173.68 | 608 | 592 | 113.6 |
| C | 9 | 187 | 1863789 | 13482.69 | 603 | 607 | 138.2 |
| C | 15 | 214 | 229881 | 1659.11 | 603 | 607 | 138.2 |
| C | 15 | 208 | 189195 | 1364.69 | 603 | 607 | 138.2 |
| D | 13 | 249 | 477522 | 3278.12 | 599 | 583 | 145.5 |
| D | 12 | 227 | 190149 | 1302.93 | 599 | 583 | 145.5 |
| D | 12 | 233 | 149242 | 1021.77 | 599 | 583 | 145.5 |
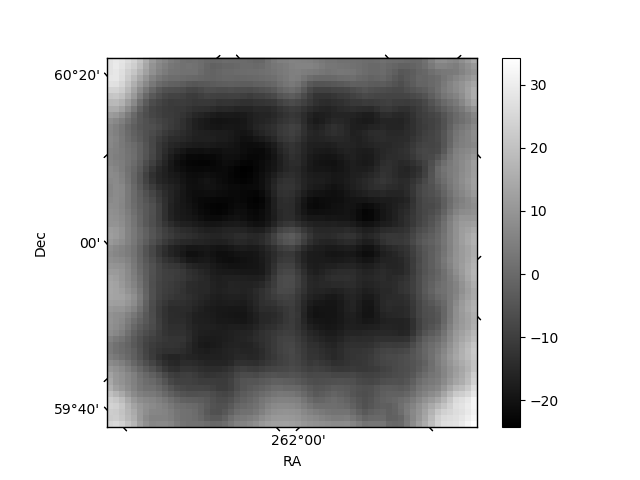
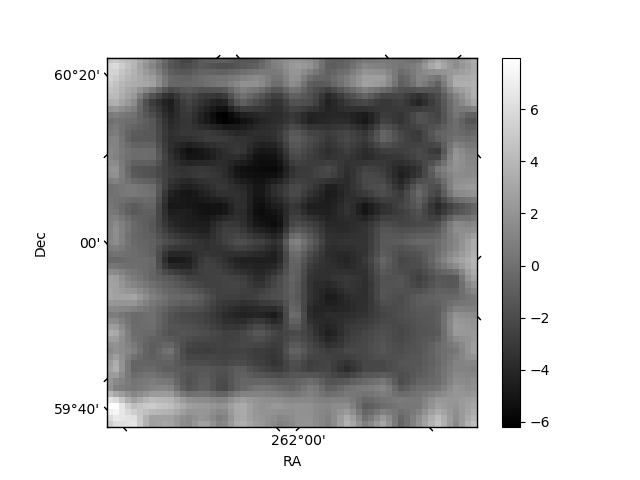
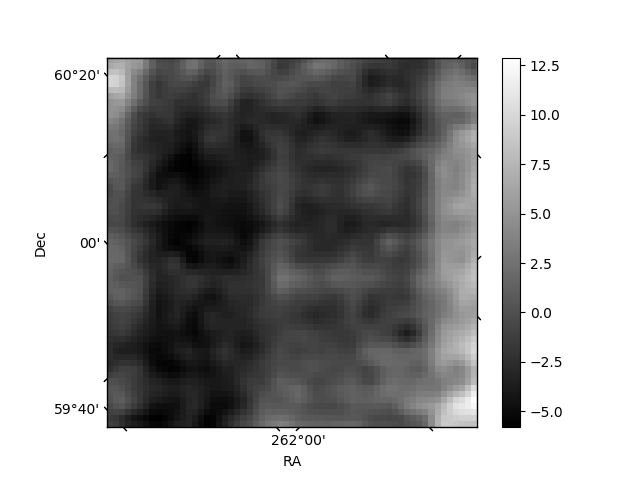
Histogram calculated using DETX and DETY for each event in the final _common_clean file
| Quadrant A | 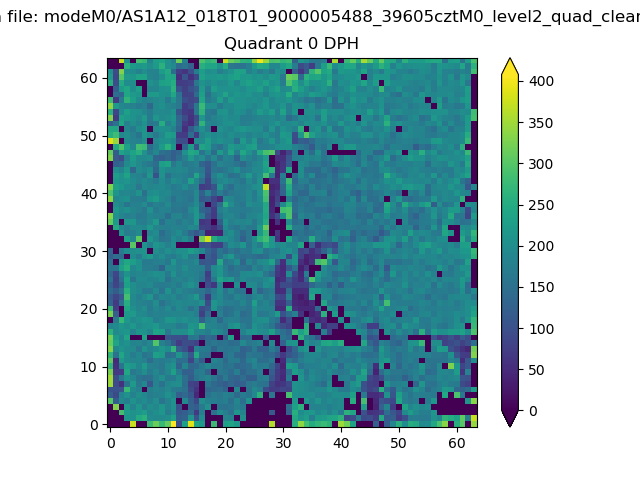 |
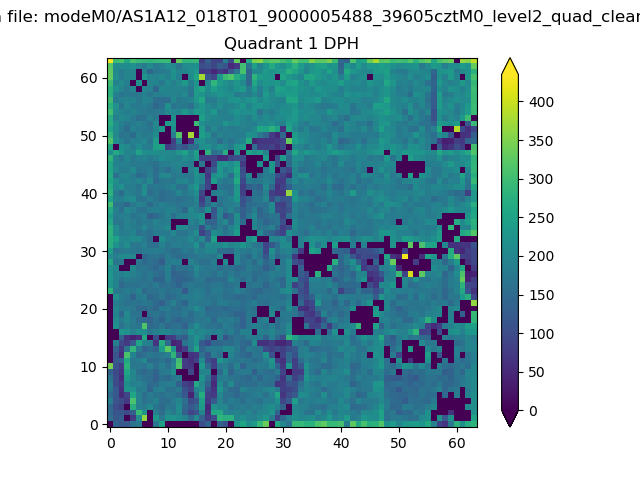 |
Quadrant B |
|---|---|---|---|
| Quadrant D | 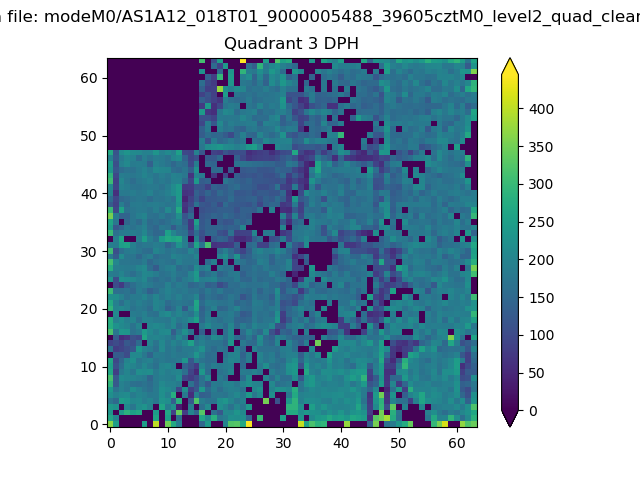 |
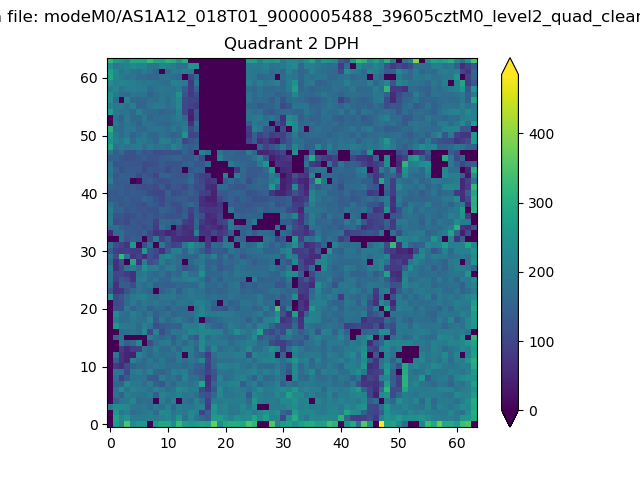 |
Quadrant C |
| Plot type | Count rate plots | Images |
|---|---|---|
| Comparison with Poisson distribution Blue bars denote a histogram of data divided into 1 sec bins. Red curve is a Poisson curve with rate = median count rate of data. |
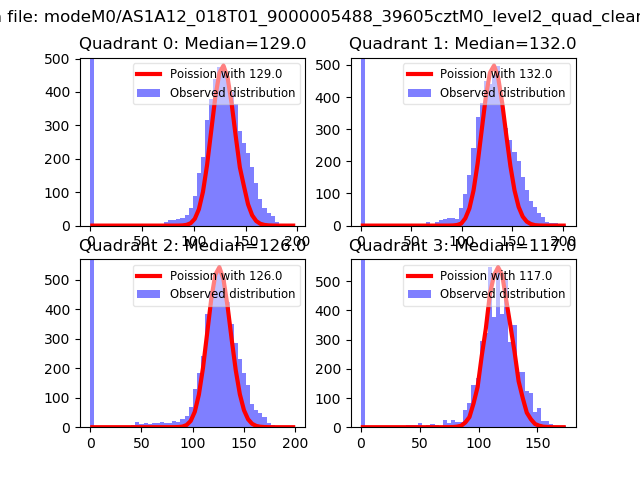 |
 |
| Quadrant-wise count rates Data is divided into 100 sec bins |
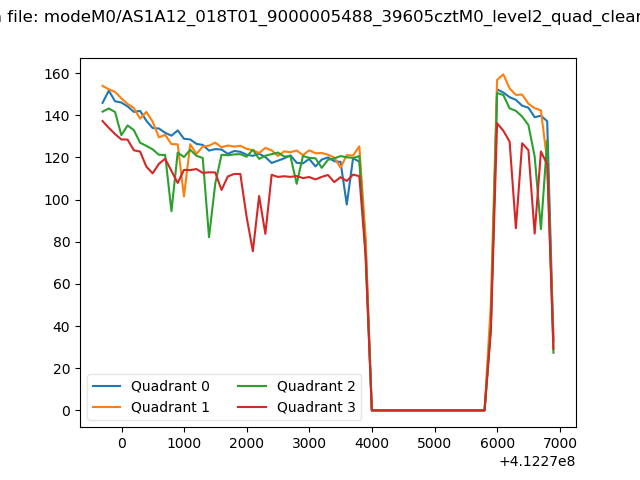 |
|
| Module-wise count rates for Quadrant A Data is divided into 100 sec bins |
 |
 |
| Module-wise count rates for Quadrant B Data is divided into 100 sec bins |
 |
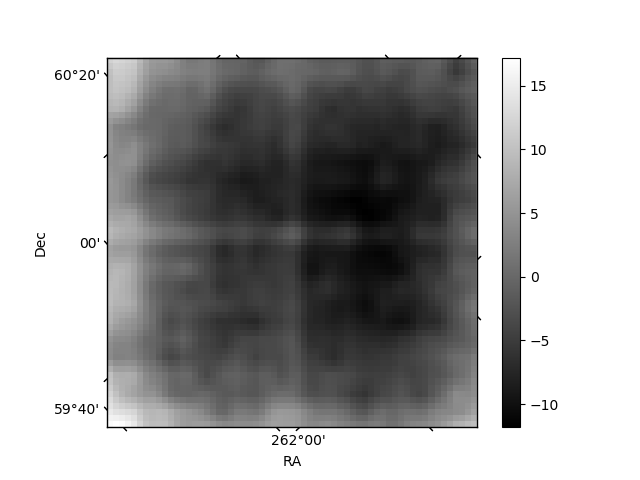 |
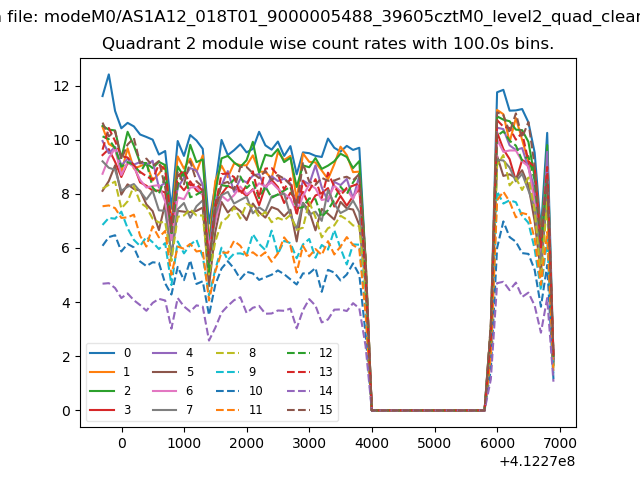
| Module-wise count rates for Quadrant C Data is divided into 100 sec bins |
 |
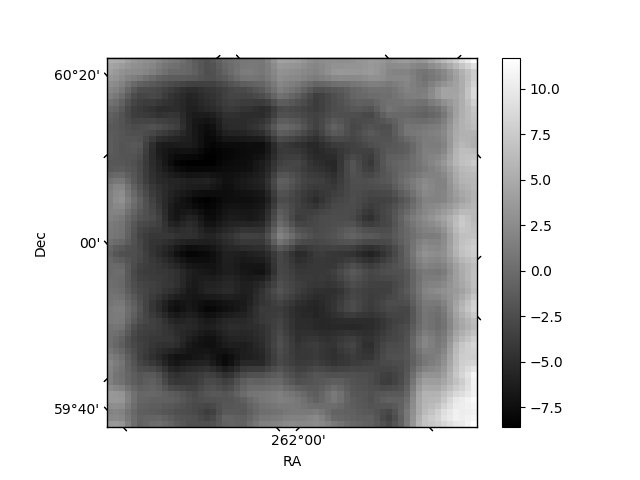 |
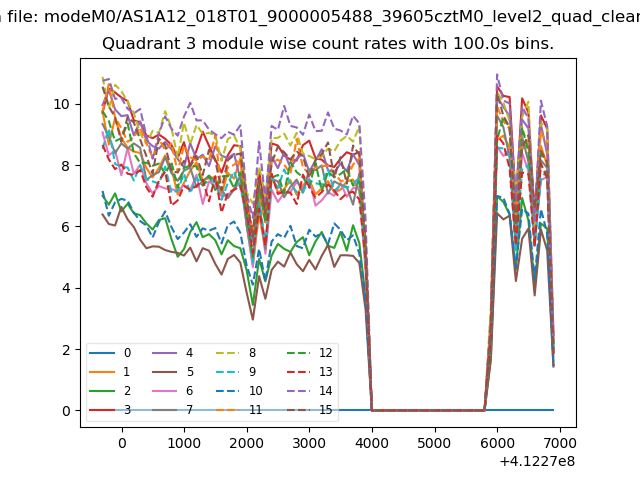
| Module-wise count rates for Quadrant D Data is divided into 100 sec bins |
 |
 |
| Parameter | Plot |
|---|---|
| CZT HV Monitor | 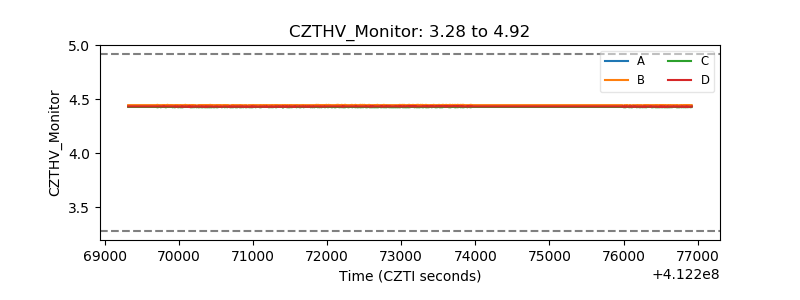 |
| D_VDD | 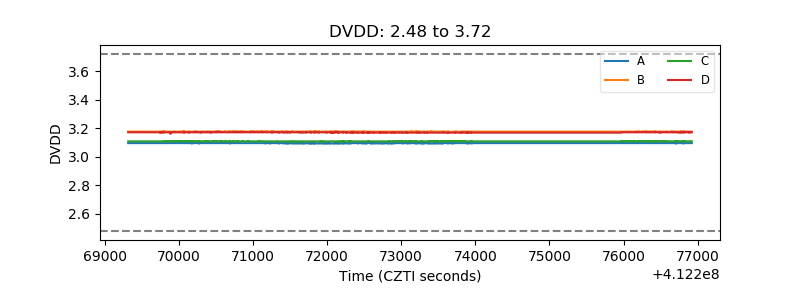 |
| Temperature 1 | 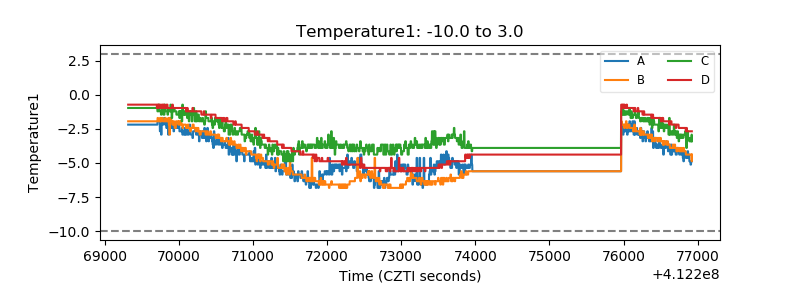 |
| Veto HV Monitor | 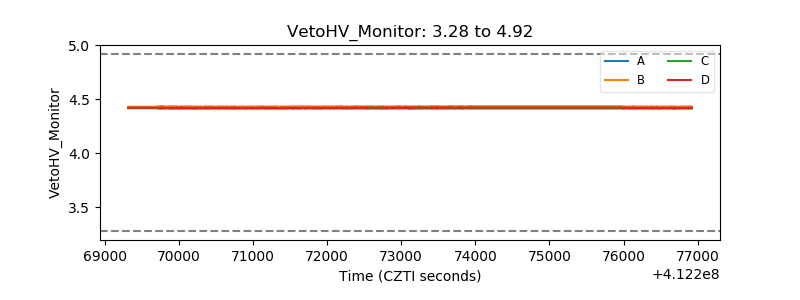 |
| Veto LLD | 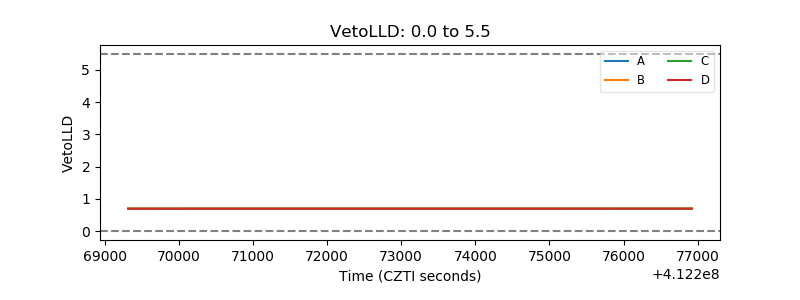 |
| Alpha Counter | 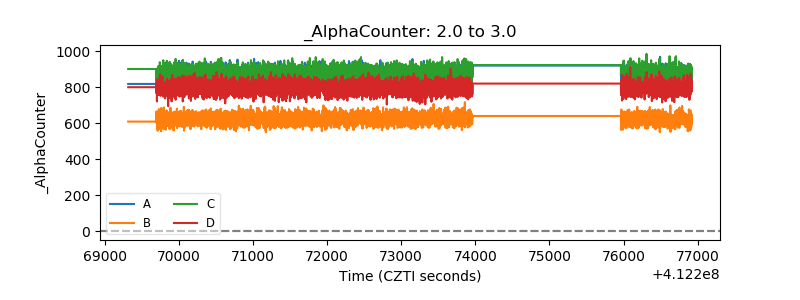 |
| _CPM_Rate | 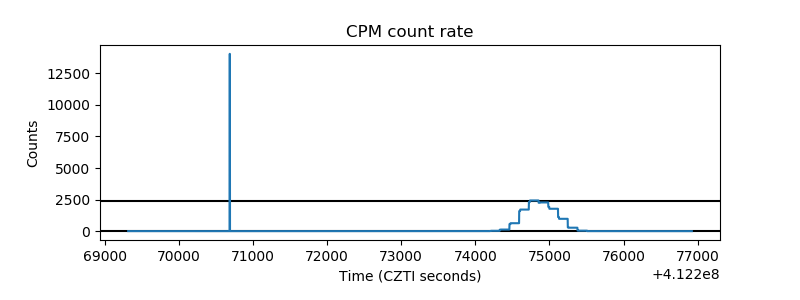 |
| CZT Counter | 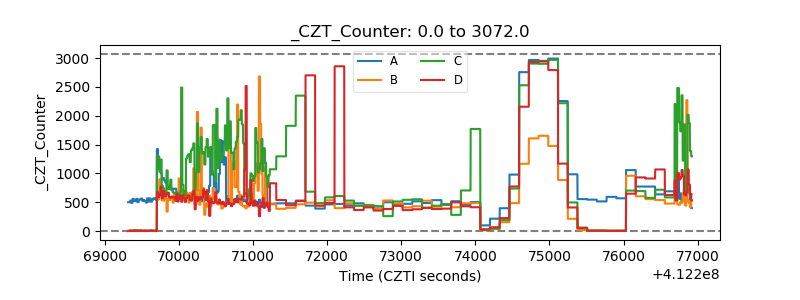 |
| +2.5 Volts monitor | 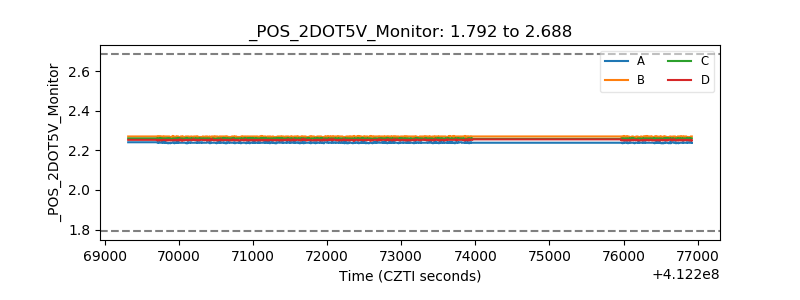 |
| +5 Volts monitor | 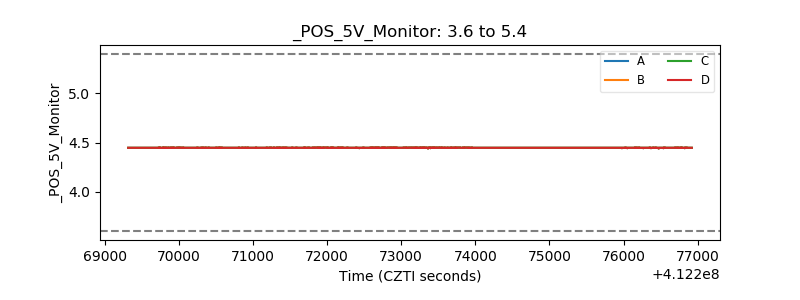 |
| _ROLL_ROT | 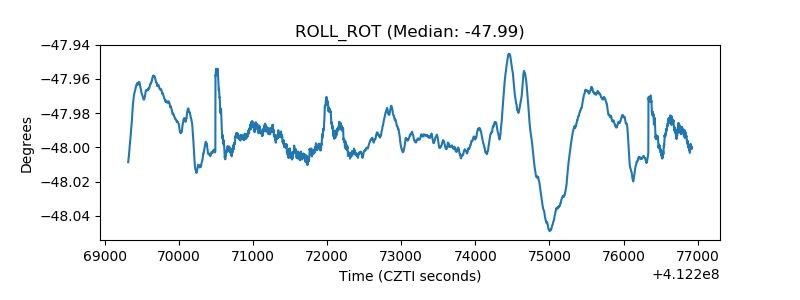 |
| _Roll_DEC | 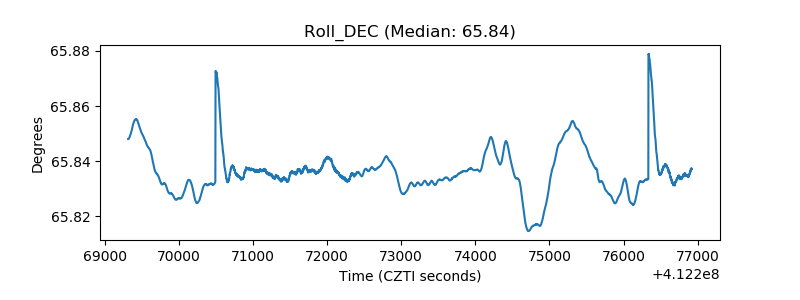 |
| _Roll_RA | 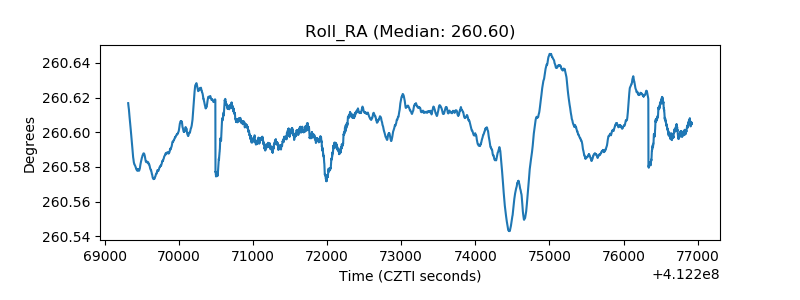 |
| Veto Counter | 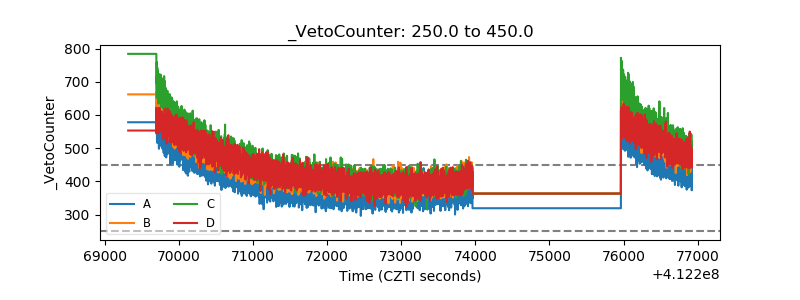 |