| Param | Original file | Final file |
|---|---|---|
| Filename | modeM0/AS1A12_018T01_9000005488_39606cztM0_level2.fits | modeM0/AS1A12_018T01_9000005488_39606cztM0_level2_quad_clean.evt |
| Size (bytes) | 393,842,880 | 92,427,840 |
| Size | 375.6 MB | 88.1 MB |
| Events in quadrant A | 3,206,580 | 643,962 |
| Events in quadrant B | 2,837,184 | 652,170 |
| Events in quadrant C | 4,356,263 | 598,232 |
| Events in quadrant D | 3,793,643 | 557,225 |
| Mode SS | |||
|---|---|---|---|
| Quadrant | BADHDUFLAG | Total packets | Discarded packets |
| A | 0 | 100 | 0 |
| B | 0 | 100 | 0 |
| C | 0 | 100 | 0 |
| D | 0 | 100 | 0 |
| Mode M0 | |||
|---|---|---|---|
| Quadrant | BADHDUFLAG | Total packets | Discarded packets |
| A | 0 | 13010 | 3 |
| B | 0 | 11721 | 2 |
| C | 0 | 16280 | 2 |
| D | 0 | 14780 | 2 |
| Mode M9 | |||
|---|---|---|---|
| Quadrant | BADHDUFLAG | Total packets | Discarded packets |
| A | 0 | 27 | 0 |
| B | 0 | 27 | 0 |
| C | 0 | 27 | 0 |
| D | 0 | 28 | 0 |
| Quadrant | Total seconds | Saturated seconds | Saturation percentage |
|---|---|---|---|
| A | 4956 | 20 | 0.403551% |
| B | 4956 | 117 | 2.360775% |
| C | 4956 | 412 | 8.313156% |
| D | 4956 | 310 | 6.255044% |
Noise dominated data is calculated using 1-second bins in cleaned event files. If a bin has >2000 counts, and if more than 50% of those come from <1% of pixels, then it is considered to be noise-dominated and hence unusable.
| Quadrant | # 1 sec bins | Bins with >0 counts | Bins with >2000 counts | High rate bins dominated by noise | Noise dominated (total time) | Noise dominated (detector-on time) | Marked lightcurve |
|---|---|---|---|---|---|---|---|
| A | 7049 | 4957 | 6 | 6 | 0.09% | 0.12% | 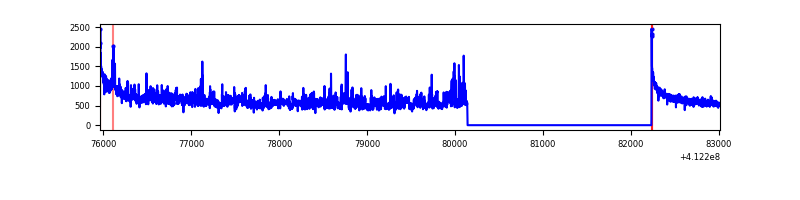 |
| B | 7049 | 4957 | 83 | 83 | 1.18% | 1.67% | 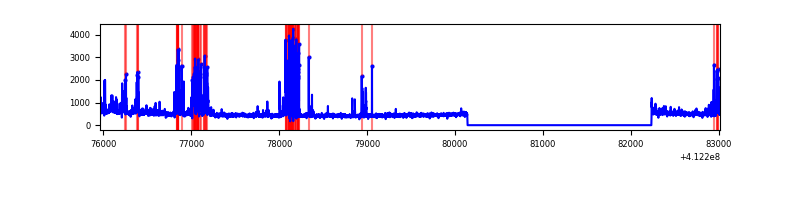 |
| C | 7049 | 4957 | 383 | 383 | 5.43% | 7.73% | 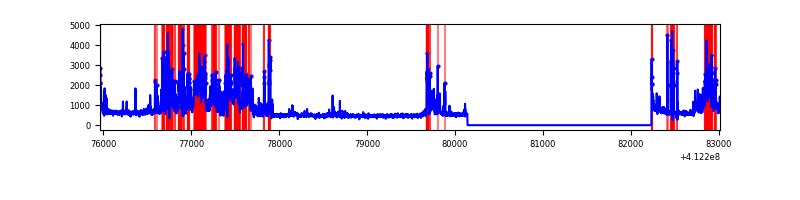 |
| D | 7049 | 4957 | 265 | 265 | 3.76% | 5.35% | 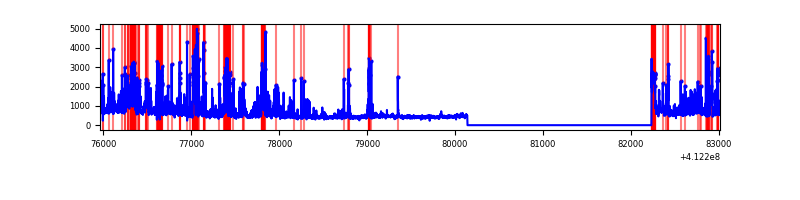 |
Top three noisy pixels from each quadrant. If the there are fewer than three noisy pixels in the level2.evt file, extra rows are filled as -1
| Pixel properties | Quadrant properties | ||||||
|---|---|---|---|---|---|---|---|
| Quadrant | DetID | PixID | Counts | Sigma | Mean | Median | Sigma |
| A | 10 | 83 | 437669 | 3767.28 | 579 | 570 | 116.0 |
| A | 6 | 10 | 386392 | 3325.33 | 579 | 570 | 116.0 |
| A | 15 | 222 | 83115 | 711.44 | 579 | 570 | 116.0 |
| B | 5 | 255 | 472714 | 4359.28 | 575 | 559 | 108.3 |
| B | 5 | 172 | 84408 | 774.16 | 575 | 559 | 108.3 |
| B | 0 | 186 | 13086 | 115.66 | 575 | 559 | 108.3 |
| C | 9 | 187 | 1660046 | 12879.59 | 564 | 570 | 128.8 |
| C | 15 | 214 | 216089 | 1672.69 | 564 | 570 | 128.8 |
| C | 15 | 208 | 207927 | 1609.35 | 564 | 570 | 128.8 |
| D | 13 | 249 | 570845 | 4252.16 | 557 | 543 | 134.1 |
| D | 2 | 249 | 307318 | 2287.31 | 557 | 543 | 134.1 |
| D | 12 | 227 | 228271 | 1697.94 | 557 | 543 | 134.1 |
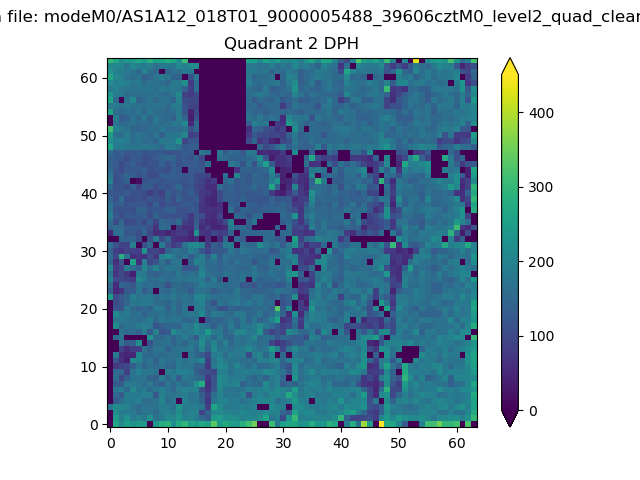
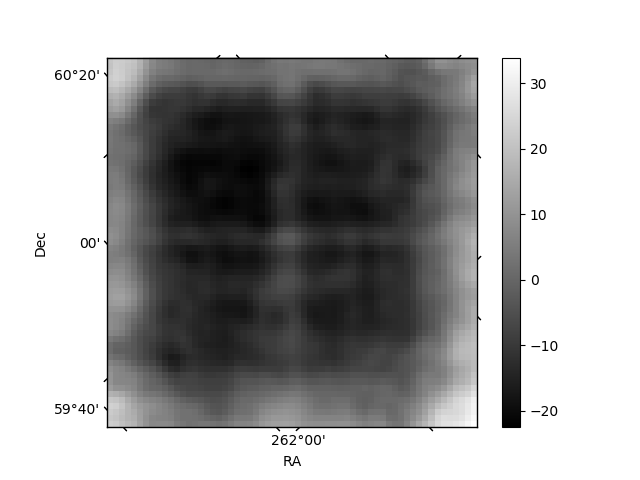
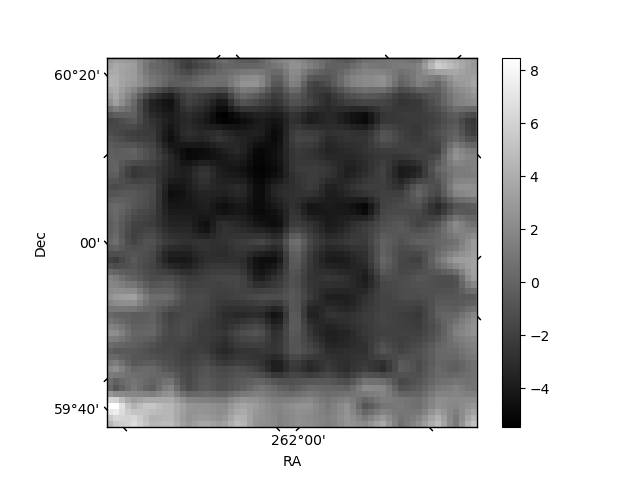
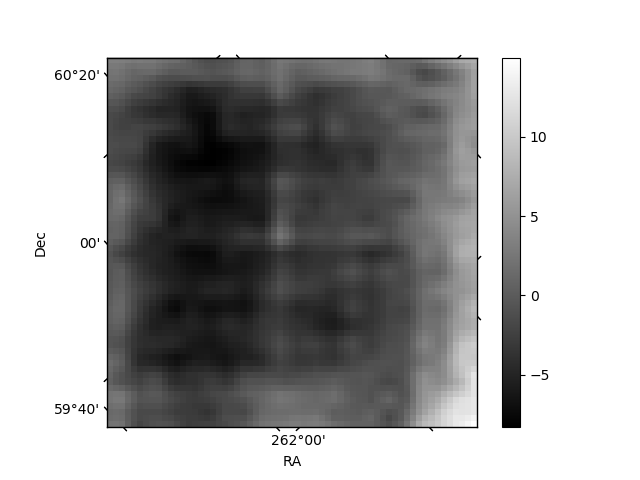
Histogram calculated using DETX and DETY for each event in the final _common_clean file
| Quadrant A | 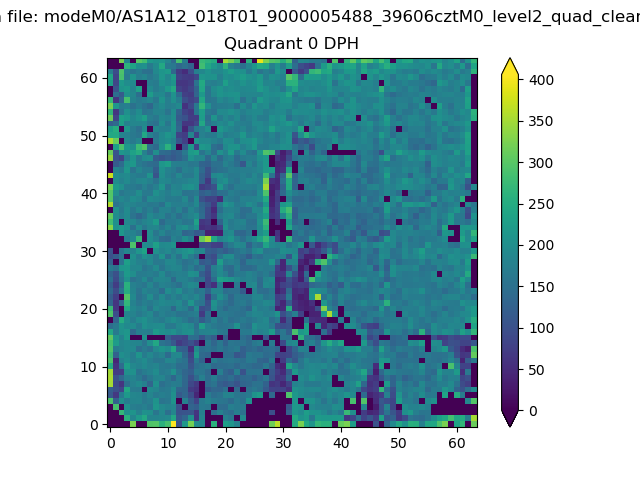 |
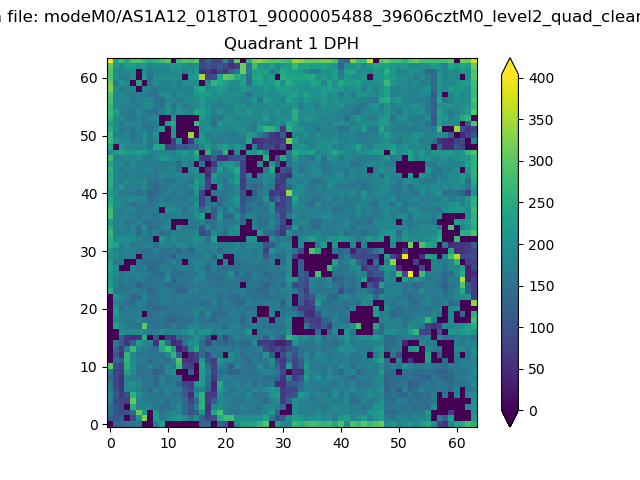 |
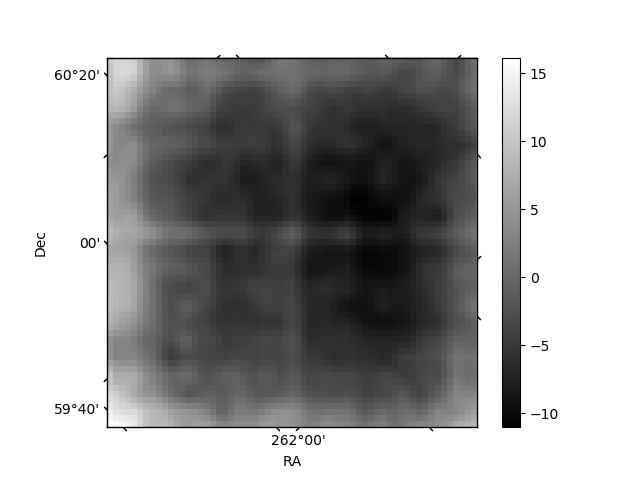
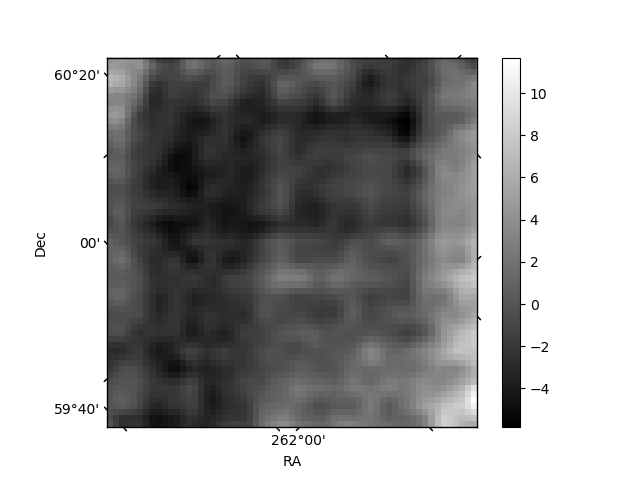
Quadrant B |
|---|---|---|---|
| Quadrant D | 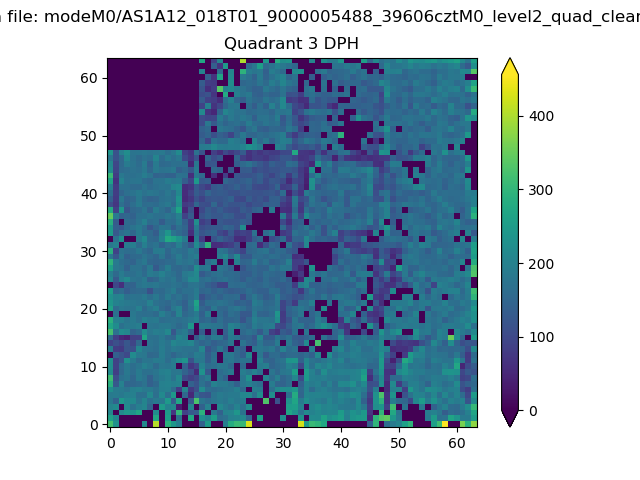 |
 |
Quadrant C |
| Plot type | Count rate plots | Images |
|---|---|---|
| Comparison with Poisson distribution Blue bars denote a histogram of data divided into 1 sec bins. Red curve is a Poisson curve with rate = median count rate of data. |
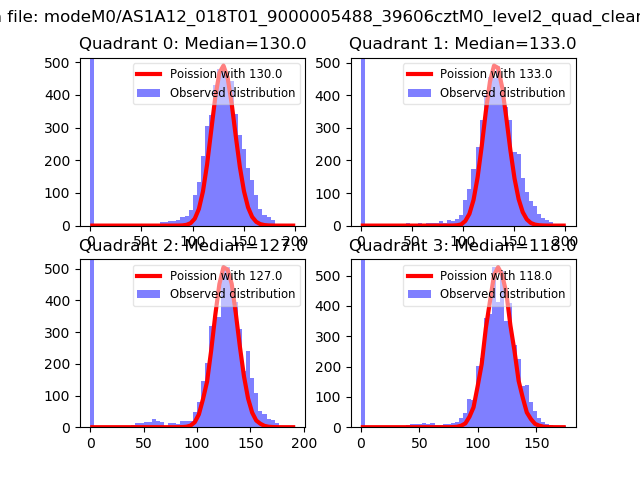 |
 |
| Quadrant-wise count rates Data is divided into 100 sec bins |
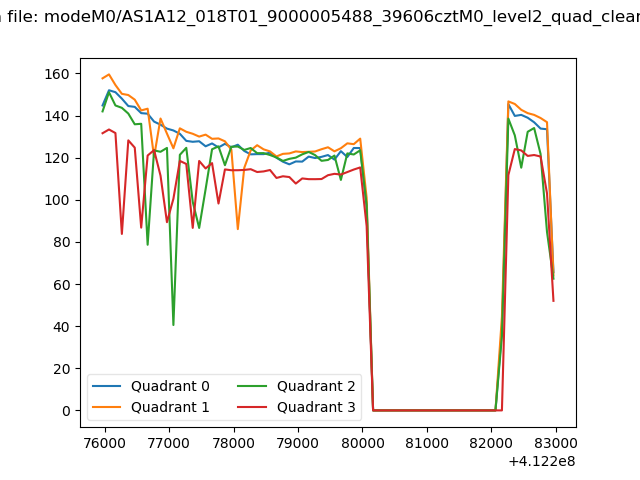 |
|
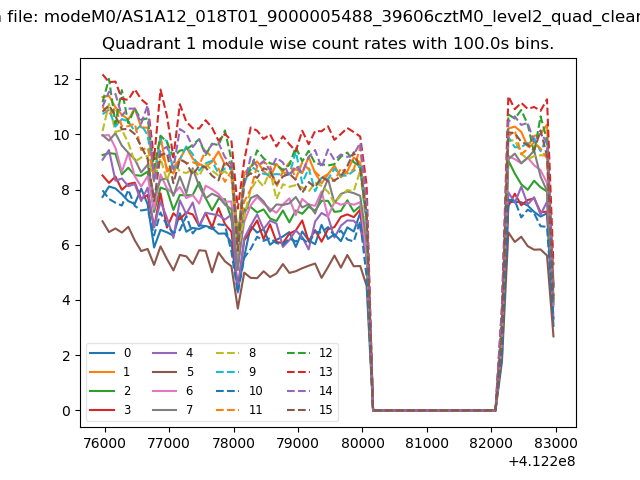
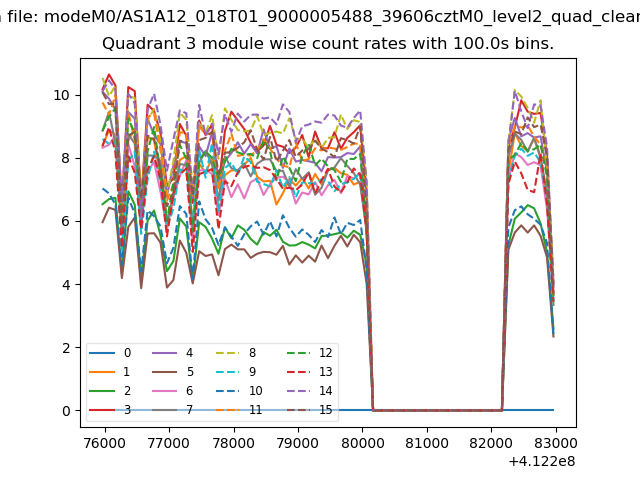
| Module-wise count rates for Quadrant A Data is divided into 100 sec bins |
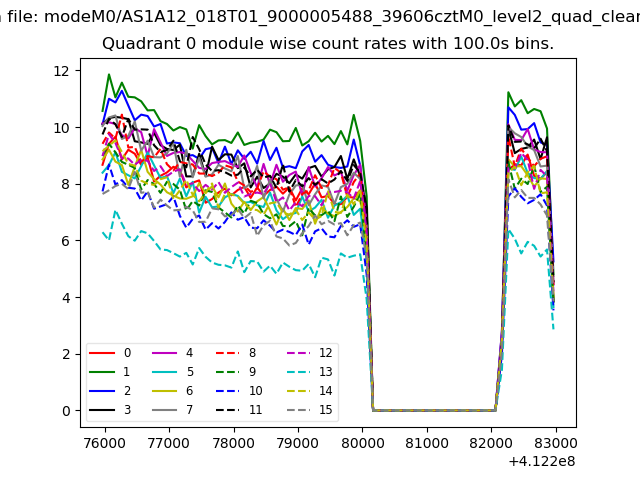 |
 |
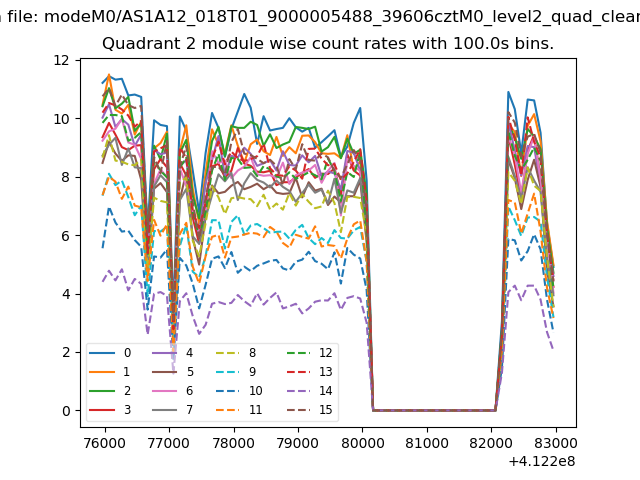
| Module-wise count rates for Quadrant B Data is divided into 100 sec bins |
 |
 |
| Module-wise count rates for Quadrant C Data is divided into 100 sec bins |
 |
 |
| Module-wise count rates for Quadrant D Data is divided into 100 sec bins |
 |
 |
| Parameter | Plot |
|---|---|
| CZT HV Monitor | 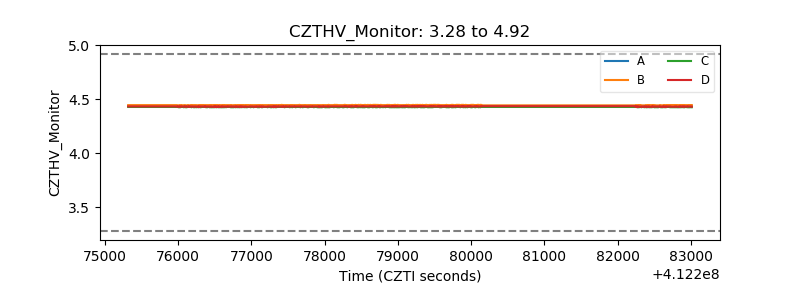 |
| D_VDD | 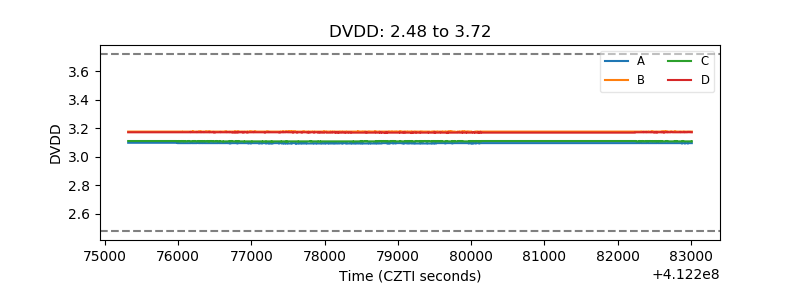 |
| Temperature 1 | 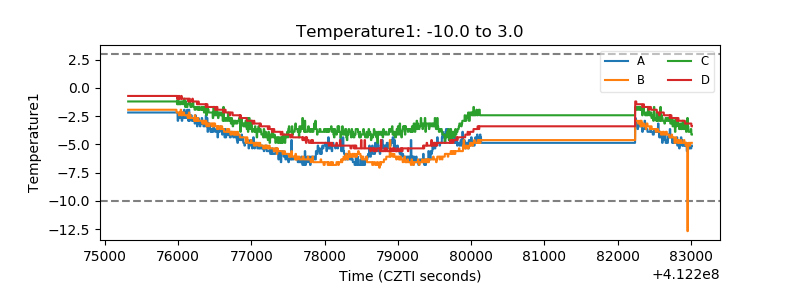 |
| Veto HV Monitor | 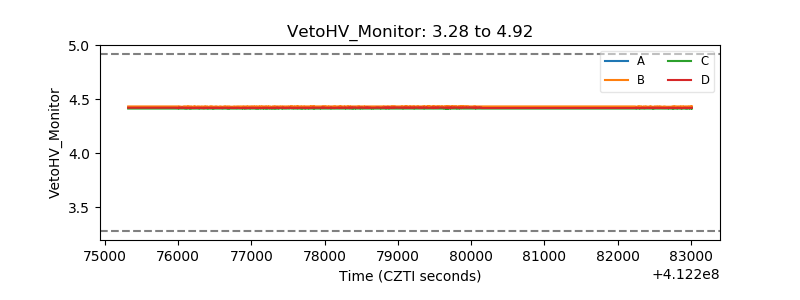 |
| Veto LLD | 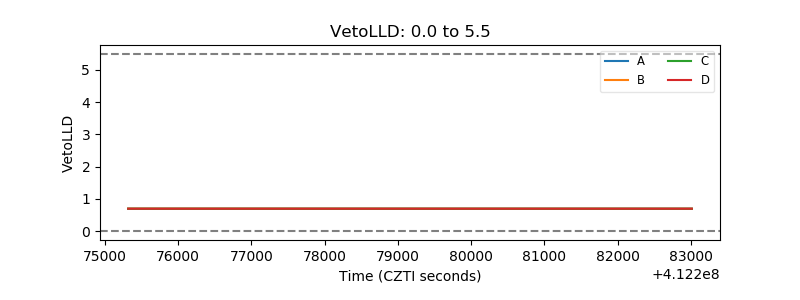 |
| Alpha Counter | 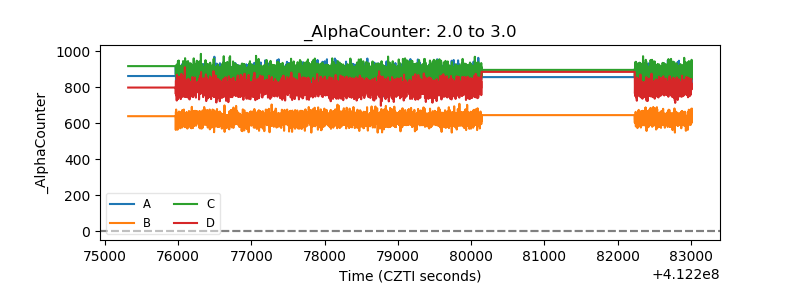 |
| _CPM_Rate | 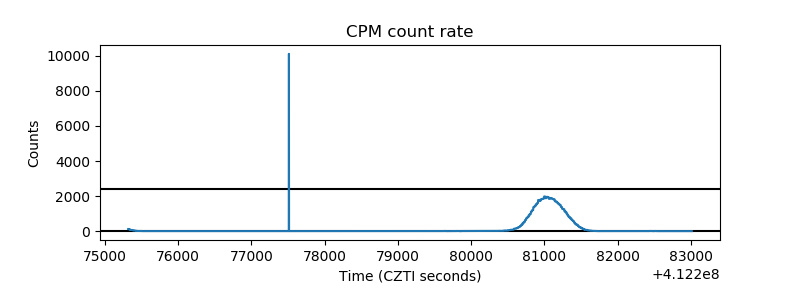 |
| CZT Counter | 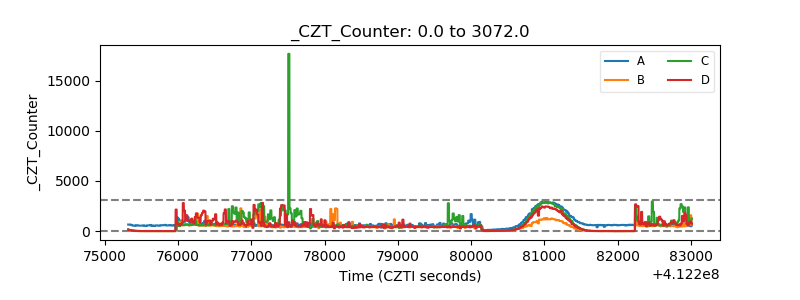 |
| +2.5 Volts monitor | 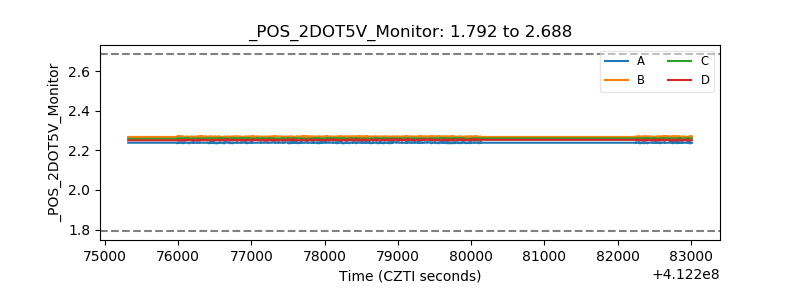 |
| +5 Volts monitor | 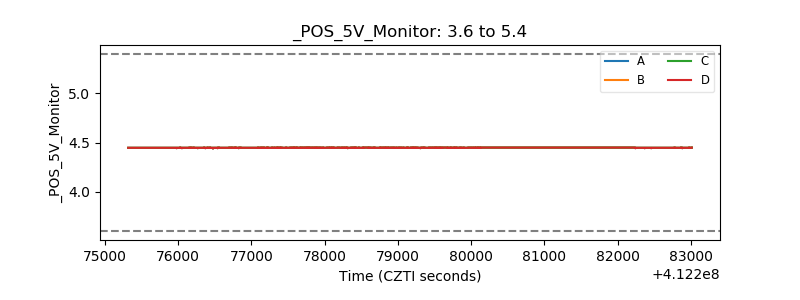 |
| _ROLL_ROT | 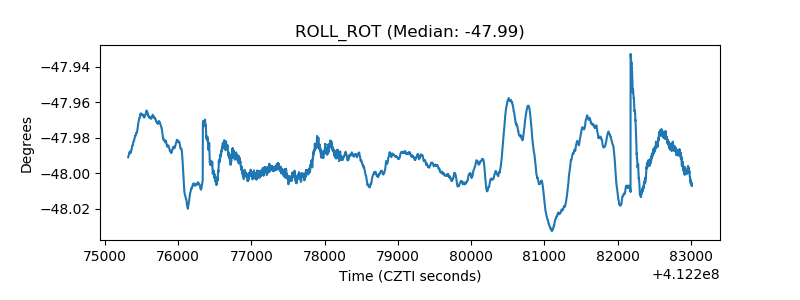 |
| _Roll_DEC | 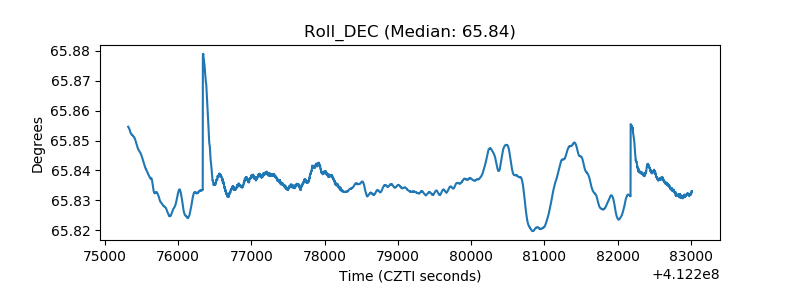 |
| _Roll_RA | 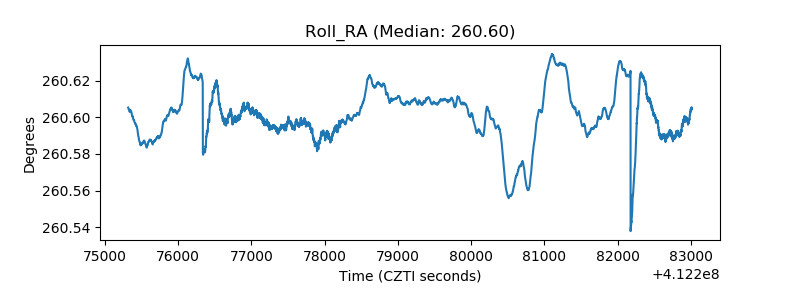 |
| Veto Counter |  |