| Param | Original file | Final file |
|---|---|---|
| Filename | modeM0/AS1A12_018T01_9000005488_39607cztM0_level2.fits | modeM0/AS1A12_018T01_9000005488_39607cztM0_level2_quad_clean.evt |
| Size (bytes) | 386,665,920 | 87,603,840 |
| Size | 368.8 MB | 83.5 MB |
| Events in quadrant A | 2,645,238 | 607,740 |
| Events in quadrant B | 2,489,235 | 622,137 |
| Events in quadrant C | 5,258,761 | 540,733 |
| Events in quadrant D | 3,537,036 | 537,158 |
| Mode SS | |||
|---|---|---|---|
| Quadrant | BADHDUFLAG | Total packets | Discarded packets |
| A | 0 | 100 | 0 |
| B | 0 | 100 | 0 |
| C | 0 | 100 | 0 |
| D | 0 | 100 | 0 |
| Mode M0 | |||
|---|---|---|---|
| Quadrant | BADHDUFLAG | Total packets | Discarded packets |
| A | 0 | 10992 | 3 |
| B | 0 | 10750 | 2 |
| C | 0 | 19010 | 2 |
| D | 0 | 13946 | 2 |
| Mode M9 | |||
|---|---|---|---|
| Quadrant | BADHDUFLAG | Total packets | Discarded packets |
| A | 0 | 31 | 0 |
| B | 0 | 31 | 0 |
| C | 0 | 31 | 0 |
| D | 0 | 32 | 0 |
| Quadrant | Total seconds | Saturated seconds | Saturation percentage |
|---|---|---|---|
| A | 4921 | 26 | 0.528348% |
| B | 4921 | 65 | 1.320870% |
| C | 4921 | 679 | 13.798009% |
| D | 4921 | 245 | 4.978663% |
Noise dominated data is calculated using 1-second bins in cleaned event files. If a bin has >2000 counts, and if more than 50% of those come from <1% of pixels, then it is considered to be noise-dominated and hence unusable.
| Quadrant | # 1 sec bins | Bins with >0 counts | Bins with >2000 counts | High rate bins dominated by noise | Noise dominated (total time) | Noise dominated (detector-on time) | Marked lightcurve |
|---|---|---|---|---|---|---|---|
| A | 7043 | 4922 | 13 | 13 | 0.18% | 0.26% | 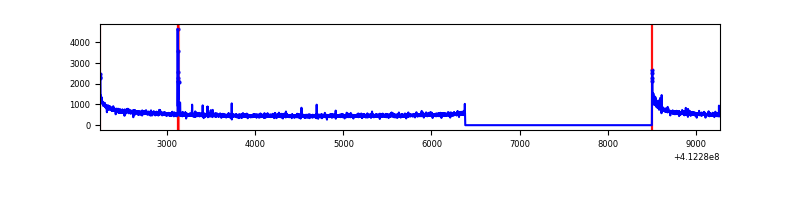 |
| B | 7043 | 4922 | 31 | 31 | 0.44% | 0.63% | 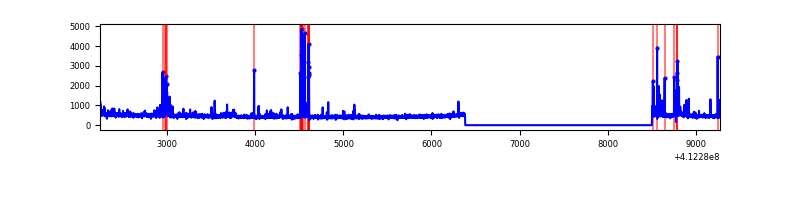 |
| C | 7043 | 4922 | 638 | 638 | 9.06% | 12.96% | 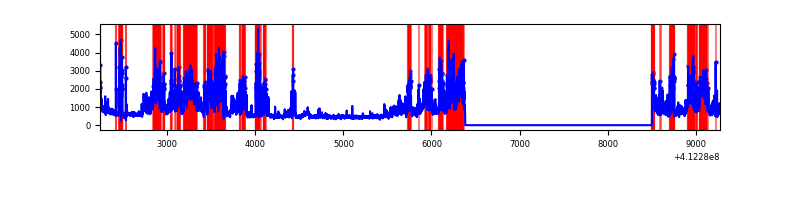 |
| D | 7043 | 4922 | 236 | 236 | 3.35% | 4.79% | 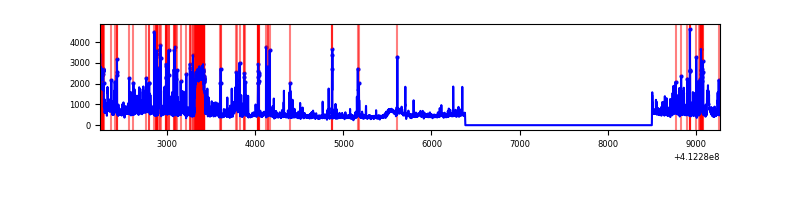 |
Top three noisy pixels from each quadrant. If the there are fewer than three noisy pixels in the level2.evt file, extra rows are filled as -1
| Pixel properties | Quadrant properties | ||||||
|---|---|---|---|---|---|---|---|
| Quadrant | DetID | PixID | Counts | Sigma | Mean | Median | Sigma |
| A | 10 | 83 | 424019 | 3781.44 | 555 | 545 | 112.0 |
| A | 15 | 174 | 30013 | 263.14 | 555 | 545 | 112.0 |
| A | 0 | 8 | 17131 | 148.11 | 555 | 545 | 112.0 |
| B | 5 | 255 | 240683 | 2281.27 | 554 | 539 | 105.3 |
| B | 5 | 172 | 78984 | 745.2 | 554 | 539 | 105.3 |
| B | 12 | 111 | 12584 | 114.42 | 554 | 539 | 105.3 |
| C | 9 | 187 | 2497421 | 20336.2 | 528 | 532 | 122.8 |
| C | 15 | 208 | 429015 | 3489.83 | 528 | 532 | 122.8 |
| C | 15 | 214 | 210539 | 1710.43 | 528 | 532 | 122.8 |
| D | 2 | 249 | 437064 | 3367.6 | 537 | 523 | 129.6 |
| D | 13 | 249 | 339432 | 2614.44 | 537 | 523 | 129.6 |
| D | 12 | 227 | 214155 | 1648.02 | 537 | 523 | 129.6 |
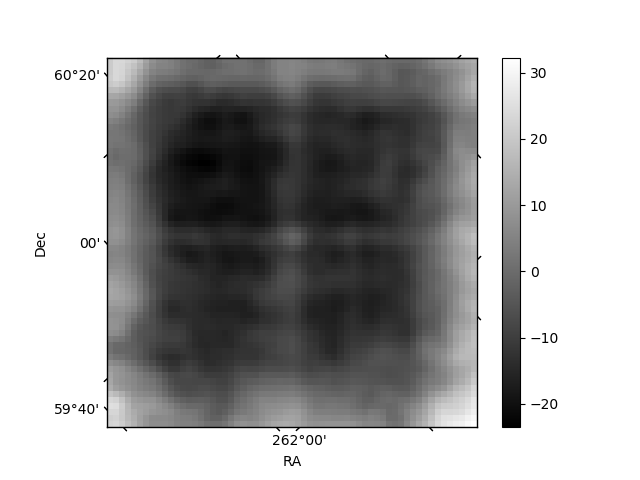
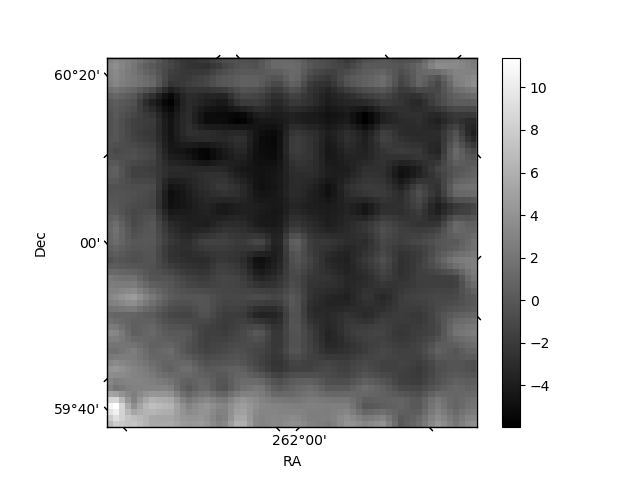
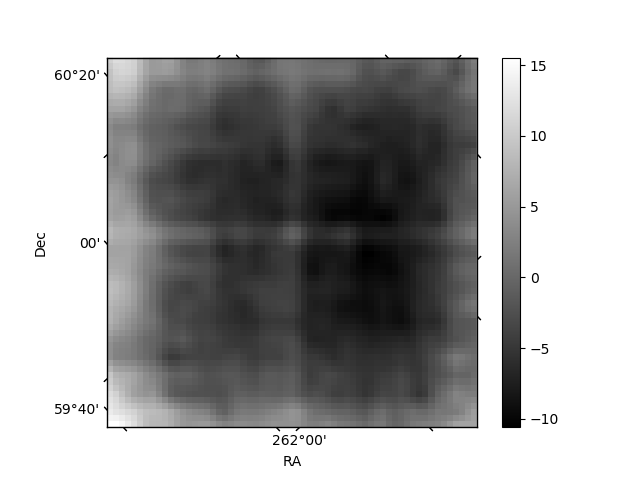
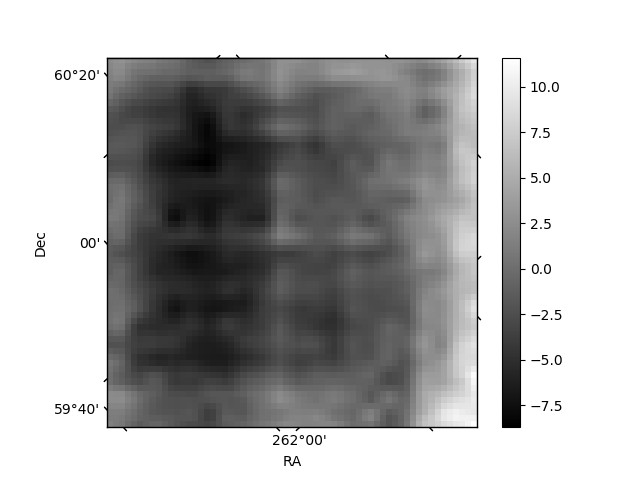
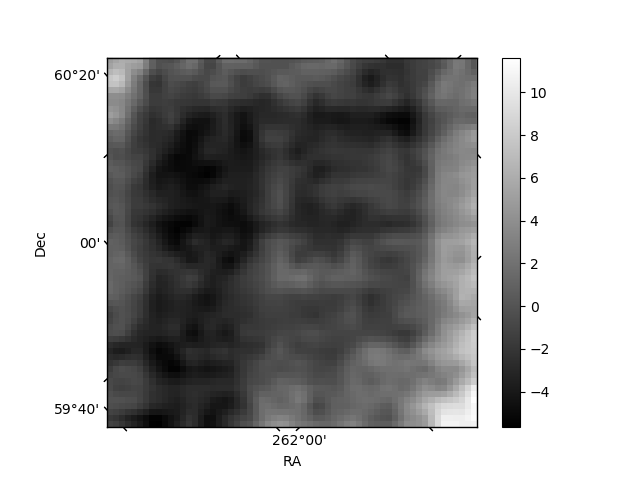
Histogram calculated using DETX and DETY for each event in the final _common_clean file
| Quadrant A | 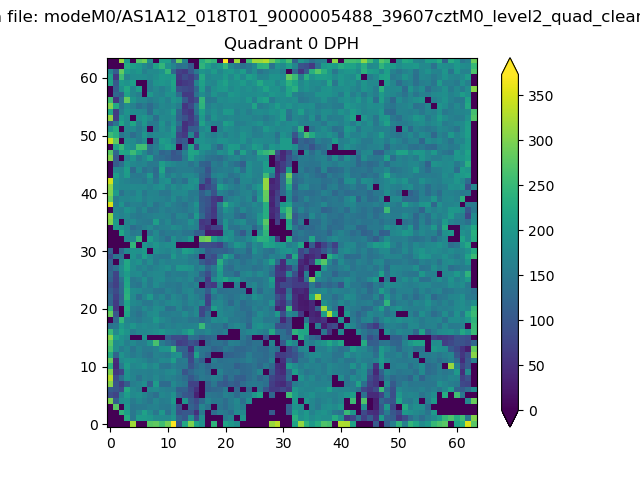 |
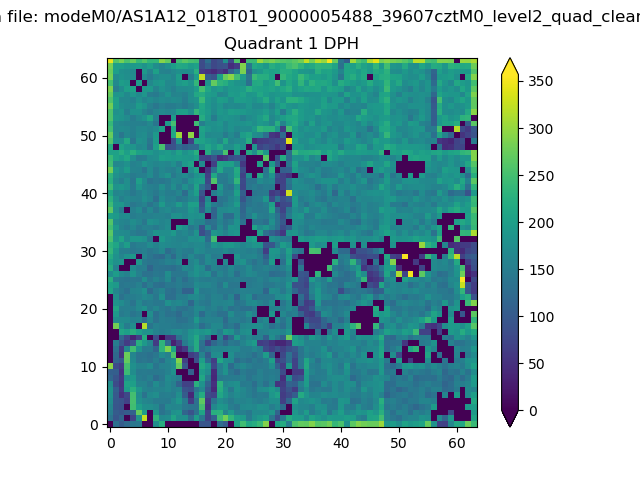 |
Quadrant B |
|---|---|---|---|
| Quadrant D | 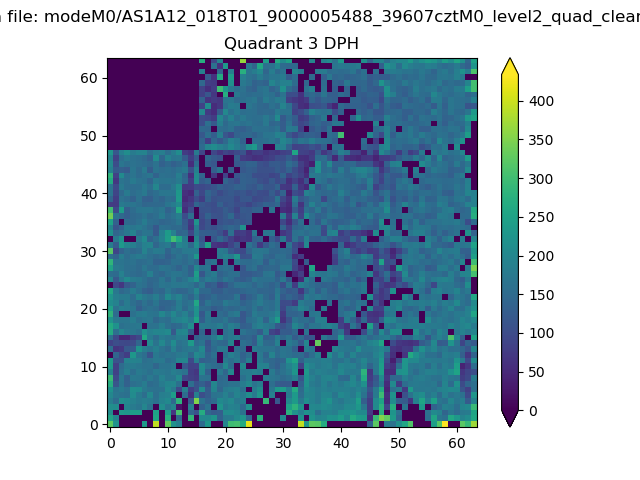 |
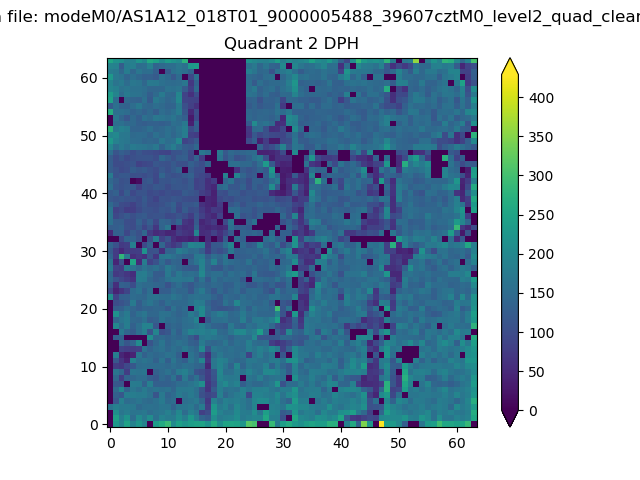 |
Quadrant C |
| Plot type | Count rate plots | Images |
|---|---|---|
| Comparison with Poisson distribution Blue bars denote a histogram of data divided into 1 sec bins. Red curve is a Poisson curve with rate = median count rate of data. |
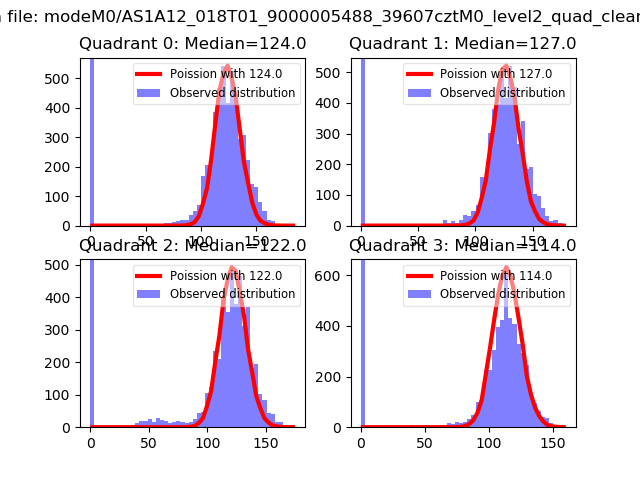 |
 |
| Quadrant-wise count rates Data is divided into 100 sec bins |
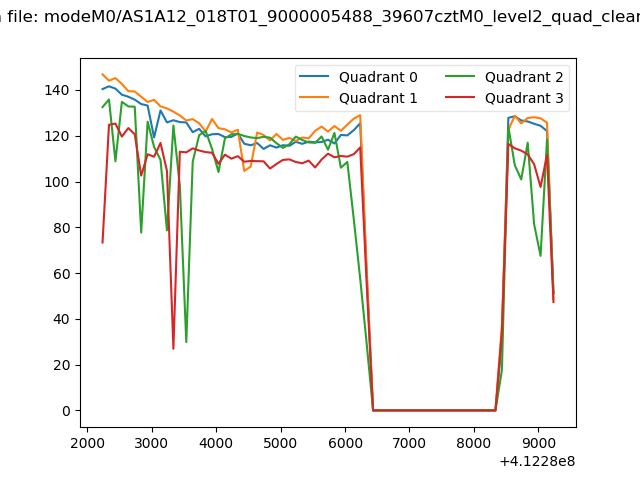 |
|
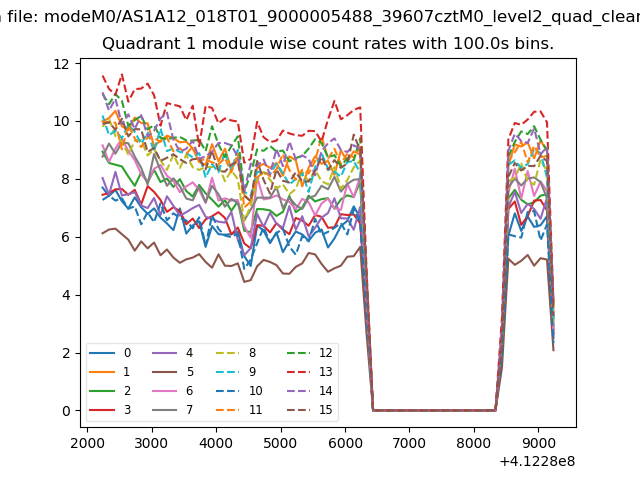
| Module-wise count rates for Quadrant A Data is divided into 100 sec bins |
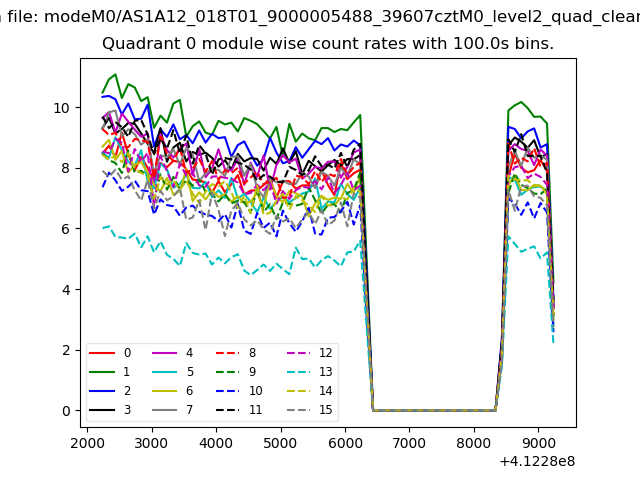 |
 |
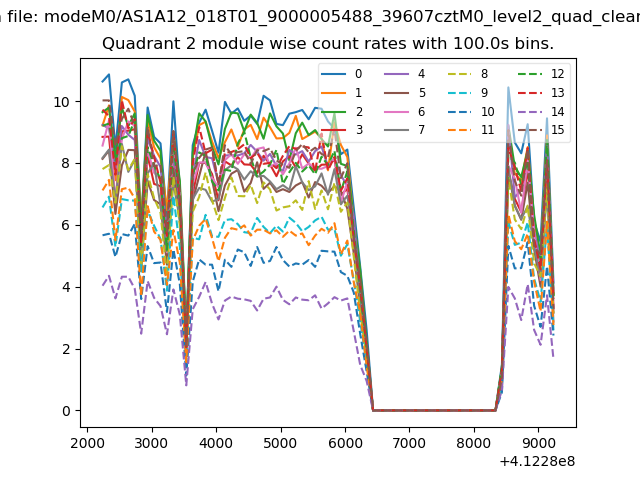
| Module-wise count rates for Quadrant B Data is divided into 100 sec bins |
 |
 |
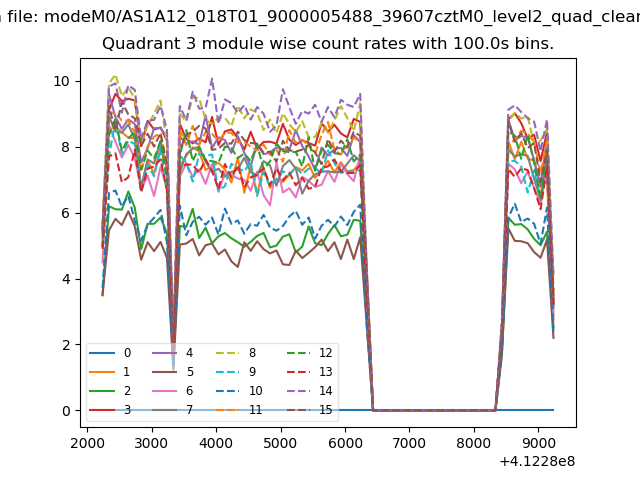
| Module-wise count rates for Quadrant C Data is divided into 100 sec bins |
 |
 |
| Module-wise count rates for Quadrant D Data is divided into 100 sec bins |
 |
 |
| Parameter | Plot |
|---|---|
| CZT HV Monitor | 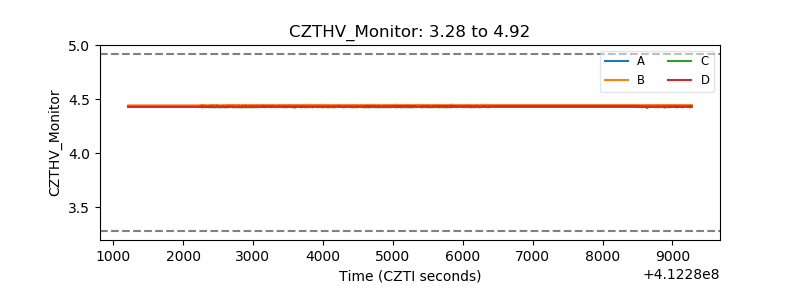 |
| D_VDD | 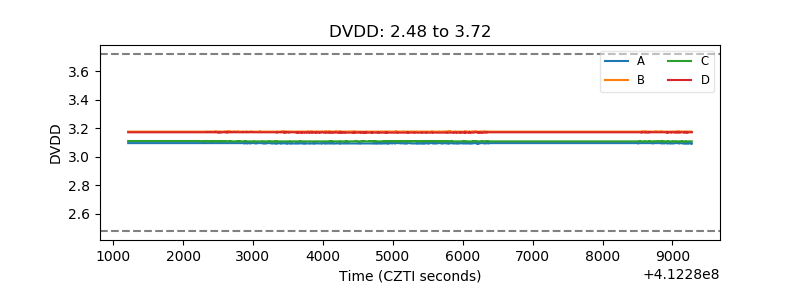 |
| Temperature 1 | 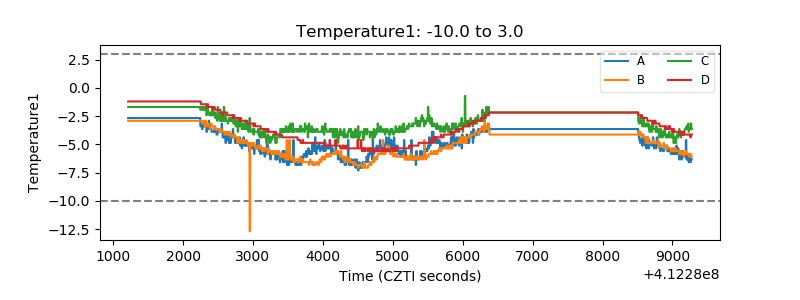 |
| Veto HV Monitor | 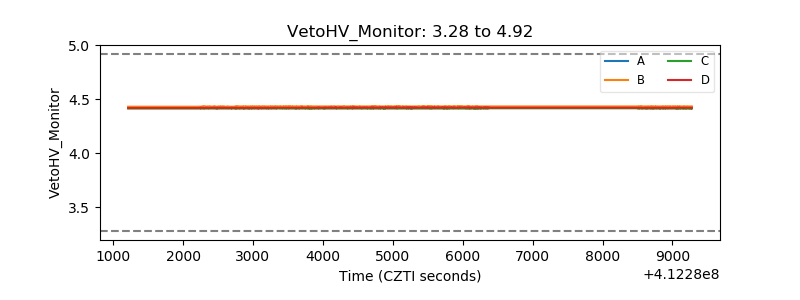 |
| Veto LLD | 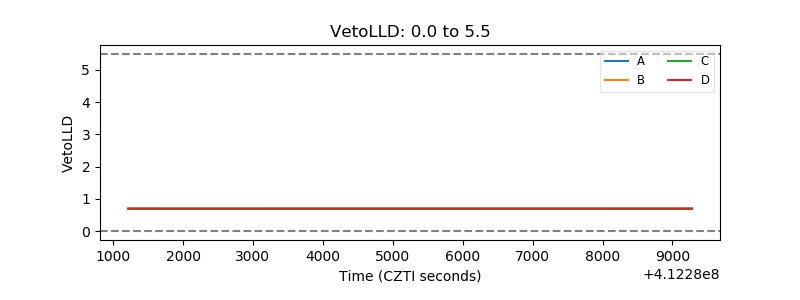 |
| Alpha Counter | 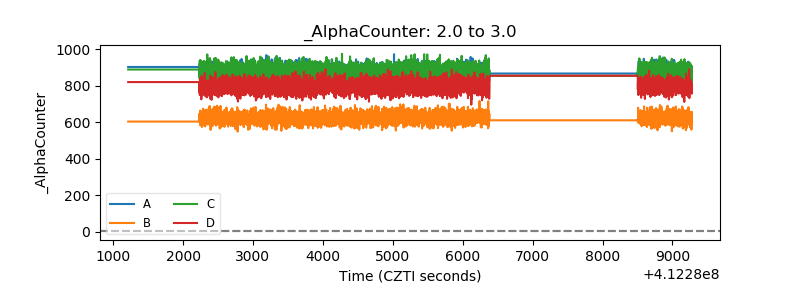 |
| _CPM_Rate | 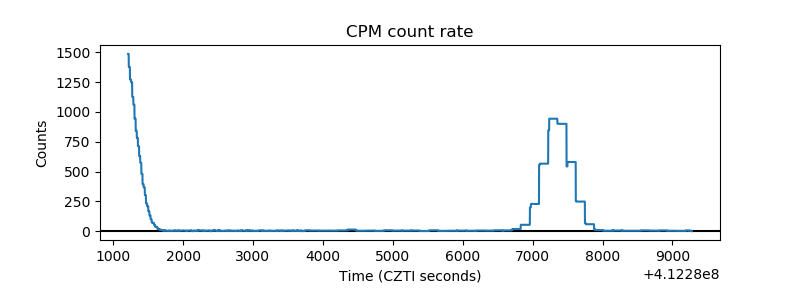 |
| CZT Counter | 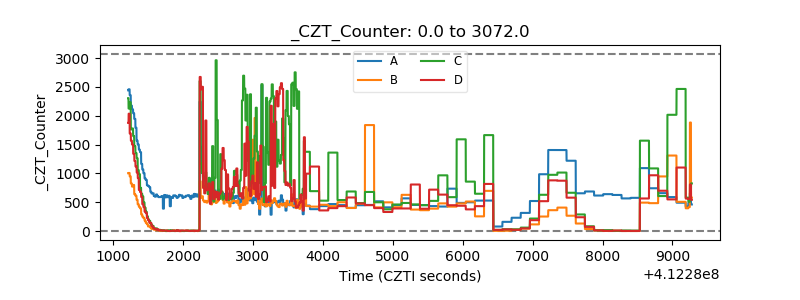 |
| +2.5 Volts monitor | 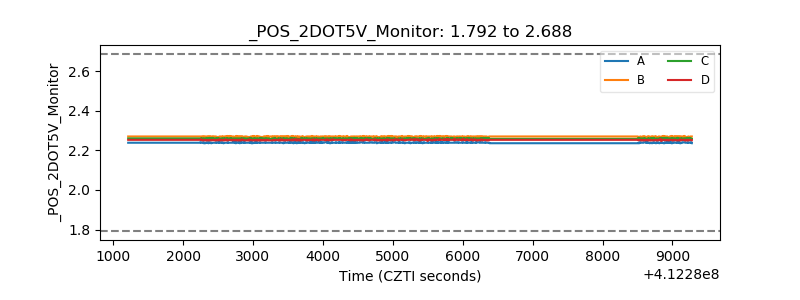 |
| +5 Volts monitor | 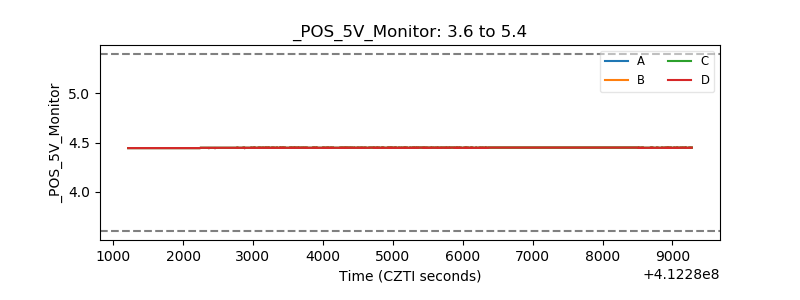 |
| _ROLL_ROT | 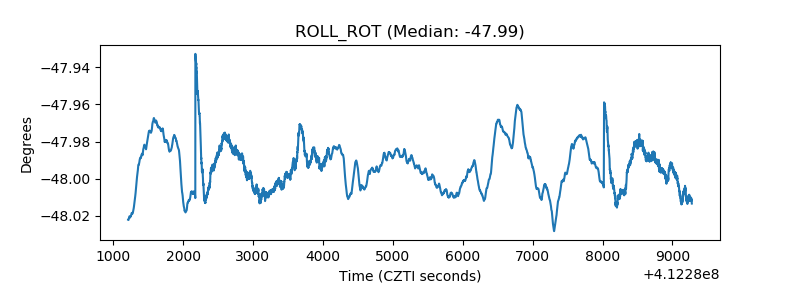 |
| _Roll_DEC | 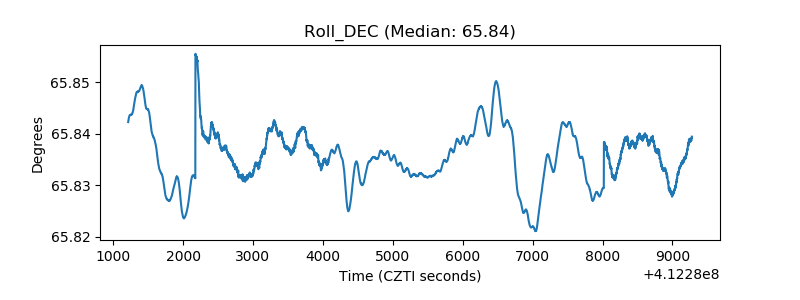 |
| _Roll_RA | 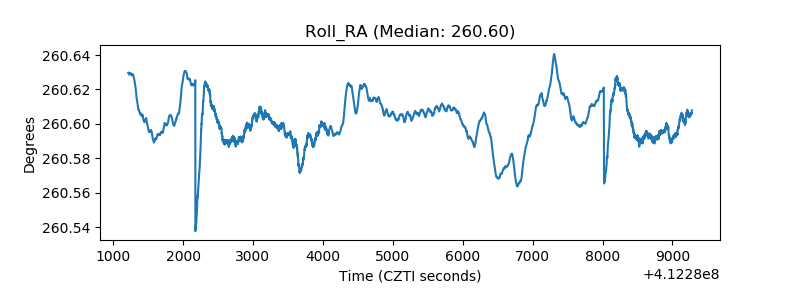 |
| Veto Counter | 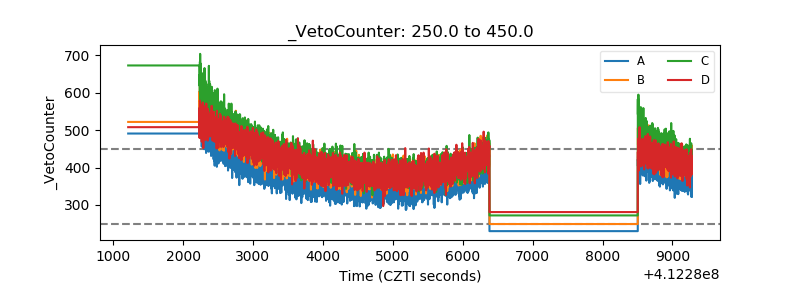 |