| Param | Original file | Final file |
|---|---|---|
| Filename | modeM0/AS1A12_018T01_9000005488_39608cztM0_level2.fits | modeM0/AS1A12_018T01_9000005488_39608cztM0_level2_quad_clean.evt |
| Size (bytes) | 352,431,360 | 84,945,600 |
| Size | 336.1 MB | 81.0 MB |
| Events in quadrant A | 2,572,704 | 575,156 |
| Events in quadrant B | 2,490,403 | 587,540 |
| Events in quadrant C | 4,757,422 | 538,196 |
| Events in quadrant D | 2,840,092 | 523,962 |
| Mode SS | |||
|---|---|---|---|
| Quadrant | BADHDUFLAG | Total packets | Discarded packets |
| A | 0 | 102 | 0 |
| B | 0 | 102 | 0 |
| C | 0 | 102 | 0 |
| D | 0 | 102 | 0 |
| Mode M0 | |||
|---|---|---|---|
| Quadrant | BADHDUFLAG | Total packets | Discarded packets |
| A | 0 | 10800 | 3 |
| B | 0 | 10932 | 2 |
| C | 0 | 17690 | 2 |
| D | 0 | 11947 | 2 |
| Mode M9 | |||
|---|---|---|---|
| Quadrant | BADHDUFLAG | Total packets | Discarded packets |
| A | 0 | 33 | 0 |
| B | 0 | 33 | 0 |
| C | 0 | 33 | 0 |
| D | 0 | 34 | 0 |
| Quadrant | Total seconds | Saturated seconds | Saturation percentage |
|---|---|---|---|
| A | 4949 | 15 | 0.303092% |
| B | 4949 | 71 | 1.434633% |
| C | 4949 | 430 | 8.688624% |
| D | 4949 | 80 | 1.616488% |
Noise dominated data is calculated using 1-second bins in cleaned event files. If a bin has >2000 counts, and if more than 50% of those come from <1% of pixels, then it is considered to be noise-dominated and hence unusable.
| Quadrant | # 1 sec bins | Bins with >0 counts | Bins with >2000 counts | High rate bins dominated by noise | Noise dominated (total time) | Noise dominated (detector-on time) | Marked lightcurve |
|---|---|---|---|---|---|---|---|
| A | 7011 | 4950 | 9 | 9 | 0.13% | 0.18% | 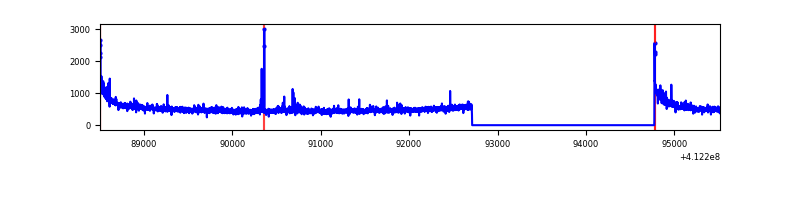 |
| B | 7011 | 4950 | 42 | 42 | 0.60% | 0.85% | 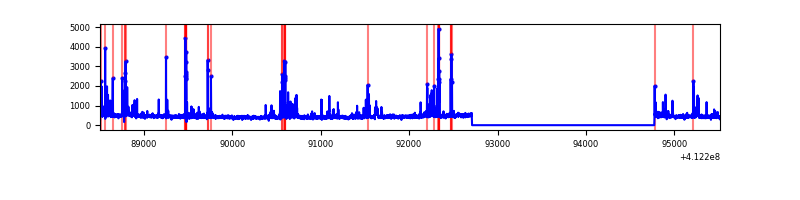 |
| C | 7011 | 4950 | 400 | 400 | 5.71% | 8.08% | 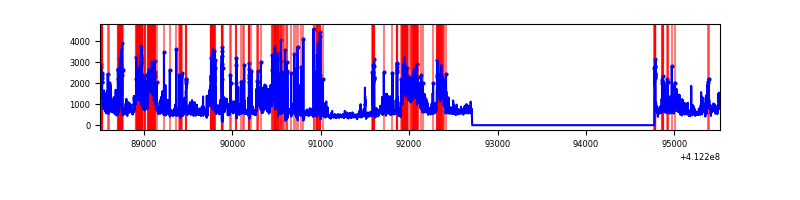 |
| D | 7011 | 4950 | 71 | 71 | 1.01% | 1.43% | 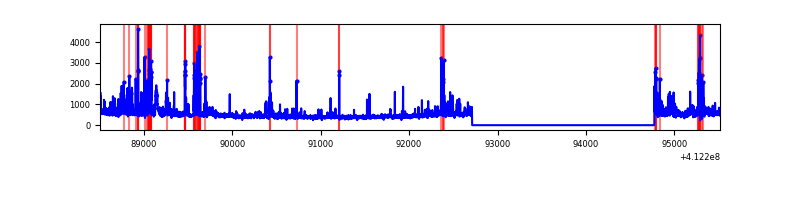 |
Top three noisy pixels from each quadrant. If the there are fewer than three noisy pixels in the level2.evt file, extra rows are filled as -1
| Pixel properties | Quadrant properties | ||||||
|---|---|---|---|---|---|---|---|
| Quadrant | DetID | PixID | Counts | Sigma | Mean | Median | Sigma |
| A | 10 | 83 | 411659 | 3796.67 | 535 | 525 | 108.3 |
| A | 0 | 8 | 45319 | 413.66 | 535 | 525 | 108.3 |
| A | 13 | 248 | 21390 | 192.68 | 535 | 525 | 108.3 |
| B | 5 | 255 | 318625 | 3098.1 | 534 | 519 | 102.7 |
| B | 5 | 172 | 76423 | 739.24 | 534 | 519 | 102.7 |
| B | 12 | 111 | 12562 | 117.29 | 534 | 519 | 102.7 |
| C | 9 | 187 | 1887922 | 15745.15 | 516 | 519 | 119.9 |
| C | 15 | 208 | 603464 | 5029.9 | 516 | 519 | 119.9 |
| C | 15 | 214 | 216396 | 1800.9 | 516 | 519 | 119.9 |
| D | 2 | 249 | 225522 | 1766.59 | 523 | 508 | 127.4 |
| D | 12 | 227 | 165657 | 1296.59 | 523 | 508 | 127.4 |
| D | 13 | 249 | 124446 | 973.04 | 523 | 508 | 127.4 |
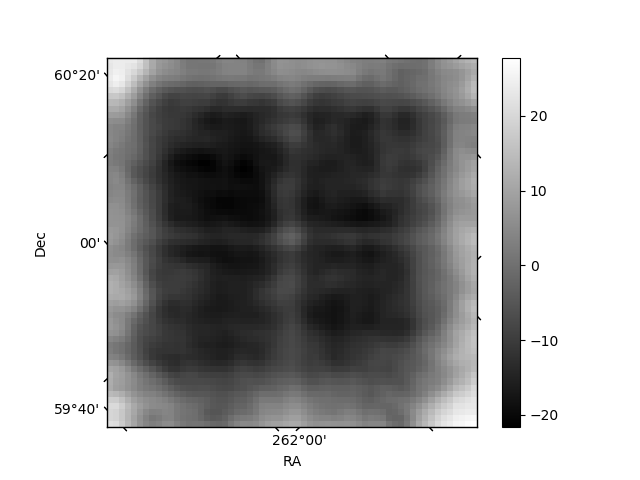
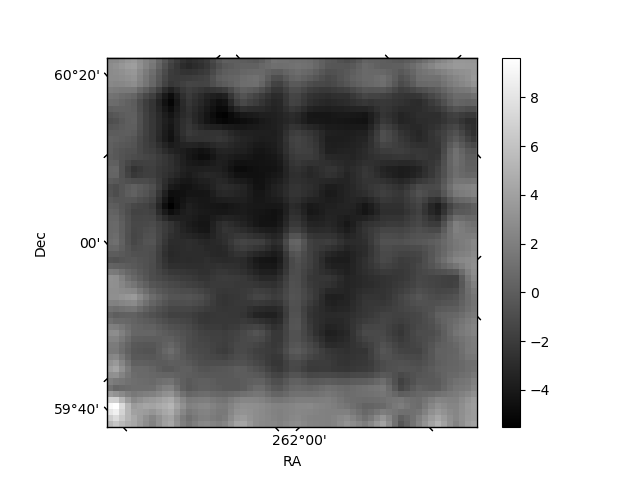
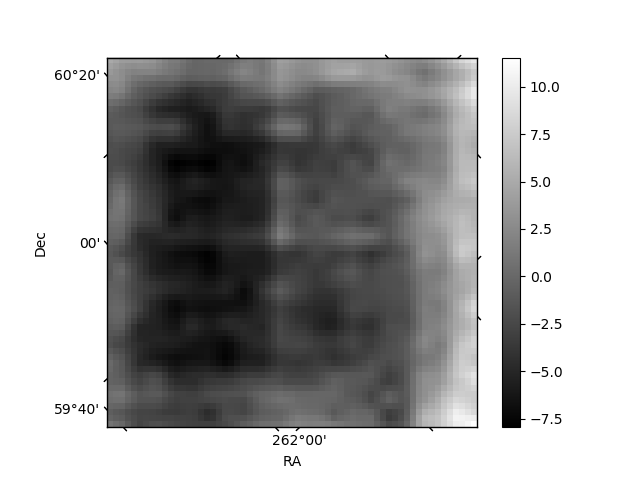
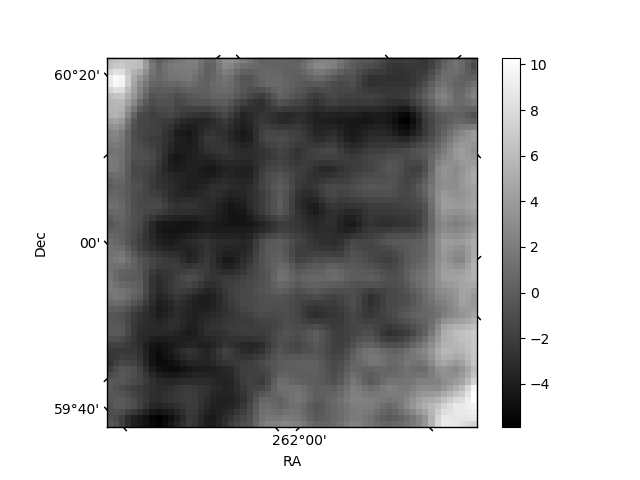
Histogram calculated using DETX and DETY for each event in the final _common_clean file
| Quadrant A | 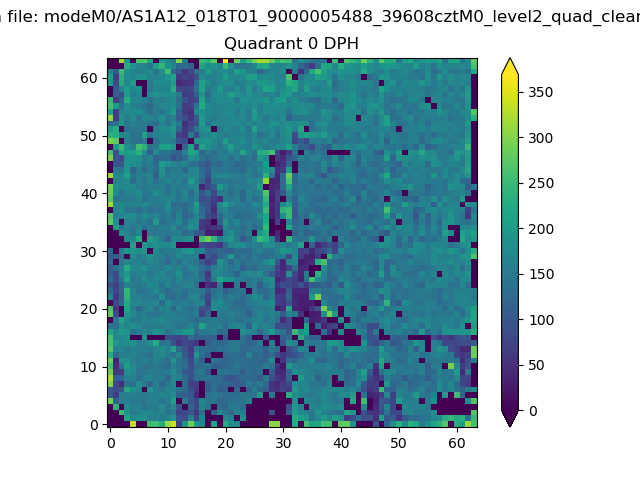 |
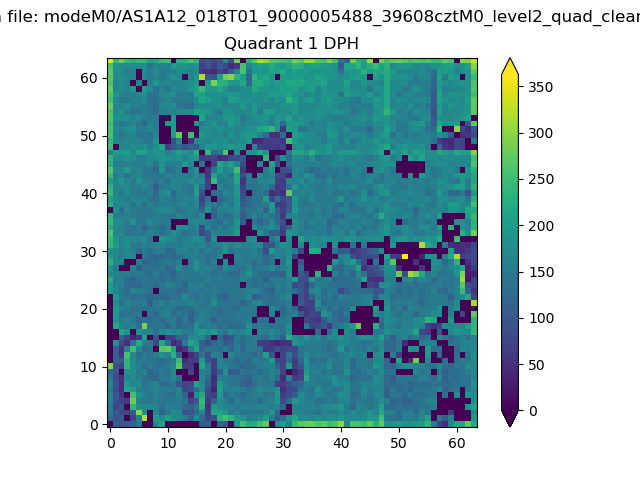 |
Quadrant B |
|---|---|---|---|
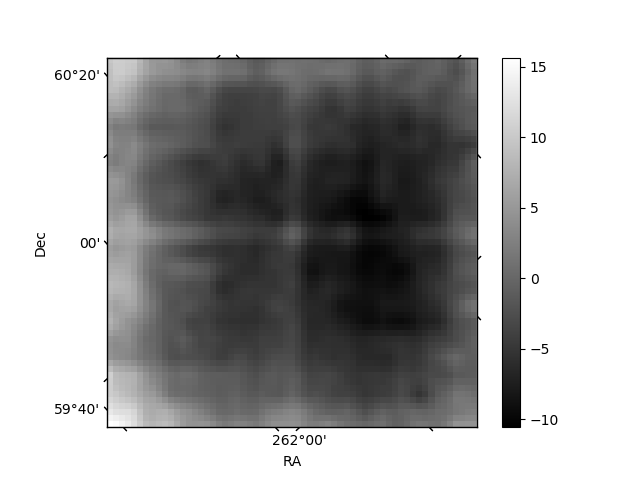
| Quadrant D | 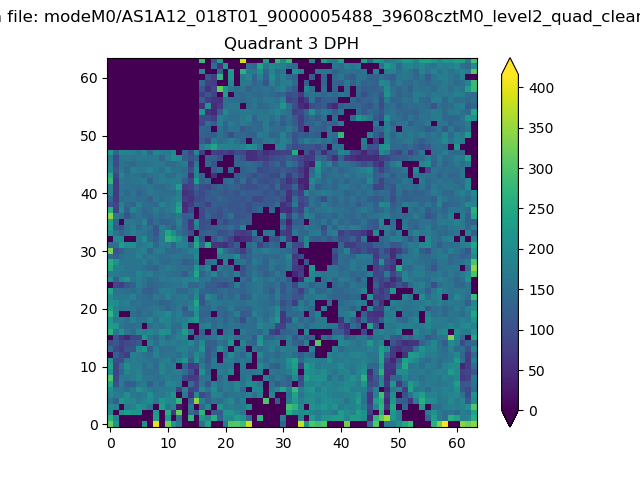 |
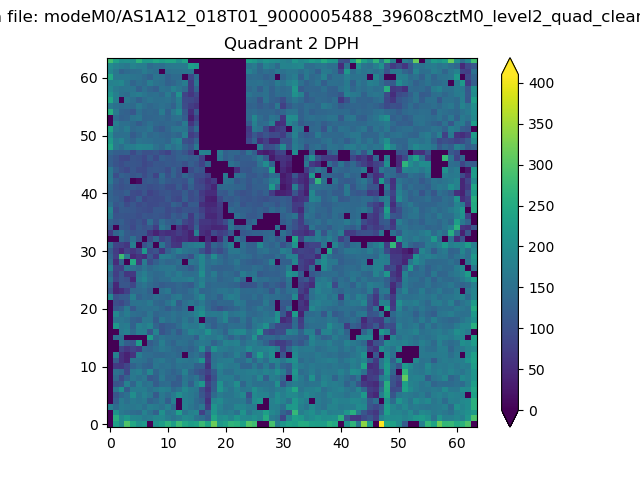 |
Quadrant C |
| Plot type | Count rate plots | Images |
|---|---|---|
| Comparison with Poisson distribution Blue bars denote a histogram of data divided into 1 sec bins. Red curve is a Poisson curve with rate = median count rate of data. |
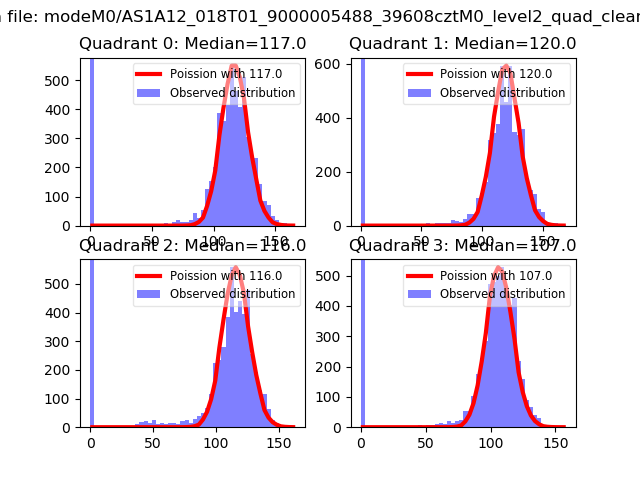 |
 |
| Quadrant-wise count rates Data is divided into 100 sec bins |
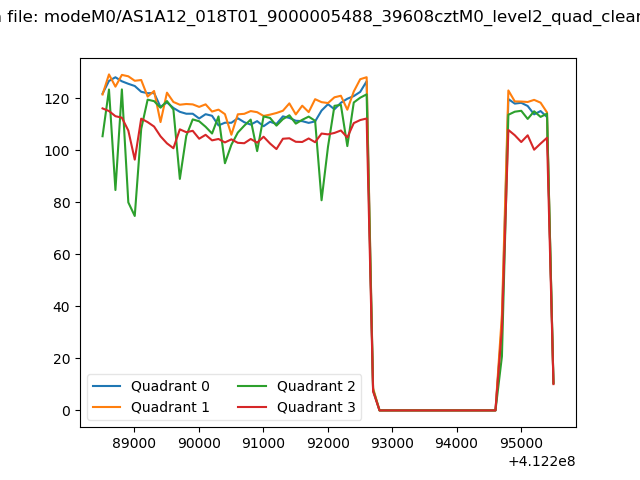 |
|
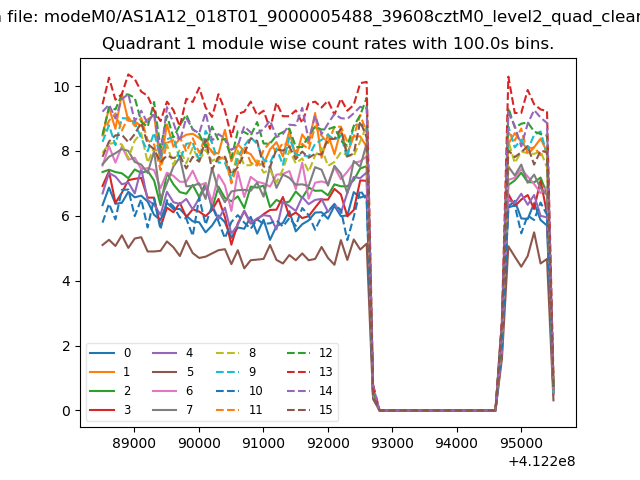
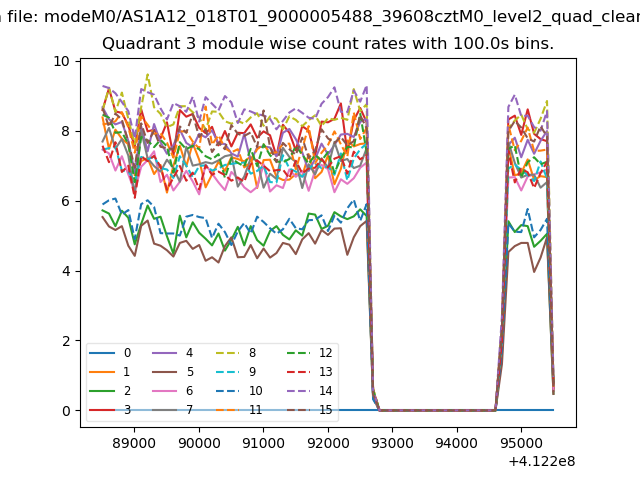
| Module-wise count rates for Quadrant A Data is divided into 100 sec bins |
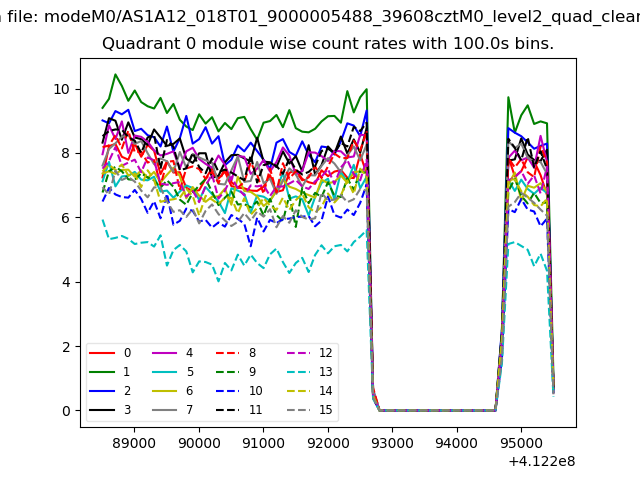 |
 |
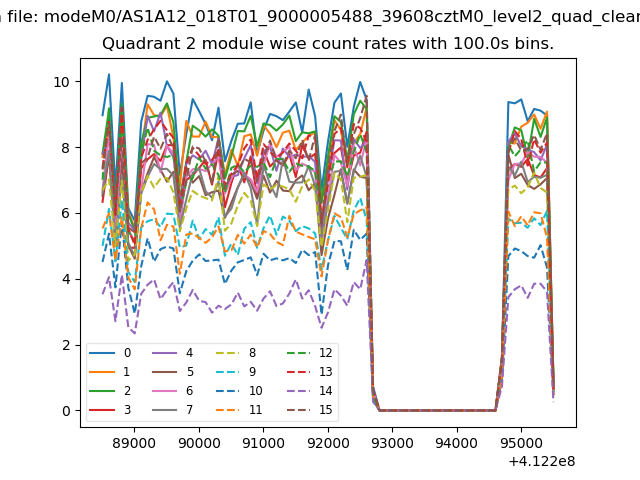
| Module-wise count rates for Quadrant B Data is divided into 100 sec bins |
 |
 |
| Module-wise count rates for Quadrant C Data is divided into 100 sec bins |
 |
 |
| Module-wise count rates for Quadrant D Data is divided into 100 sec bins |
 |
 |
| Parameter | Plot |
|---|---|
| CZT HV Monitor |  |
| D_VDD | 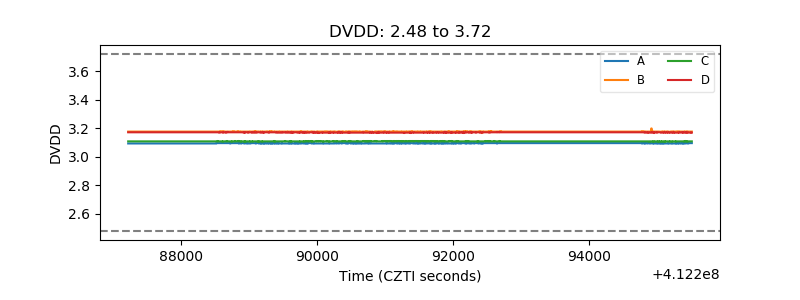 |
| Temperature 1 | 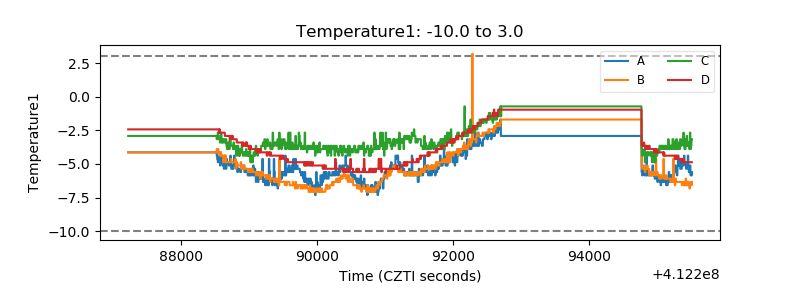 |
| Veto HV Monitor | 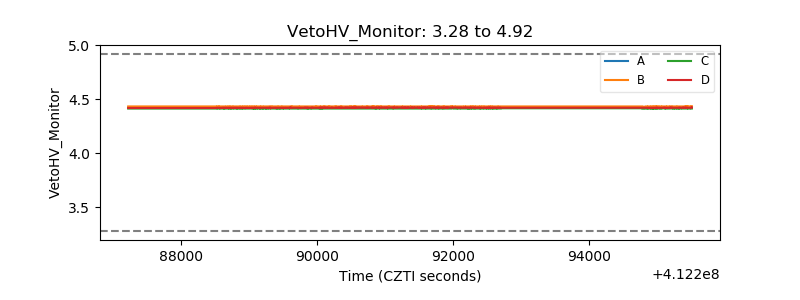 |
| Veto LLD | 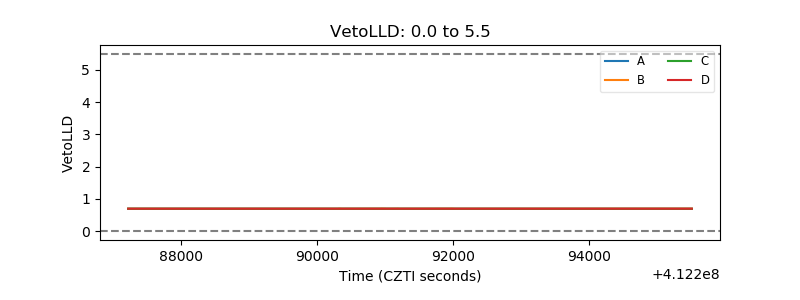 |
| Alpha Counter | 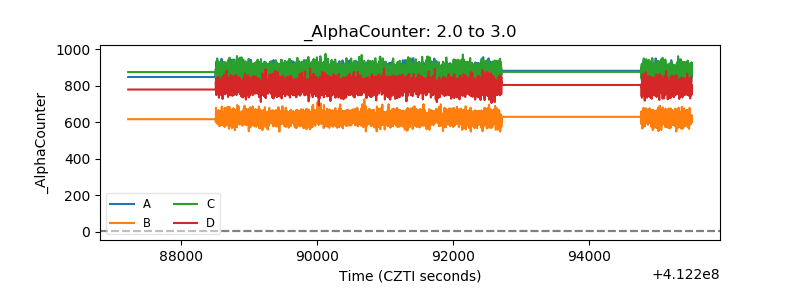 |
| _CPM_Rate | 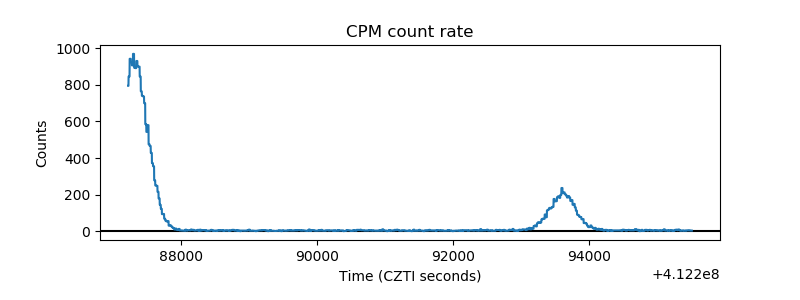 |
| CZT Counter | 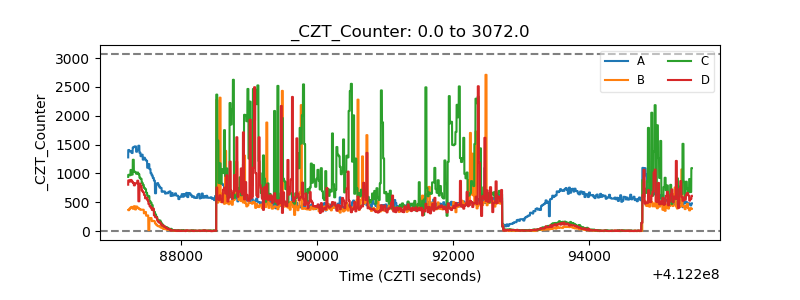 |
| +2.5 Volts monitor | 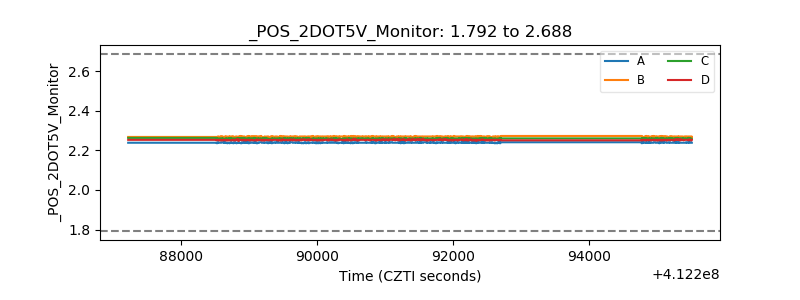 |
| +5 Volts monitor | 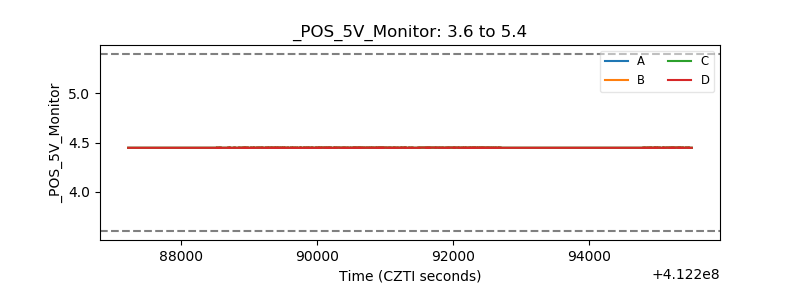 |
| _ROLL_ROT | 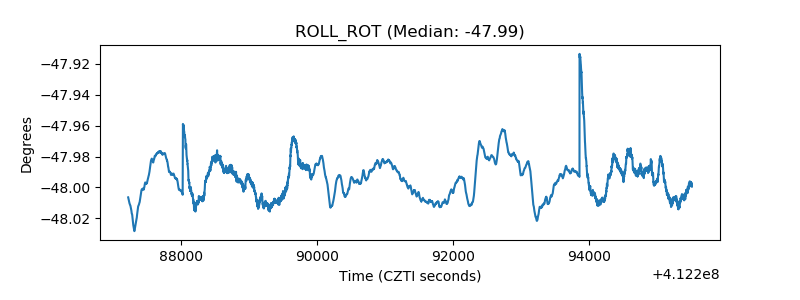 |
| _Roll_DEC | 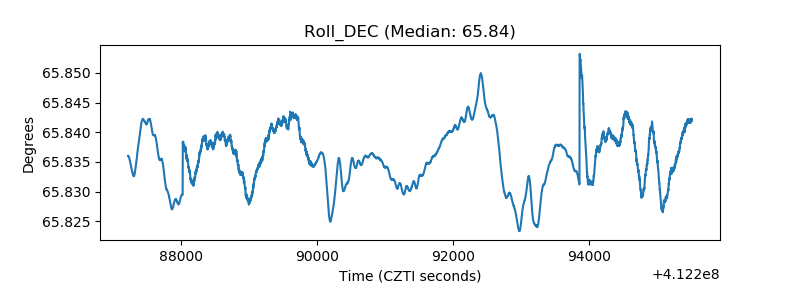 |
| _Roll_RA | 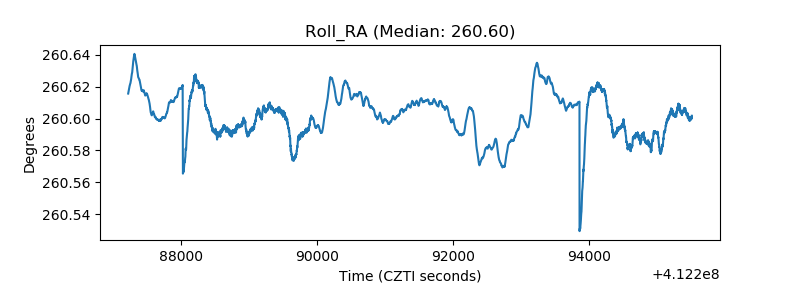 |
| Veto Counter | 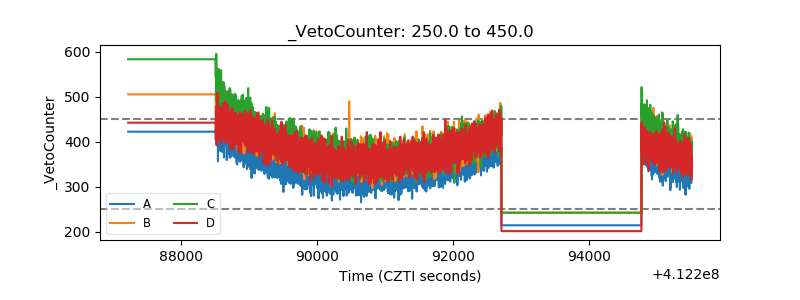 |