| Param | Original file | Final file |
|---|---|---|
| Filename | modeM0/AS1A12_018T01_9000005488_39609cztM0_level2.fits | modeM0/AS1A12_018T01_9000005488_39609cztM0_level2_quad_clean.evt |
| Size (bytes) | 378,123,840 | 90,282,240 |
| Size | 360.6 MB | 86.1 MB |
| Events in quadrant A | 2,847,556 | 608,154 |
| Events in quadrant B | 2,541,639 | 624,449 |
| Events in quadrant C | 4,749,833 | 565,475 |
| Events in quadrant D | 3,431,255 | 551,695 |
| Mode SS | |||
|---|---|---|---|
| Quadrant | BADHDUFLAG | Total packets | Discarded packets |
| A | 0 | 112 | 0 |
| B | 0 | 112 | 0 |
| C | 0 | 112 | 0 |
| D | 0 | 112 | 0 |
| Mode M0 | |||
|---|---|---|---|
| Quadrant | BADHDUFLAG | Total packets | Discarded packets |
| A | 0 | 12046 | 3 |
| B | 0 | 11644 | 2 |
| C | 0 | 17923 | 2 |
| D | 0 | 14036 | 2 |
| Mode M9 | |||
|---|---|---|---|
| Quadrant | BADHDUFLAG | Total packets | Discarded packets |
| A | 0 | 33 | 0 |
| B | 0 | 33 | 0 |
| C | 0 | 33 | 0 |
| D | 0 | 34 | 0 |
| Quadrant | Total seconds | Saturated seconds | Saturation percentage |
|---|---|---|---|
| A | 5485 | 22 | 0.401094% |
| B | 5485 | 33 | 0.601641% |
| C | 5485 | 419 | 7.639015% |
| D | 5485 | 99 | 1.804923% |
Noise dominated data is calculated using 1-second bins in cleaned event files. If a bin has >2000 counts, and if more than 50% of those come from <1% of pixels, then it is considered to be noise-dominated and hence unusable.
| Quadrant | # 1 sec bins | Bins with >0 counts | Bins with >2000 counts | High rate bins dominated by noise | Noise dominated (total time) | Noise dominated (detector-on time) | Marked lightcurve |
|---|---|---|---|---|---|---|---|
| A | 7309 | 5486 | 13 | 13 | 0.18% | 0.24% | 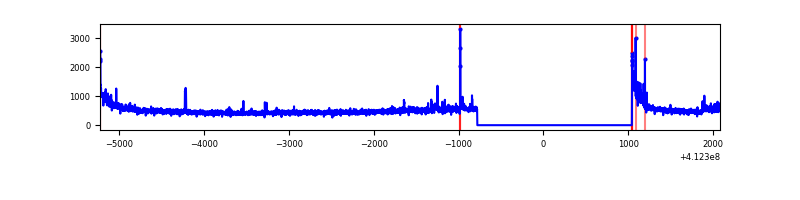 |
| B | 7309 | 5486 | 14 | 14 | 0.19% | 0.26% | 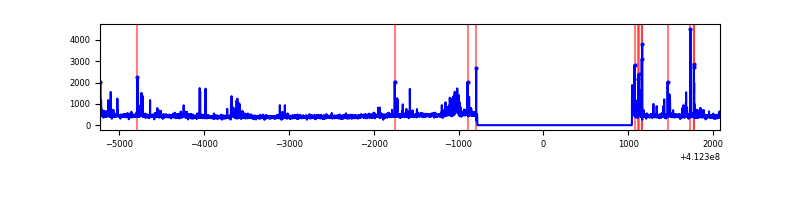 |
| C | 7309 | 5486 | 390 | 390 | 5.34% | 7.11% | 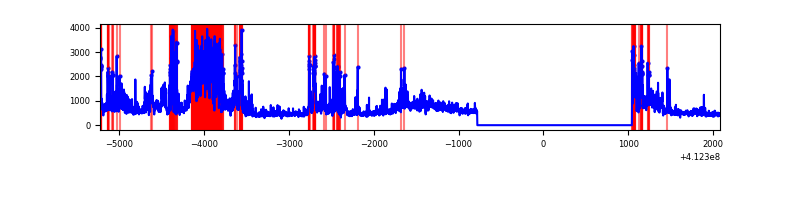 |
| D | 7309 | 5486 | 98 | 98 | 1.34% | 1.79% | 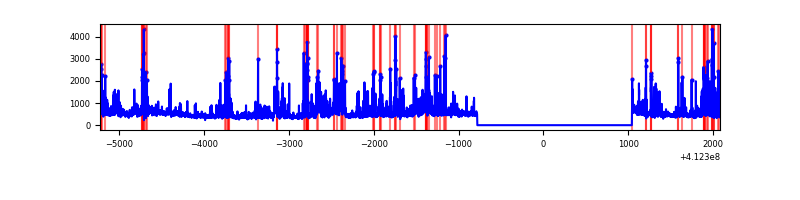 |
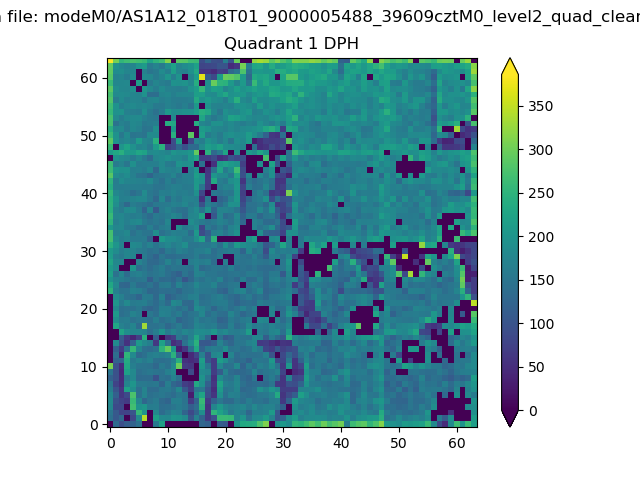
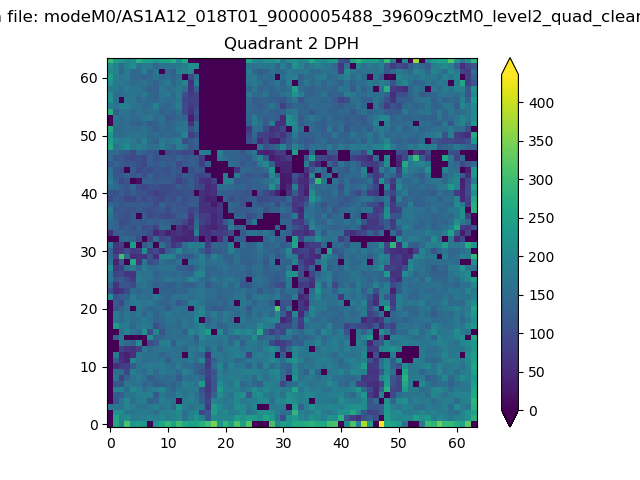
Top three noisy pixels from each quadrant. If the there are fewer than three noisy pixels in the level2.evt file, extra rows are filled as -1
| Pixel properties | Quadrant properties | ||||||
|---|---|---|---|---|---|---|---|
| Quadrant | DetID | PixID | Counts | Sigma | Mean | Median | Sigma |
| A | 10 | 83 | 436477 | 3677.7 | 579 | 569 | 118.5 |
| A | 15 | 222 | 105874 | 888.45 | 579 | 569 | 118.5 |
| A | 13 | 248 | 21988 | 180.71 | 579 | 569 | 118.5 |
| B | 5 | 255 | 190485 | 1712.22 | 578 | 562 | 110.9 |
| B | 5 | 172 | 52671 | 469.78 | 578 | 562 | 110.9 |
| B | 4 | 170 | 15743 | 136.86 | 578 | 562 | 110.9 |
| C | 9 | 187 | 1770492 | 13813.98 | 556 | 562 | 128.1 |
| C | 15 | 208 | 542861 | 4232.54 | 556 | 562 | 128.1 |
| C | 15 | 214 | 239846 | 1867.57 | 556 | 562 | 128.1 |
| D | 12 | 227 | 350695 | 2535.5 | 563 | 546 | 138.1 |
| D | 2 | 249 | 289851 | 2094.92 | 563 | 546 | 138.1 |
| D | 12 | 0 | 155003 | 1118.45 | 563 | 546 | 138.1 |
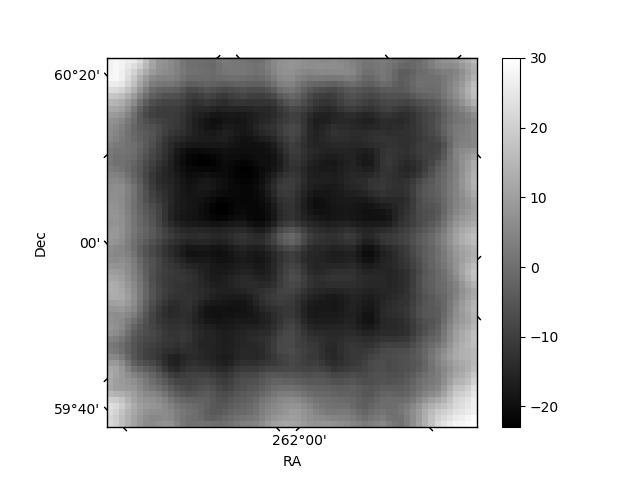
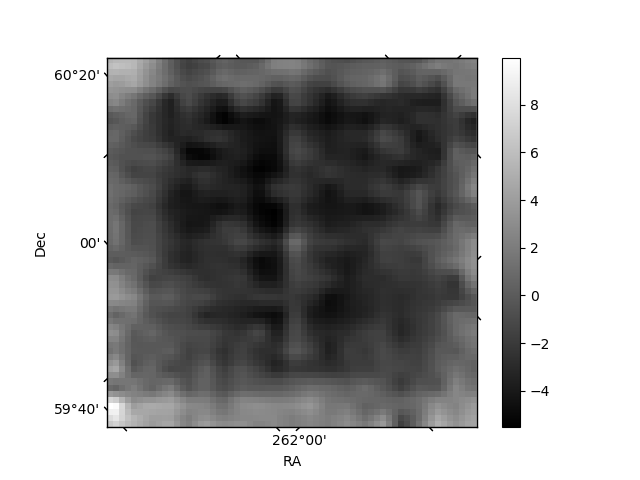
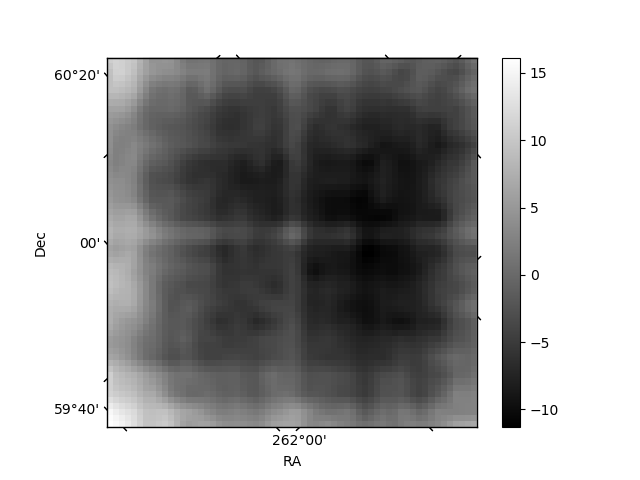
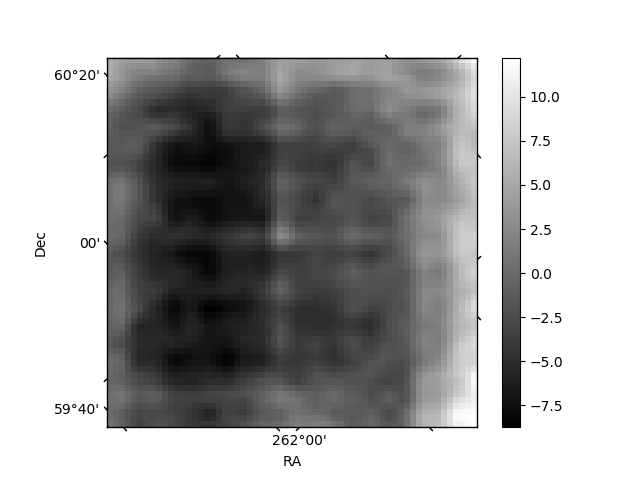
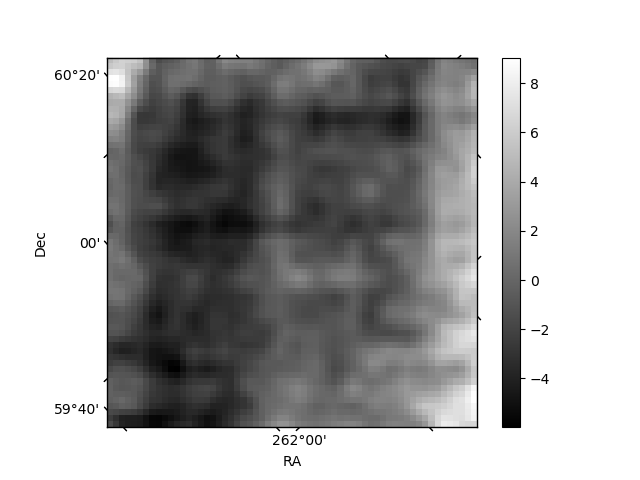
Histogram calculated using DETX and DETY for each event in the final _common_clean file
| Quadrant A | 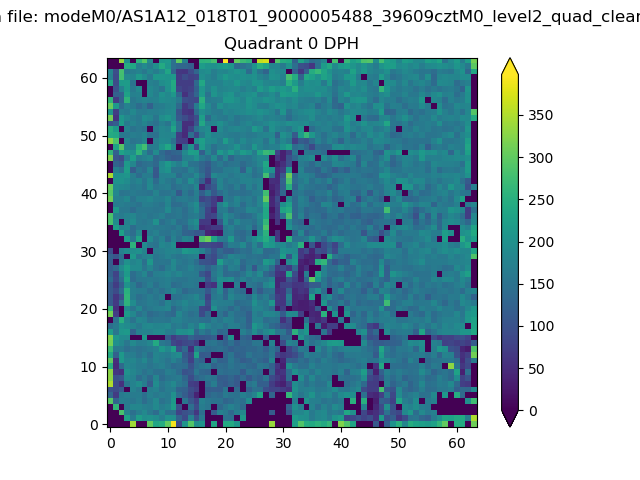 |
 |
Quadrant B |
|---|---|---|---|
| Quadrant D | 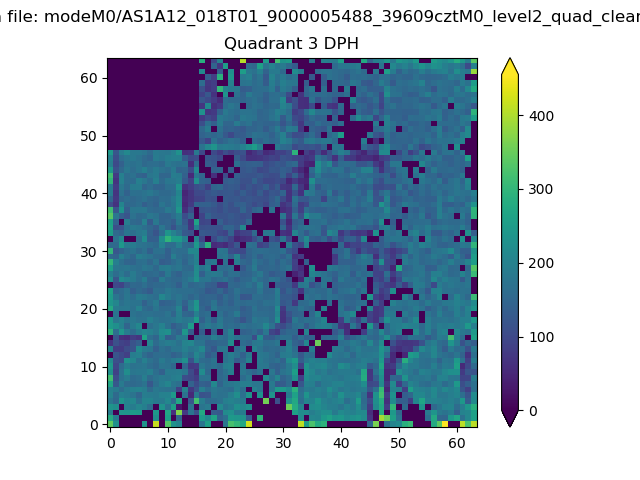 |
 |
Quadrant C |
| Plot type | Count rate plots | Images |
|---|---|---|
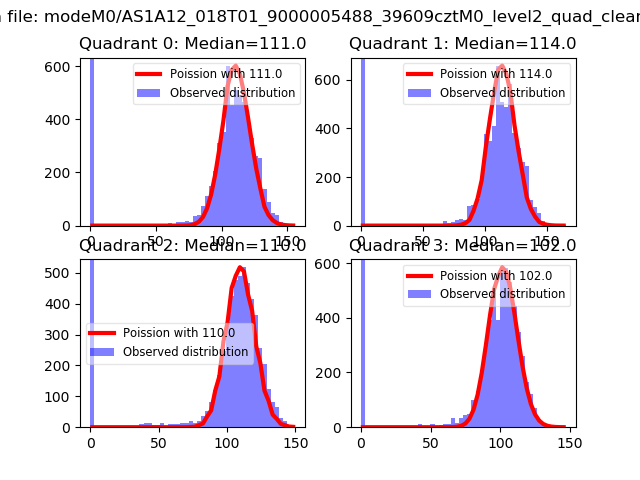
| Comparison with Poisson distribution Blue bars denote a histogram of data divided into 1 sec bins. Red curve is a Poisson curve with rate = median count rate of data. |
 |
 |
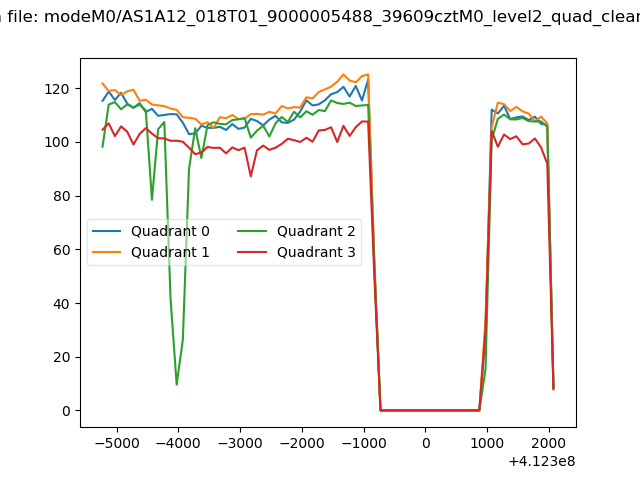
| Quadrant-wise count rates Data is divided into 100 sec bins |
 |
|
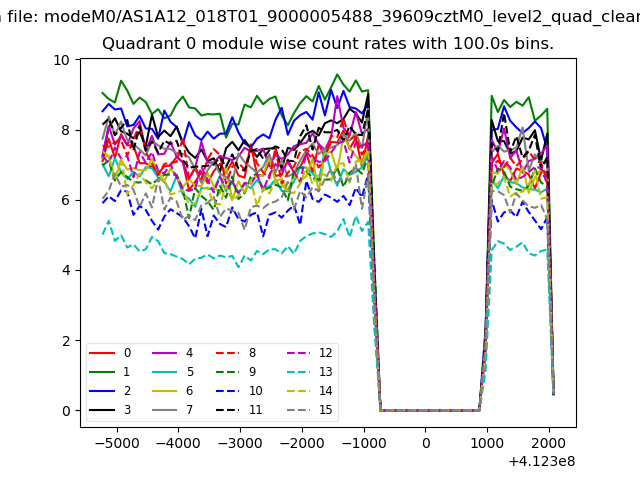
| Module-wise count rates for Quadrant A Data is divided into 100 sec bins |
 |
 |
| Module-wise count rates for Quadrant B Data is divided into 100 sec bins |
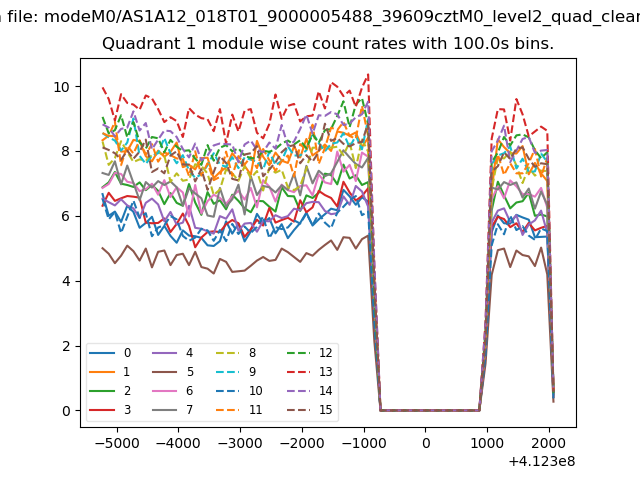 |
 |
| Module-wise count rates for Quadrant C Data is divided into 100 sec bins |
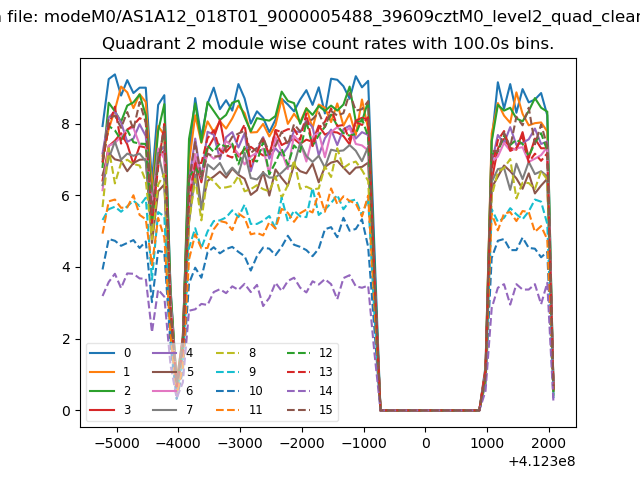 |
 |
| Module-wise count rates for Quadrant D Data is divided into 100 sec bins |
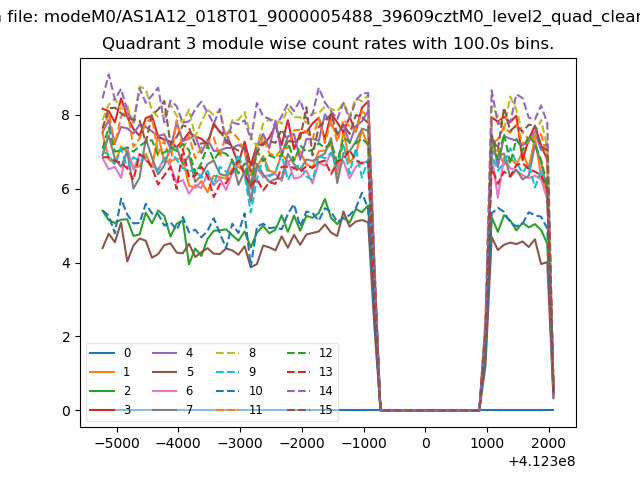 |
 |
| Parameter | Plot |
|---|---|
| CZT HV Monitor | 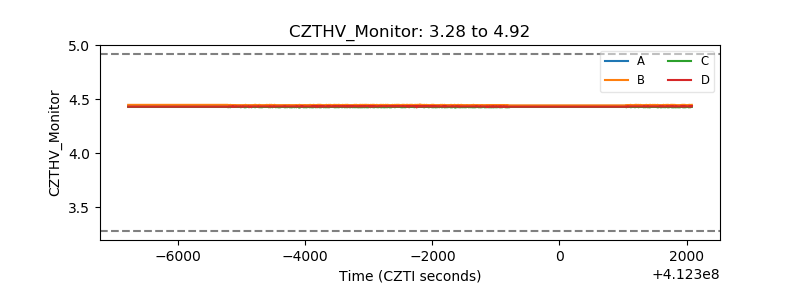 |
| D_VDD | 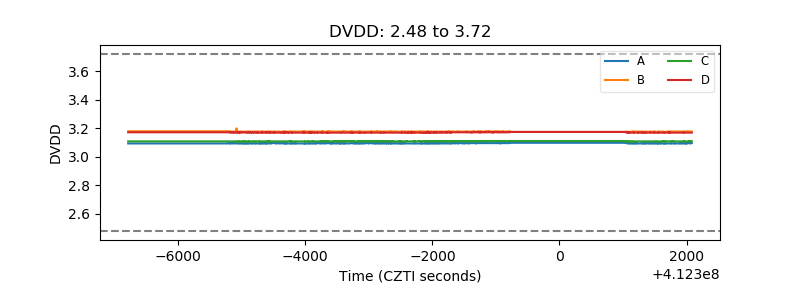 |
| Temperature 1 | 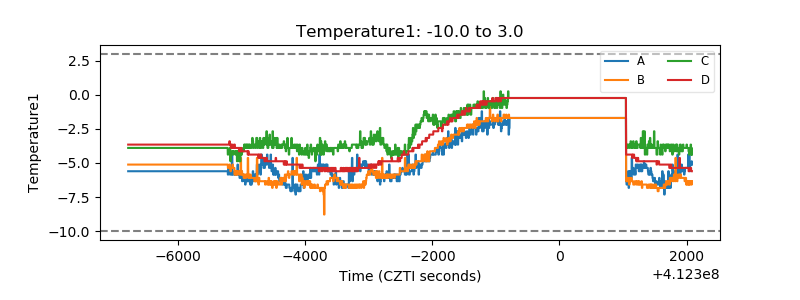 |
| Veto HV Monitor | 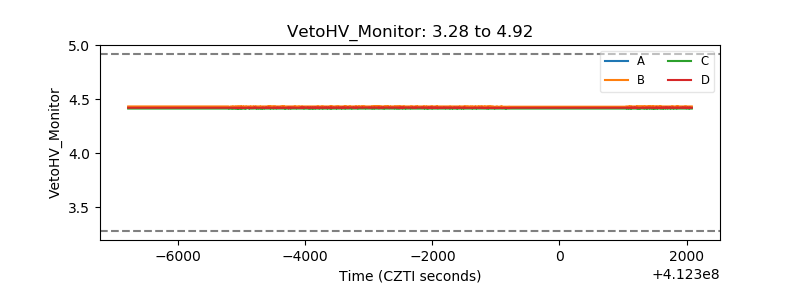 |
| Veto LLD | 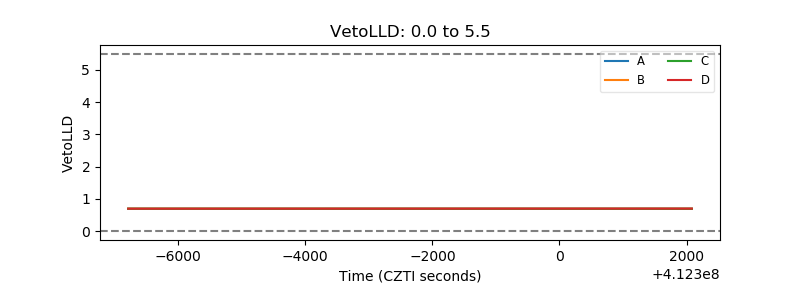 |
| Alpha Counter | 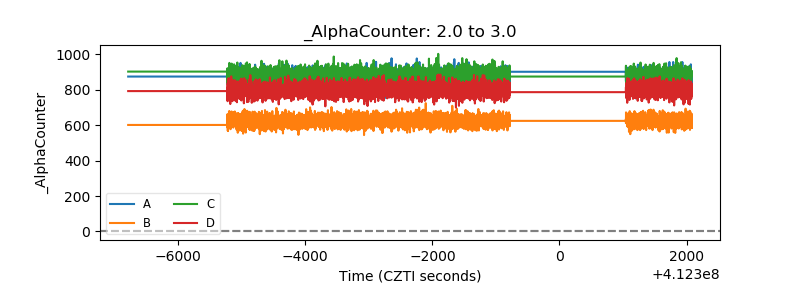 |
| _CPM_Rate | 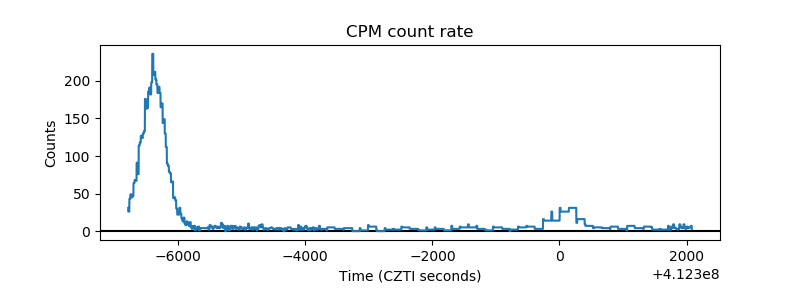 |
| CZT Counter | 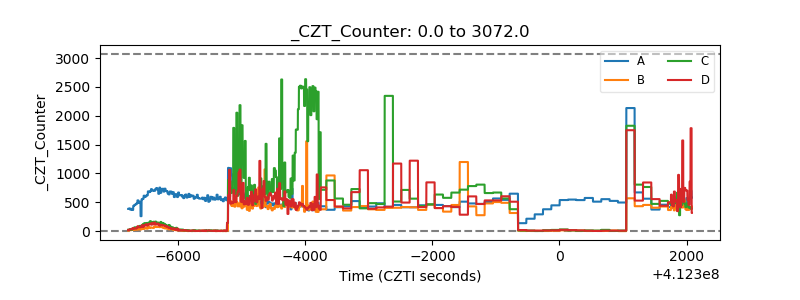 |
| +2.5 Volts monitor | 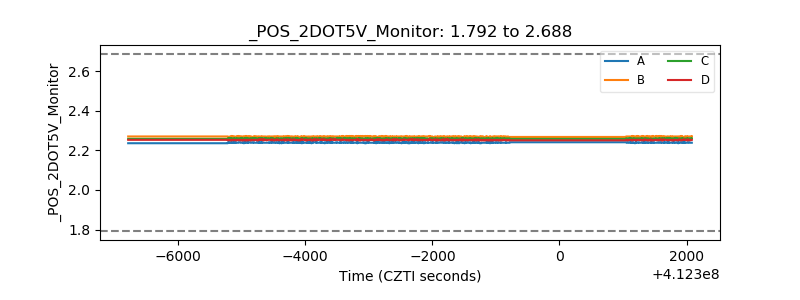 |
| +5 Volts monitor | 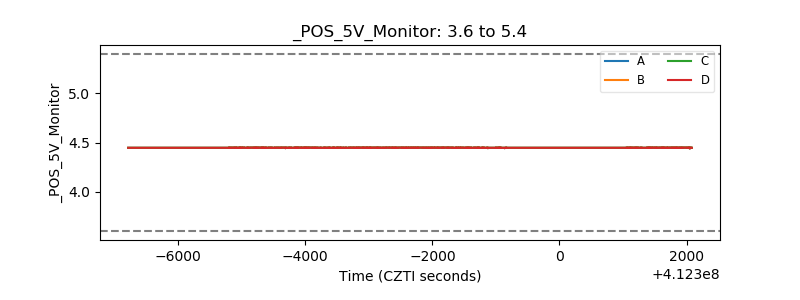 |
| _ROLL_ROT | 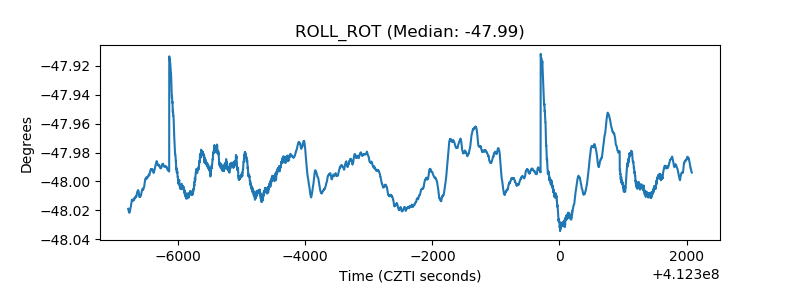 |
| _Roll_DEC | 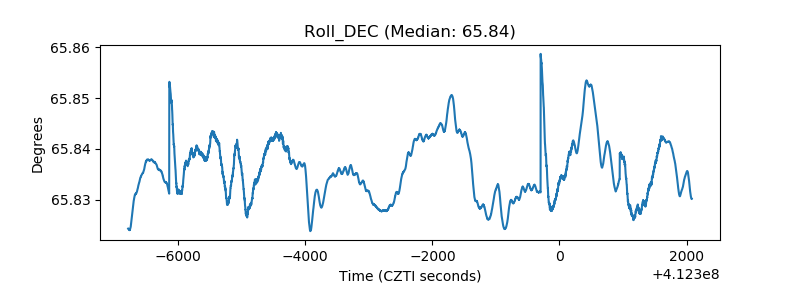 |
| _Roll_RA | 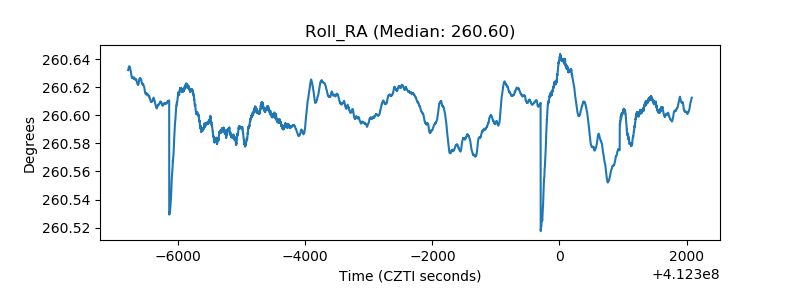 |
| Veto Counter | 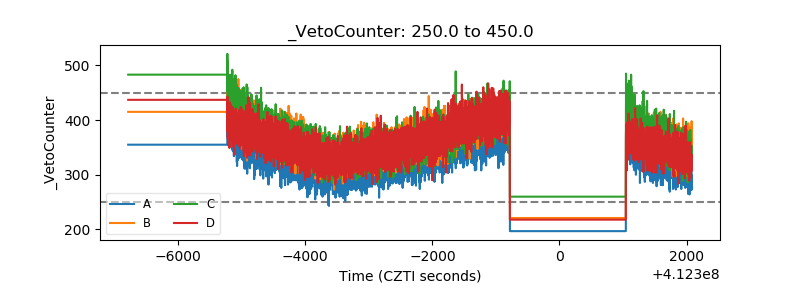 |