| Param | Original file | Final file |
|---|---|---|
| Filename | modeM0/AS1A12_018T01_9000005488_39610cztM0_level2.fits | modeM0/AS1A12_018T01_9000005488_39610cztM0_level2_quad_clean.evt |
| Size (bytes) | 398,134,080 | 94,772,160 |
| Size | 379.7 MB | 90.4 MB |
| Events in quadrant A | 3,325,083 | 635,480 |
| Events in quadrant B | 2,930,981 | 647,122 |
| Events in quadrant C | 4,642,632 | 610,457 |
| Events in quadrant D | 3,386,400 | 569,428 |
| Mode SS | |||
|---|---|---|---|
| Quadrant | BADHDUFLAG | Total packets | Discarded packets |
| A | 0 | 122 | 0 |
| B | 0 | 122 | 0 |
| C | 0 | 122 | 0 |
| D | 0 | 122 | 0 |
| Mode M0 | |||
|---|---|---|---|
| Quadrant | BADHDUFLAG | Total packets | Discarded packets |
| A | 0 | 13666 | 2 |
| B | 0 | 13016 | 1 |
| C | 0 | 17875 | 1 |
| D | 0 | 14351 | 1 |
| Mode M9 | |||
|---|---|---|---|
| Quadrant | BADHDUFLAG | Total packets | Discarded packets |
| A | 0 | 33 | 0 |
| B | 0 | 33 | 0 |
| C | 0 | 33 | 0 |
| D | 0 | 33 | 0 |
| Quadrant | Total seconds | Saturated seconds | Saturation percentage |
|---|---|---|---|
| A | 5820 | 25 | 0.429553% |
| B | 5820 | 114 | 1.958763% |
| C | 5820 | 236 | 4.054983% |
| D | 5820 | 149 | 2.560137% |
Noise dominated data is calculated using 1-second bins in cleaned event files. If a bin has >2000 counts, and if more than 50% of those come from <1% of pixels, then it is considered to be noise-dominated and hence unusable.
| Quadrant | # 1 sec bins | Bins with >0 counts | Bins with >2000 counts | High rate bins dominated by noise | Noise dominated (total time) | Noise dominated (detector-on time) | Marked lightcurve |
|---|---|---|---|---|---|---|---|
| A | 9137 | 5822 | 23 | 23 | 0.25% | 0.40% | 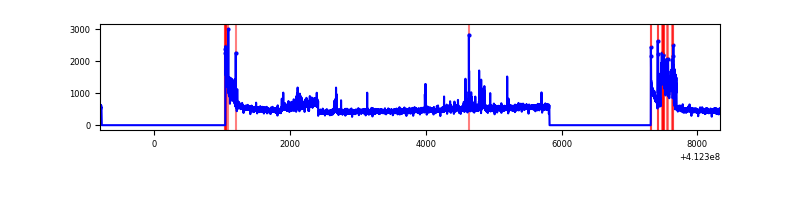 |
| B | 9137 | 5822 | 66 | 66 | 0.72% | 1.13% | 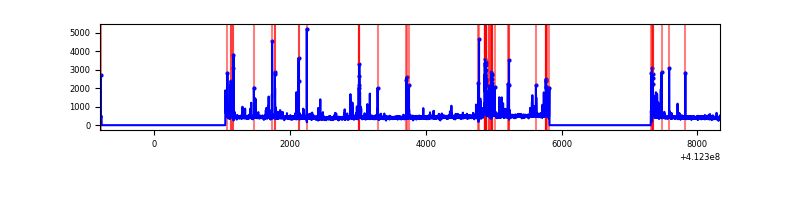 |
| C | 9137 | 5822 | 277 | 277 | 3.03% | 4.76% | 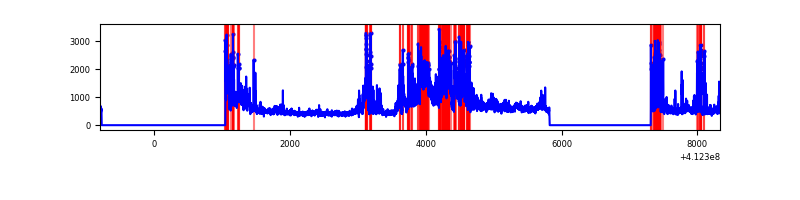 |
| D | 9137 | 5822 | 128 | 128 | 1.40% | 2.20% | 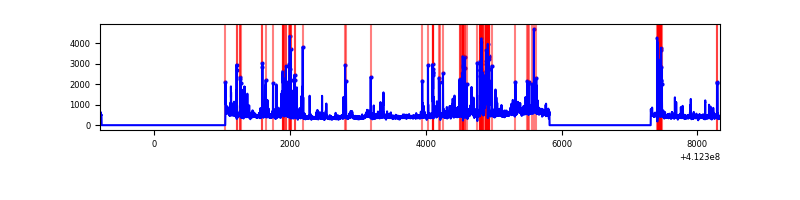 |
Top three noisy pixels from each quadrant. If the there are fewer than three noisy pixels in the level2.evt file, extra rows are filled as -1
| Pixel properties | Quadrant properties | ||||||
|---|---|---|---|---|---|---|---|
| Quadrant | DetID | PixID | Counts | Sigma | Mean | Median | Sigma |
| A | 10 | 83 | 466858 | 3676.34 | 616 | 602 | 126.8 |
| A | 15 | 222 | 400088 | 3149.87 | 616 | 602 | 126.8 |
| A | 13 | 248 | 60076 | 468.94 | 616 | 602 | 126.8 |
| B | 5 | 255 | 361437 | 3058.81 | 610 | 593 | 118.0 |
| B | 5 | 172 | 133788 | 1129.07 | 610 | 593 | 118.0 |
| B | 4 | 170 | 25943 | 214.89 | 610 | 593 | 118.0 |
| C | 9 | 187 | 1899708 | 13729.81 | 596 | 599 | 138.3 |
| C | 15 | 214 | 256565 | 1850.53 | 596 | 599 | 138.3 |
| C | 15 | 208 | 139148 | 1001.66 | 596 | 599 | 138.3 |
| D | 2 | 249 | 477739 | 3245.45 | 597 | 579 | 147.0 |
| D | 1 | 52 | 190493 | 1291.72 | 597 | 579 | 147.0 |
| D | 13 | 171 | 114645 | 775.83 | 597 | 579 | 147.0 |
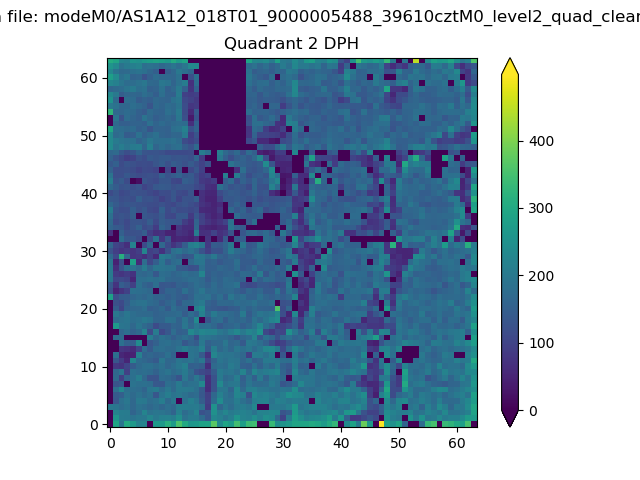
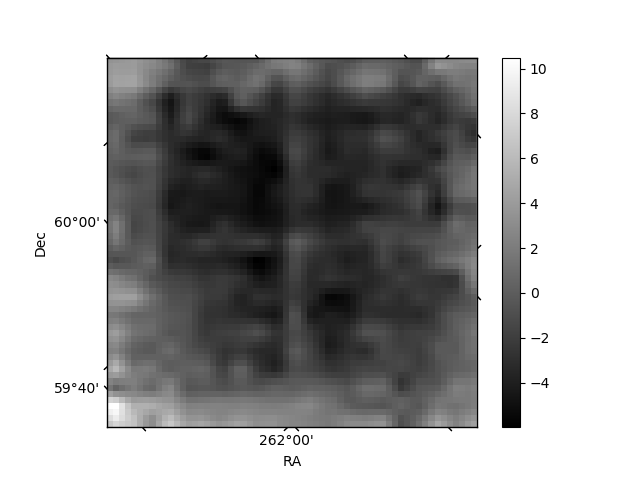
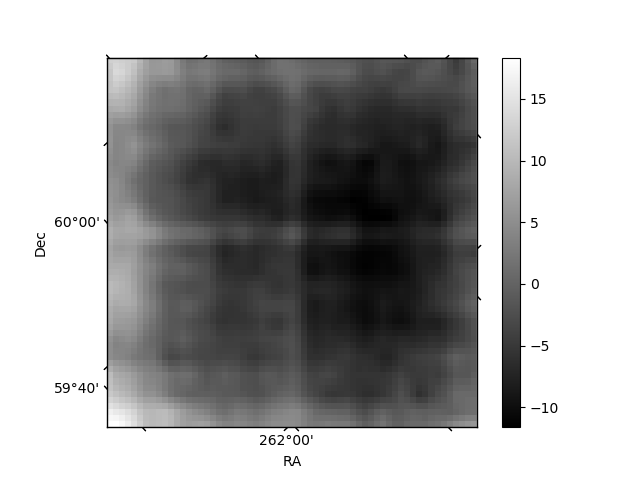
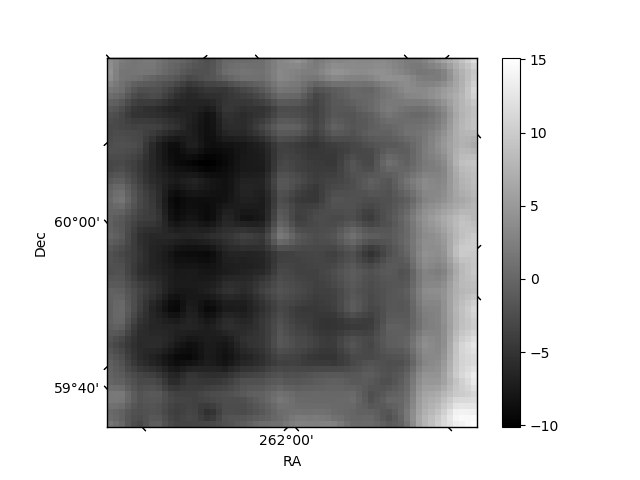
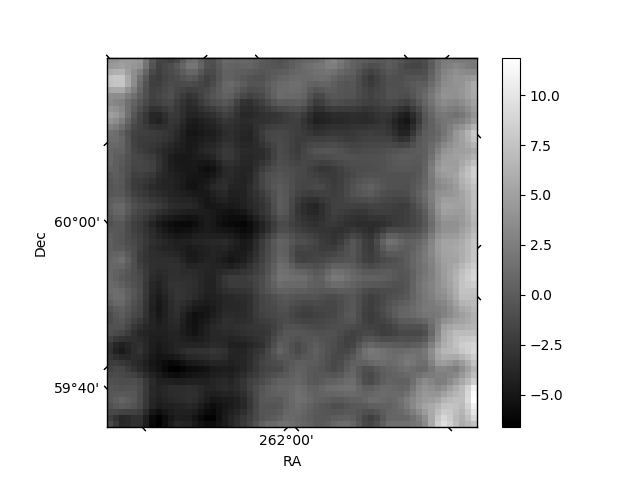
Histogram calculated using DETX and DETY for each event in the final _common_clean file
| Quadrant A | 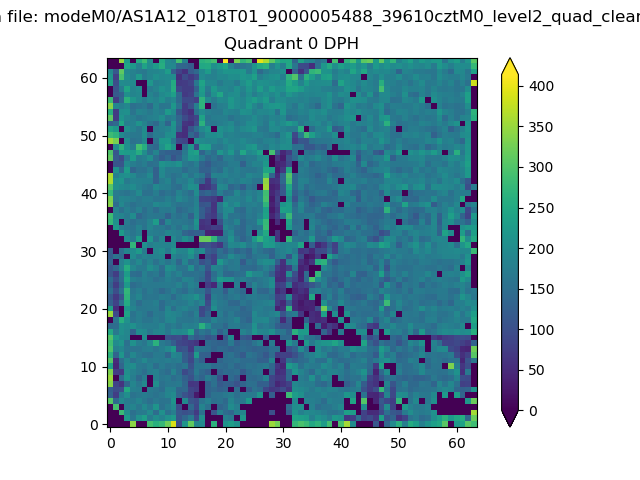 |
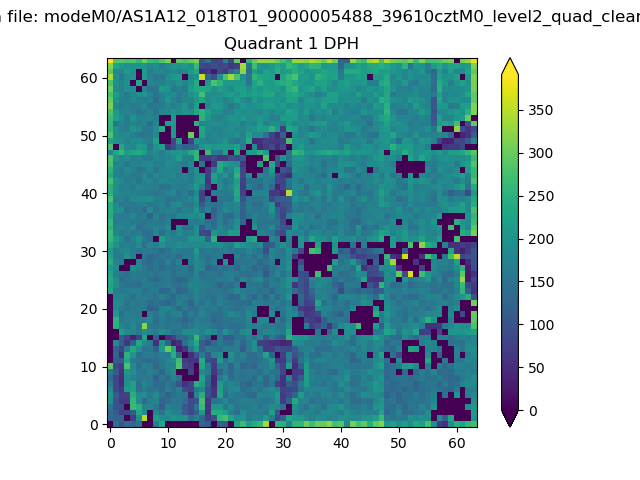 |
Quadrant B |
|---|---|---|---|
| Quadrant D | 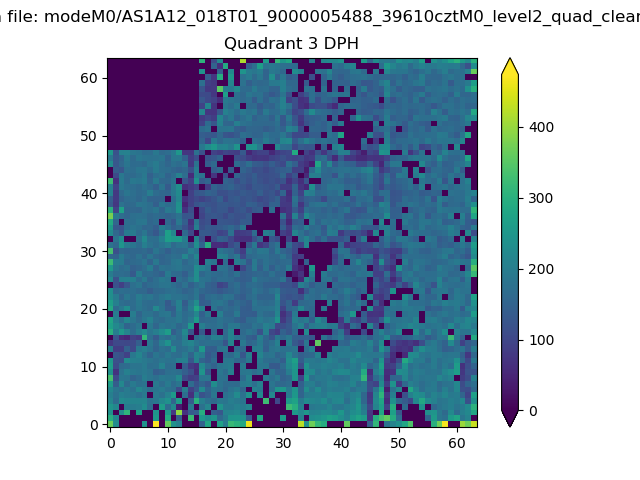 |
 |
Quadrant C |
| Plot type | Count rate plots | Images |
|---|---|---|
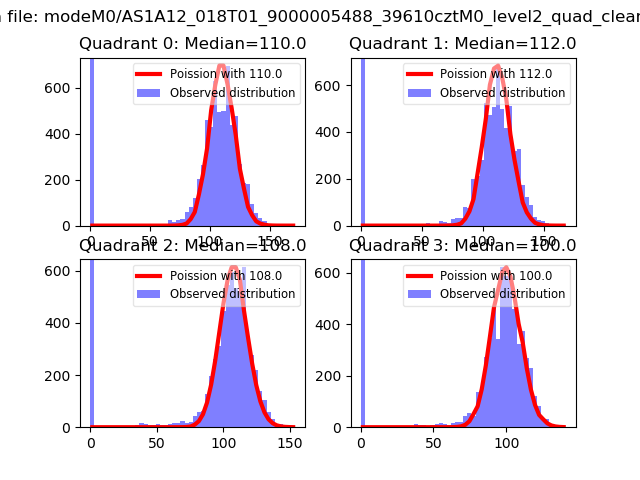
| Comparison with Poisson distribution Blue bars denote a histogram of data divided into 1 sec bins. Red curve is a Poisson curve with rate = median count rate of data. |
 |
 |
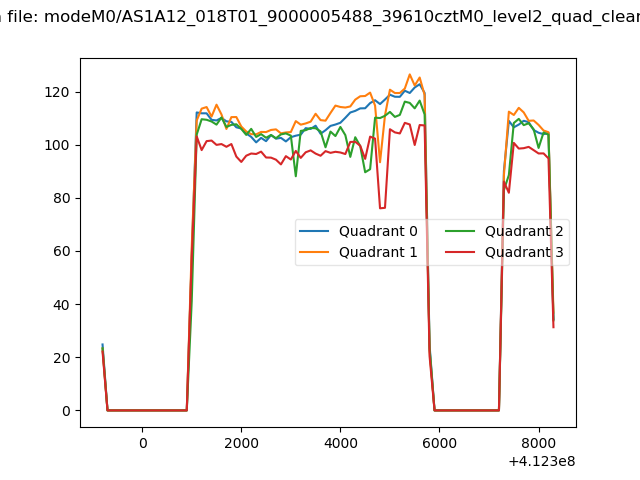
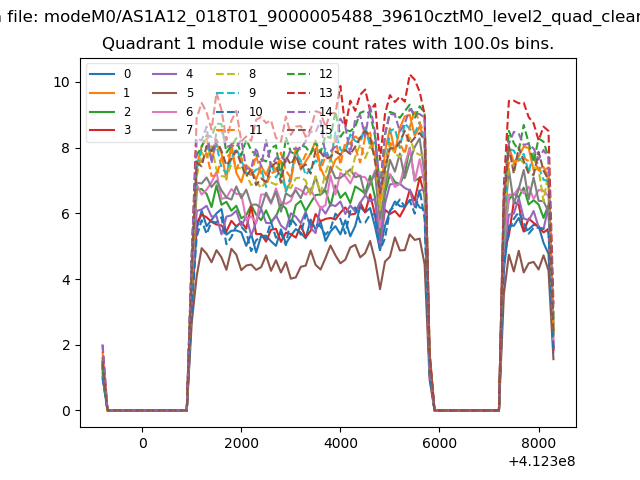
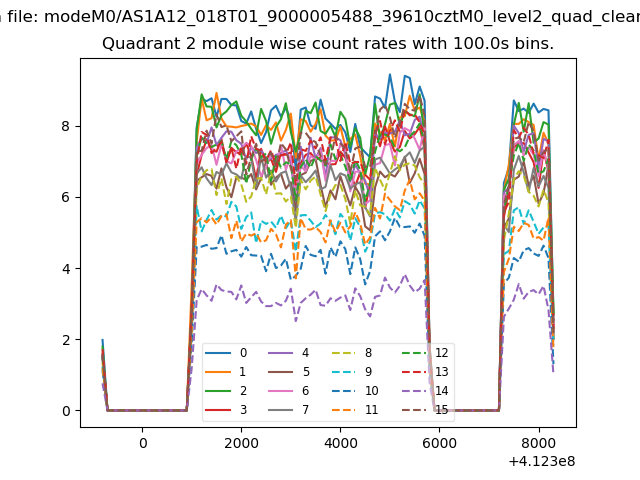
| Quadrant-wise count rates Data is divided into 100 sec bins |
 |
|
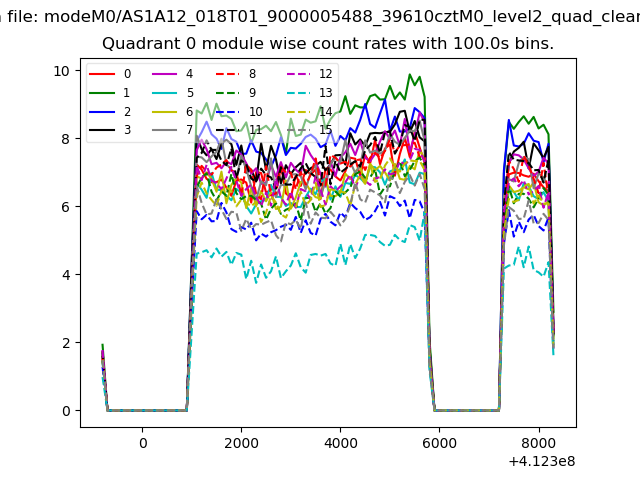
| Module-wise count rates for Quadrant A Data is divided into 100 sec bins |
 |
 |
| Module-wise count rates for Quadrant B Data is divided into 100 sec bins |
 |
 |
| Module-wise count rates for Quadrant C Data is divided into 100 sec bins |
 |
 |
| Module-wise count rates for Quadrant D Data is divided into 100 sec bins |
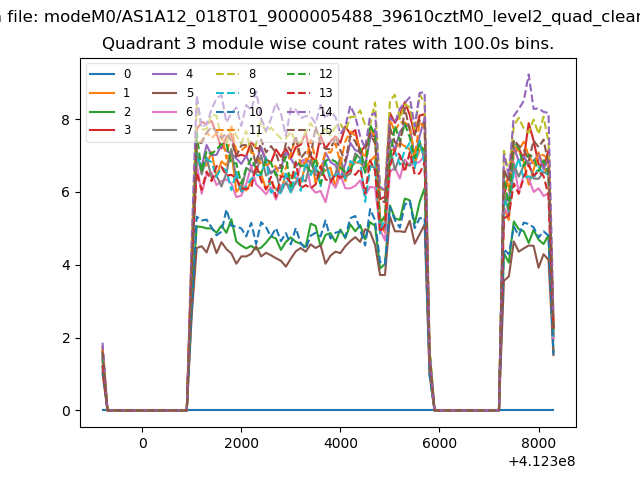 |
 |
| Parameter | Plot |
|---|---|
| CZT HV Monitor | 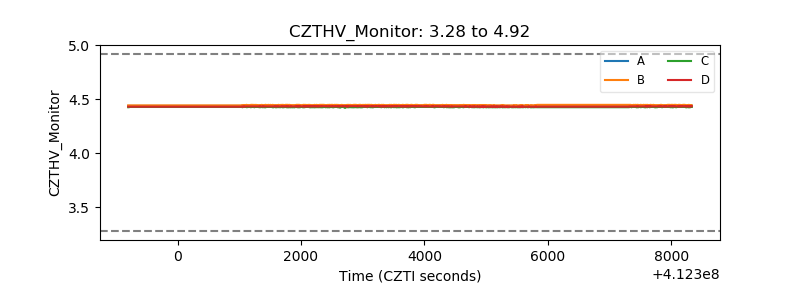 |
| D_VDD | 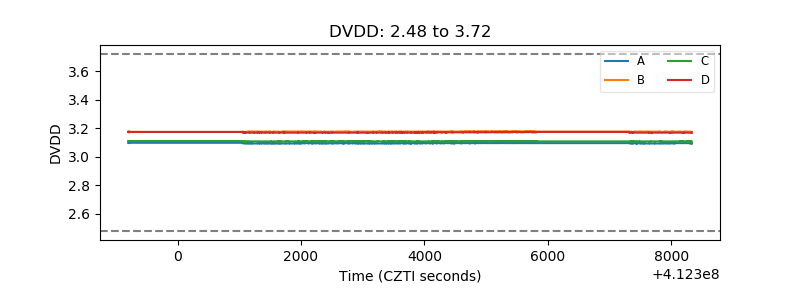 |
| Temperature 1 | 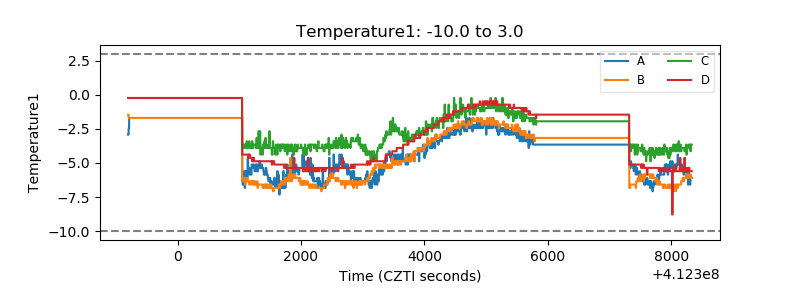 |
| Veto HV Monitor | 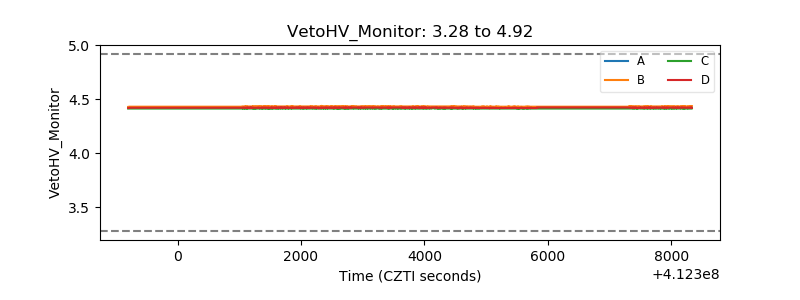 |
| Veto LLD | 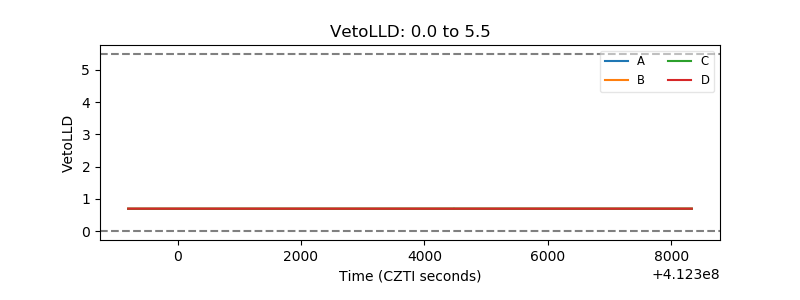 |
| Alpha Counter | 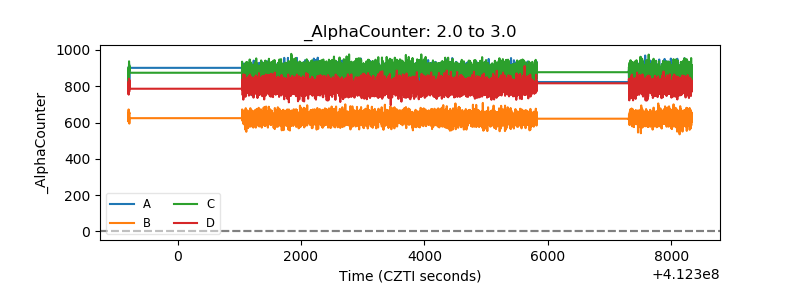 |
| _CPM_Rate |  |
| CZT Counter | 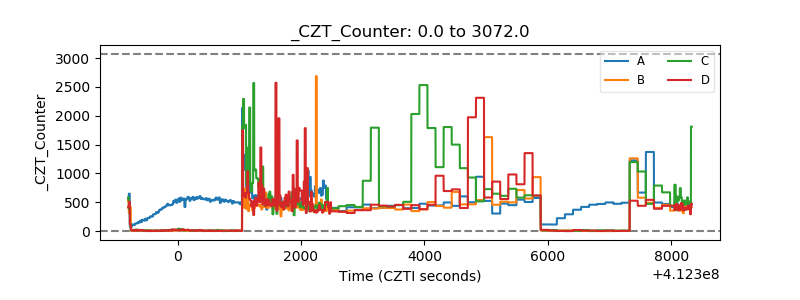 |
| +2.5 Volts monitor | 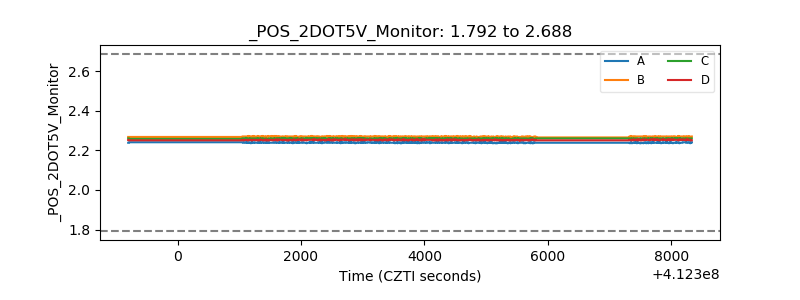 |
| +5 Volts monitor | 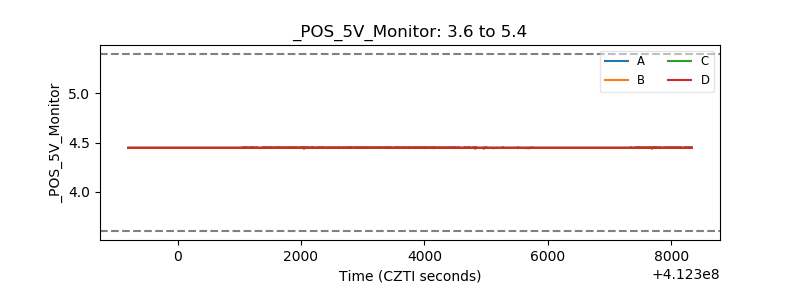 |
| _ROLL_ROT | 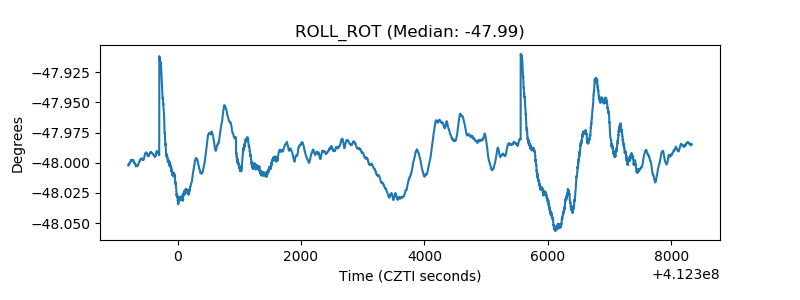 |
| _Roll_DEC | 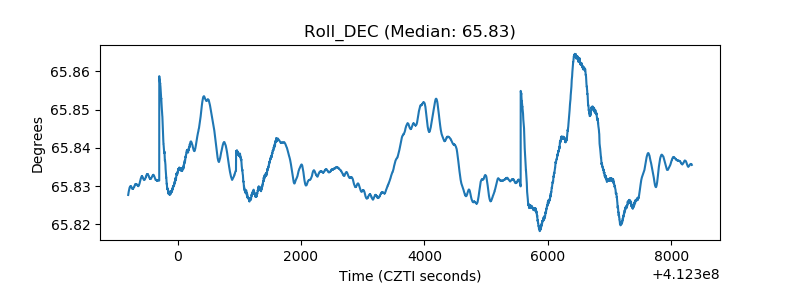 |
| _Roll_RA | 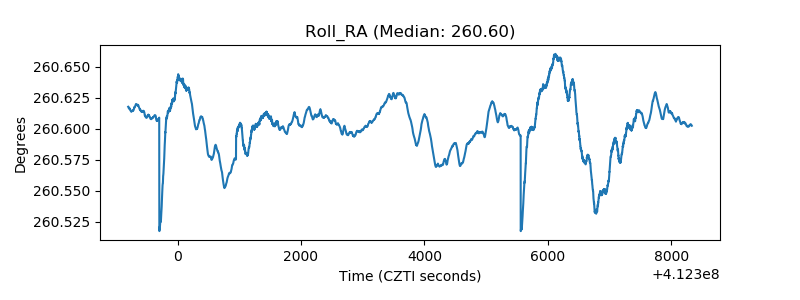 |
| Veto Counter | 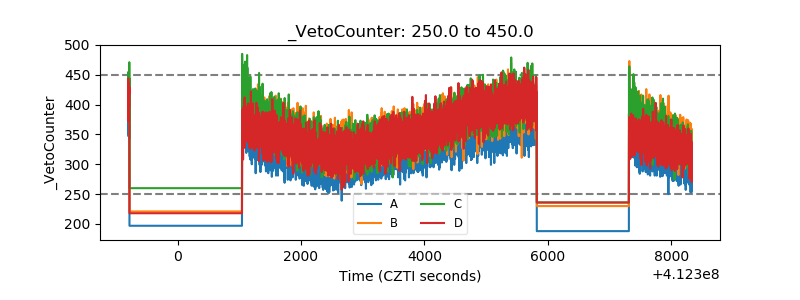 |