| Param | Original file | Final file |
|---|---|---|
| Filename | modeM0/AS1A12_018T01_9000005488_39611cztM0_level2.fits | modeM0/AS1A12_018T01_9000005488_39611cztM0_level2_quad_clean.evt |
| Size (bytes) | 465,223,680 | 91,296,000 |
| Size | 443.7 MB | 87.1 MB |
| Events in quadrant A | 4,372,224 | 599,427 |
| Events in quadrant B | 2,798,770 | 640,399 |
| Events in quadrant C | 6,056,445 | 563,511 |
| Events in quadrant D | 3,542,954 | 555,375 |
| Mode SS | |||
|---|---|---|---|
| Quadrant | BADHDUFLAG | Total packets | Discarded packets |
| A | 0 | 118 | 0 |
| B | 0 | 118 | 0 |
| C | 0 | 118 | 0 |
| D | 0 | 118 | 0 |
| Mode M0 | |||
|---|---|---|---|
| Quadrant | BADHDUFLAG | Total packets | Discarded packets |
| A | 0 | 17053 | 2 |
| B | 0 | 12634 | 1 |
| C | 0 | 22070 | 1 |
| D | 0 | 14675 | 1 |
| Mode M9 | |||
|---|---|---|---|
| Quadrant | BADHDUFLAG | Total packets | Discarded packets |
| A | 0 | 15 | 0 |
| B | 0 | 15 | 0 |
| C | 0 | 15 | 0 |
| D | 0 | 16 | 0 |
| Quadrant | Total seconds | Saturated seconds | Saturation percentage |
|---|---|---|---|
| A | 5802 | 330 | 5.687694% |
| B | 5802 | 92 | 1.585660% |
| C | 5802 | 654 | 11.271975% |
| D | 5802 | 212 | 3.653912% |
Noise dominated data is calculated using 1-second bins in cleaned event files. If a bin has >2000 counts, and if more than 50% of those come from <1% of pixels, then it is considered to be noise-dominated and hence unusable.
| Quadrant | # 1 sec bins | Bins with >0 counts | Bins with >2000 counts | High rate bins dominated by noise | Noise dominated (total time) | Noise dominated (detector-on time) | Marked lightcurve |
|---|---|---|---|---|---|---|---|
| A | 7145 | 5803 | 270 | 270 | 3.78% | 4.65% | 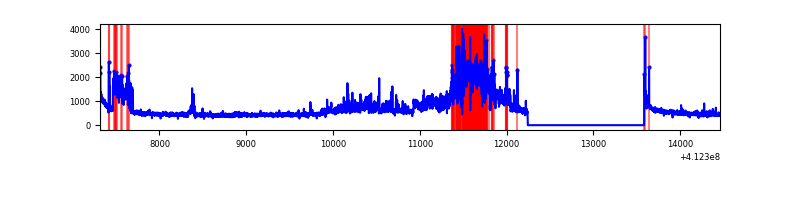 |
| B | 7145 | 5803 | 65 | 65 | 0.91% | 1.12% | 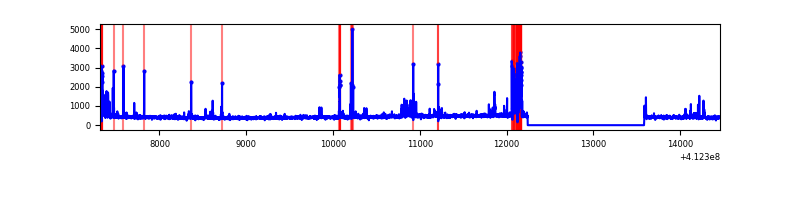 |
| C | 7145 | 5803 | 676 | 676 | 9.46% | 11.65% | 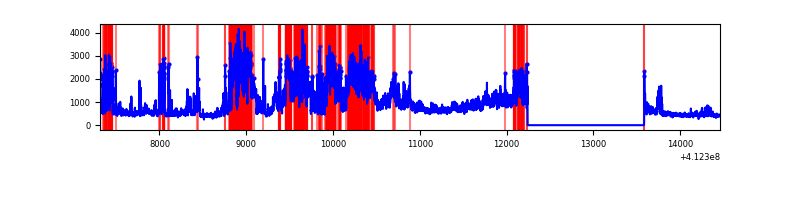 |
| D | 7145 | 5803 | 135 | 135 | 1.89% | 2.33% | 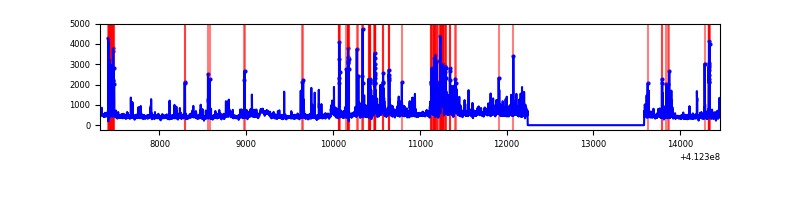 |
Top three noisy pixels from each quadrant. If the there are fewer than three noisy pixels in the level2.evt file, extra rows are filled as -1
| Pixel properties | Quadrant properties | ||||||
|---|---|---|---|---|---|---|---|
| Quadrant | DetID | PixID | Counts | Sigma | Mean | Median | Sigma |
| A | 15 | 222 | 1021004 | 8260.11 | 604 | 590 | 123.5 |
| A | 10 | 83 | 462375 | 3738.09 | 604 | 590 | 123.5 |
| A | 0 | 8 | 367969 | 2973.88 | 604 | 590 | 123.5 |
| B | 5 | 255 | 308008 | 2564.94 | 612 | 594 | 119.9 |
| B | 5 | 172 | 63455 | 524.49 | 612 | 594 | 119.9 |
| B | 12 | 111 | 15036 | 120.5 | 612 | 594 | 119.9 |
| C | 9 | 187 | 3456269 | 25359.13 | 584 | 587 | 136.3 |
| C | 15 | 214 | 250256 | 1832.16 | 584 | 587 | 136.3 |
| C | 15 | 208 | 61157 | 444.48 | 584 | 587 | 136.3 |
| D | 13 | 249 | 274920 | 1882.17 | 593 | 574 | 145.8 |
| D | 2 | 249 | 266977 | 1827.68 | 593 | 574 | 145.8 |
| D | 12 | 227 | 212946 | 1456.99 | 593 | 574 | 145.8 |
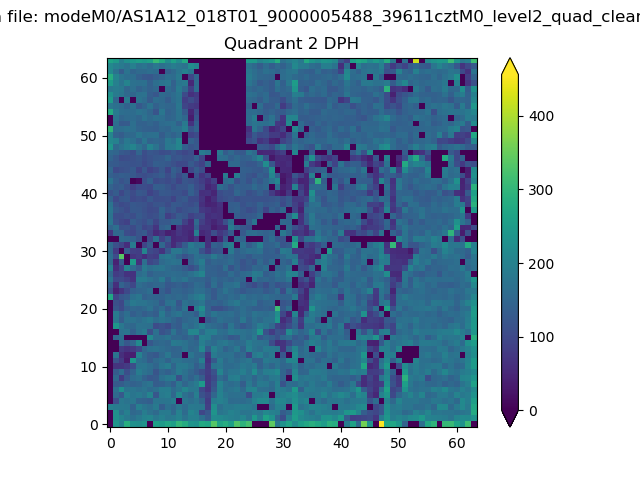
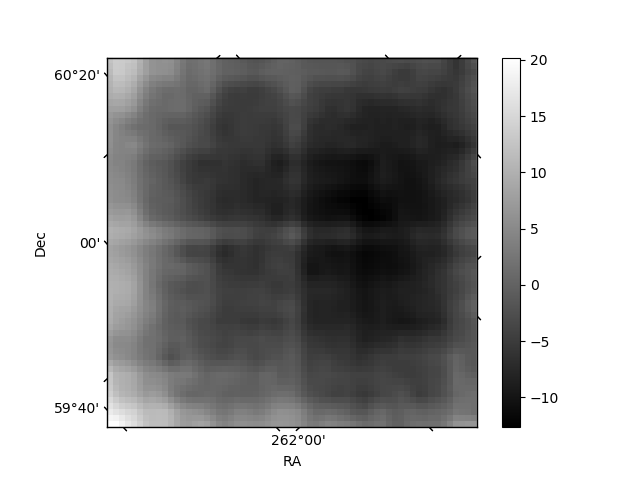
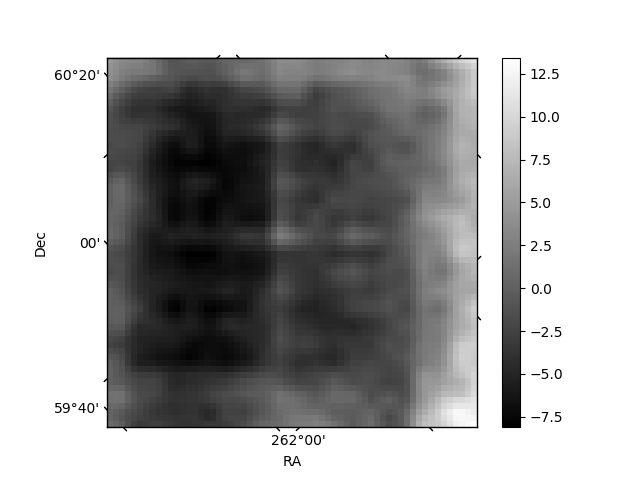
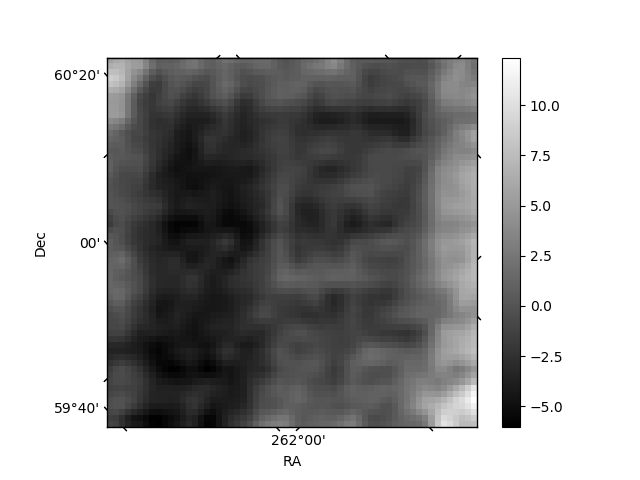
Histogram calculated using DETX and DETY for each event in the final _common_clean file
| Quadrant A | 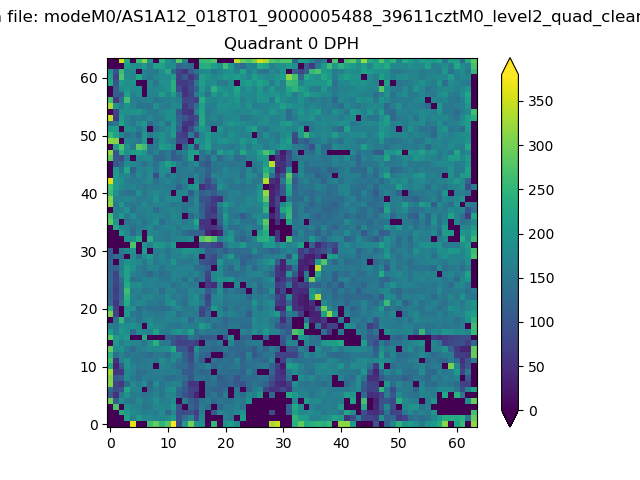 |
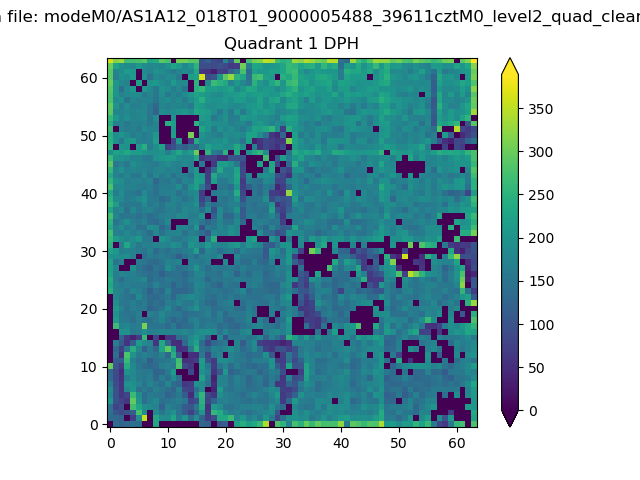 |
Quadrant B |
|---|---|---|---|
| Quadrant D | 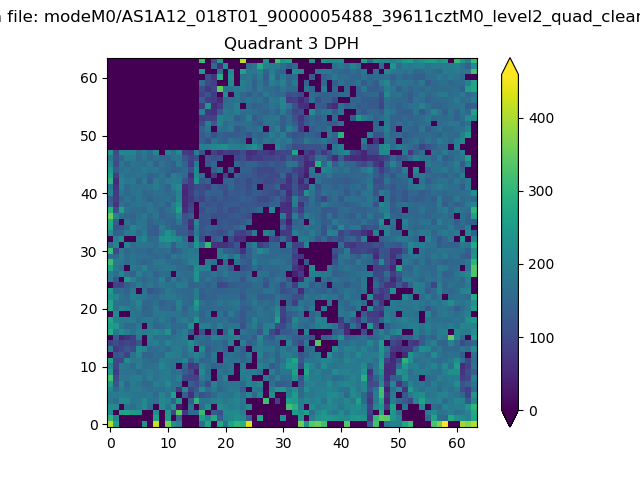 |
 |
Quadrant C |
| Plot type | Count rate plots | Images |
|---|---|---|
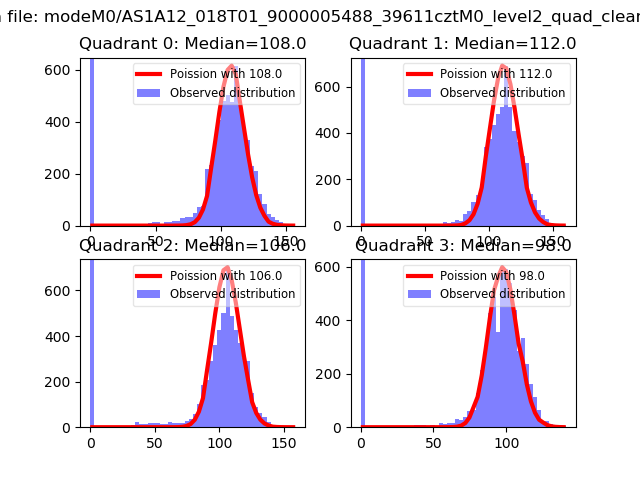
| Comparison with Poisson distribution Blue bars denote a histogram of data divided into 1 sec bins. Red curve is a Poisson curve with rate = median count rate of data. |
 |
 |
| Quadrant-wise count rates Data is divided into 100 sec bins |
 |
|
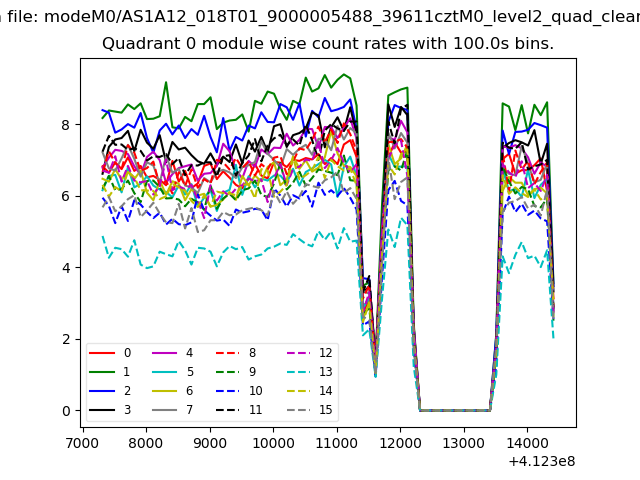
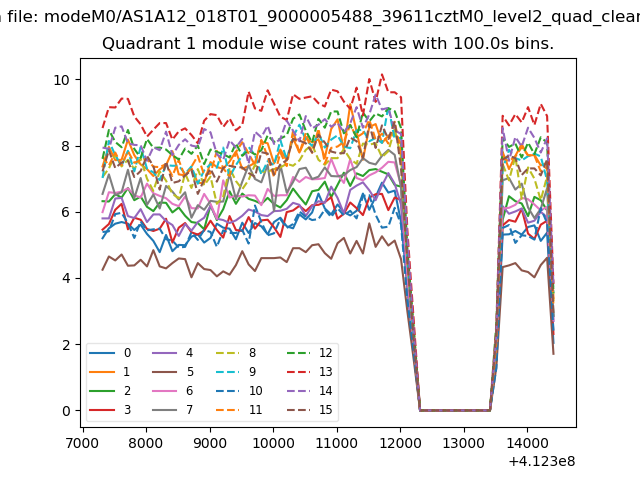
| Module-wise count rates for Quadrant A Data is divided into 100 sec bins |
 |
 |
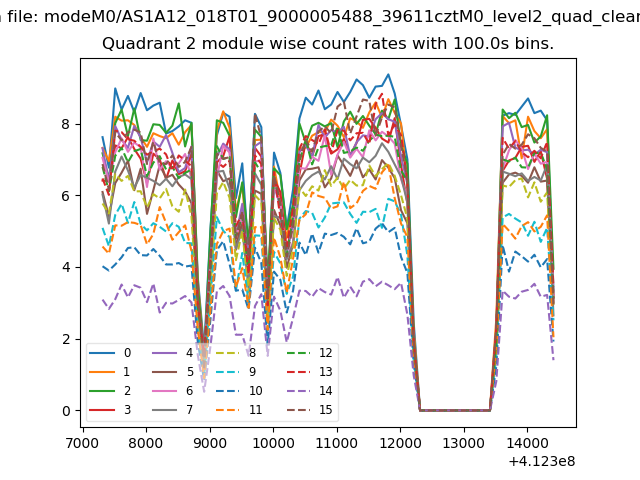
| Module-wise count rates for Quadrant B Data is divided into 100 sec bins |
 |
 |
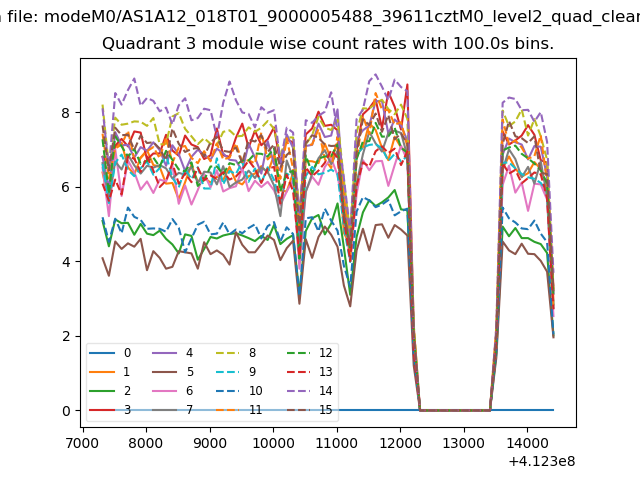
| Module-wise count rates for Quadrant C Data is divided into 100 sec bins |
 |
 |
| Module-wise count rates for Quadrant D Data is divided into 100 sec bins |
 |
 |
| Parameter | Plot |
|---|---|
| CZT HV Monitor | 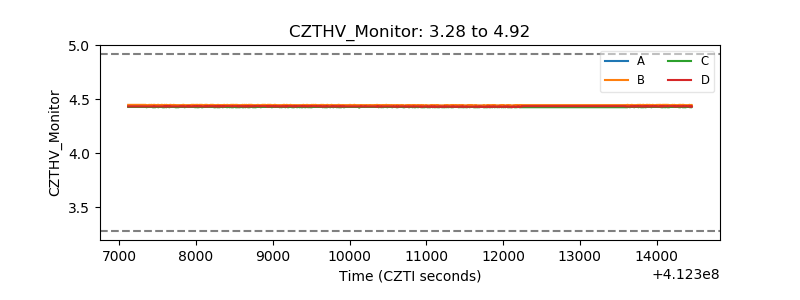 |
| D_VDD | 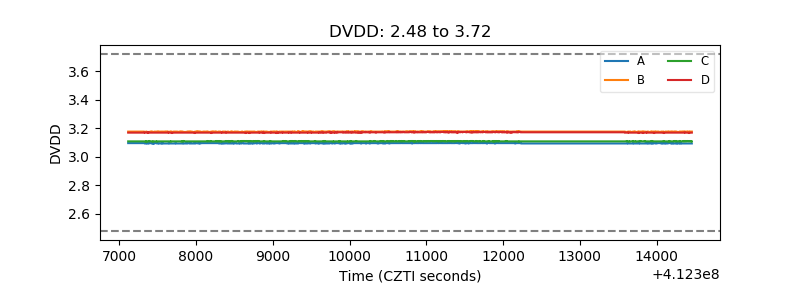 |
| Temperature 1 | 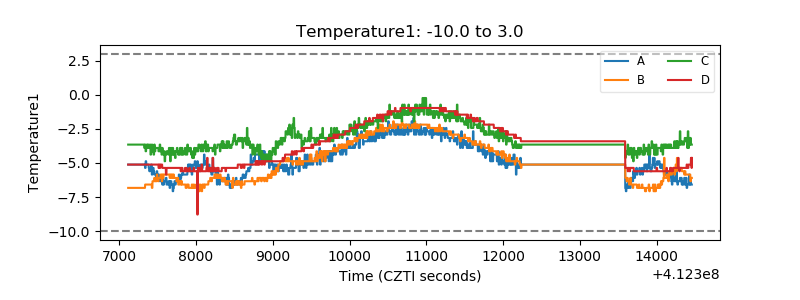 |
| Veto HV Monitor | 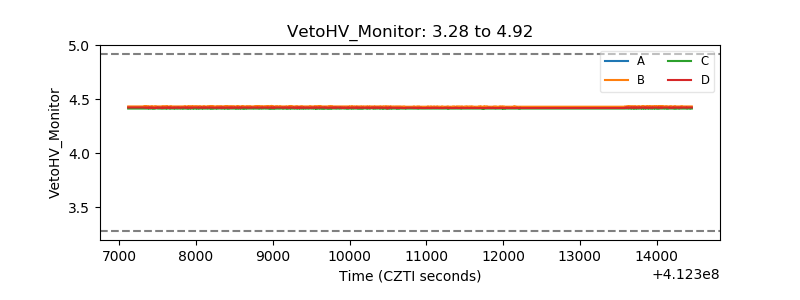 |
| Veto LLD | 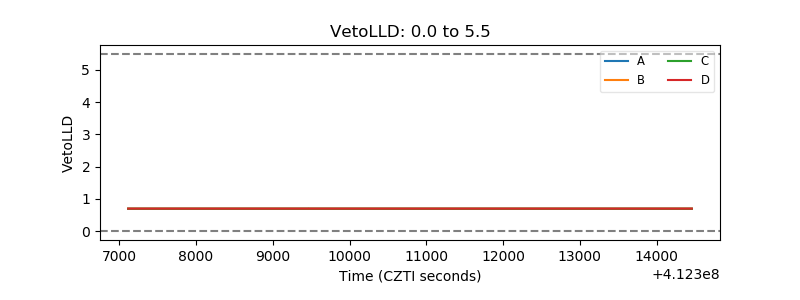 |
| Alpha Counter | 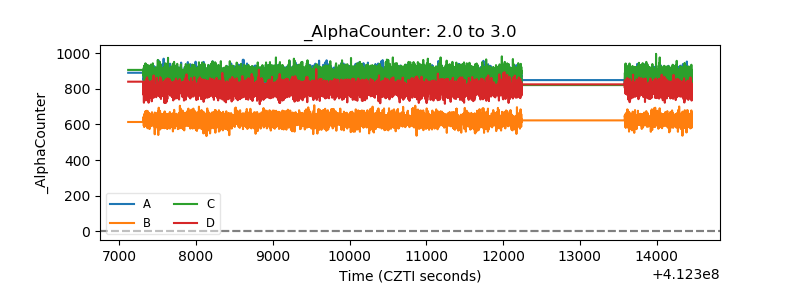 |
| _CPM_Rate | 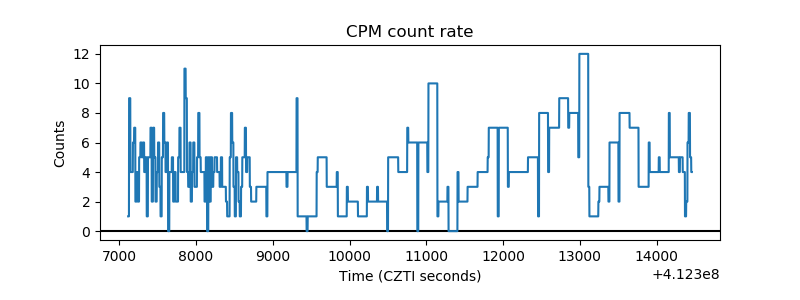 |
| CZT Counter | 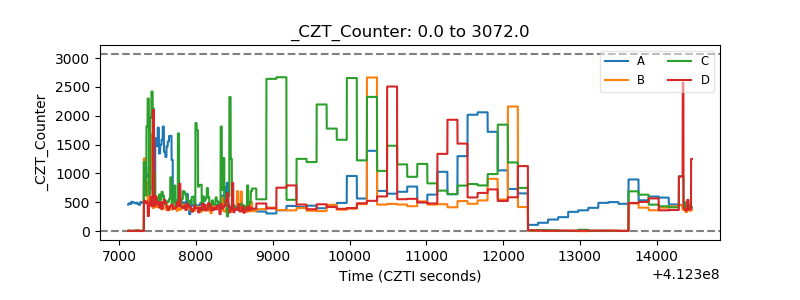 |
| +2.5 Volts monitor | 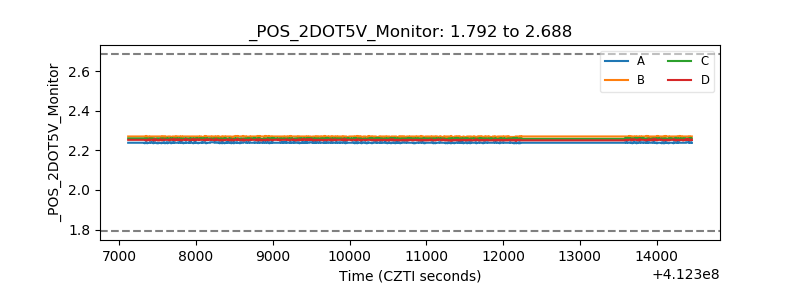 |
| +5 Volts monitor | 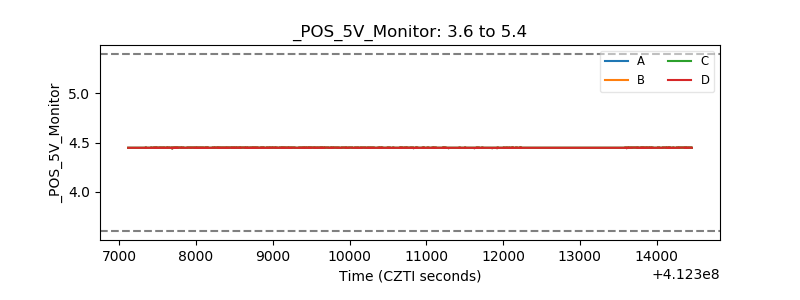 |
| _ROLL_ROT | 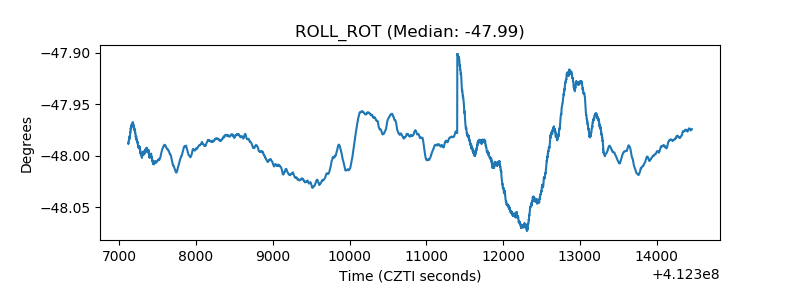 |
| _Roll_DEC | 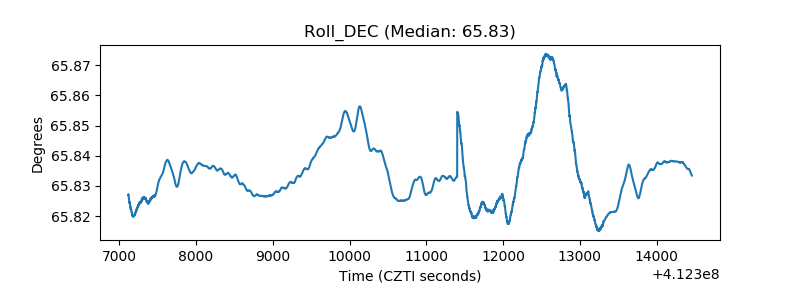 |
| _Roll_RA | 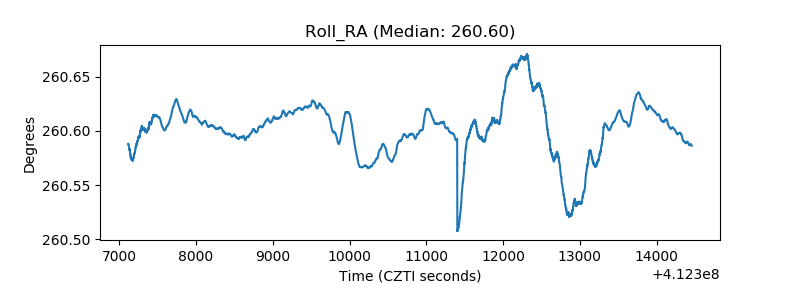 |
| Veto Counter | 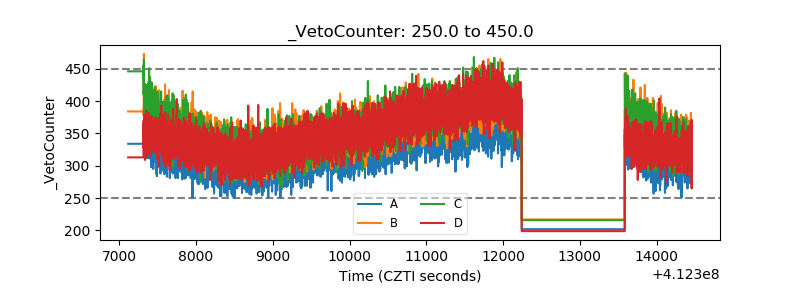 |