| Param | Original file | Final file |
|---|---|---|
| Filename | modeM0/AS1A12_018T01_9000005488_39614cztM0_level2.fits | modeM0/AS1A12_018T01_9000005488_39614cztM0_level2_quad_clean.evt |
| Size (bytes) | 784,468,800 | 170,026,560 |
| Size | 748.1 MB | 162.1 MB |
| Events in quadrant A | 6,710,856 | 1,146,407 |
| Events in quadrant B | 5,318,053 | 1,187,903 |
| Events in quadrant C | 10,342,485 | 1,024,544 |
| Events in quadrant D | 5,835,389 | 1,045,676 |
| Mode SS | |||
|---|---|---|---|
| Quadrant | BADHDUFLAG | Total packets | Discarded packets |
| A | 0 | 218 | 0 |
| B | 0 | 218 | 0 |
| C | 0 | 218 | 0 |
| D | 0 | 218 | 0 |
| Mode M0 | |||
|---|---|---|---|
| Quadrant | BADHDUFLAG | Total packets | Discarded packets |
| A | 0 | 26555 | 4 |
| B | 0 | 23605 | 3 |
| C | 0 | 37916 | 3 |
| D | 0 | 24899 | 3 |
| Mode M9 | |||
|---|---|---|---|
| Quadrant | BADHDUFLAG | Total packets | Discarded packets |
| A | 0 | 30 | 0 |
| B | 0 | 30 | 0 |
| C | 0 | 30 | 0 |
| D | 0 | 31 | 0 |
| Quadrant | Total seconds | Saturated seconds | Saturation percentage |
|---|---|---|---|
| A | 10737 | 281 | 2.617118% |
| B | 10737 | 157 | 1.462233% |
| C | 10737 | 1172 | 10.915526% |
| D | 10737 | 171 | 1.592624% |
Noise dominated data is calculated using 1-second bins in cleaned event files. If a bin has >2000 counts, and if more than 50% of those come from <1% of pixels, then it is considered to be noise-dominated and hence unusable.
| Quadrant | # 1 sec bins | Bins with >0 counts | Bins with >2000 counts | High rate bins dominated by noise | Noise dominated (total time) | Noise dominated (detector-on time) | Marked lightcurve |
|---|---|---|---|---|---|---|---|
| A | 13539 | 10738 | 203 | 203 | 1.50% | 1.89% | 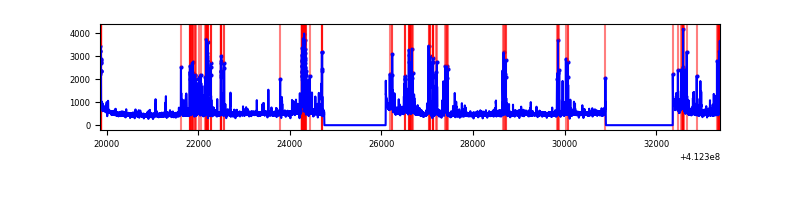 |
| B | 13540 | 10739 | 96 | 96 | 0.71% | 0.89% | 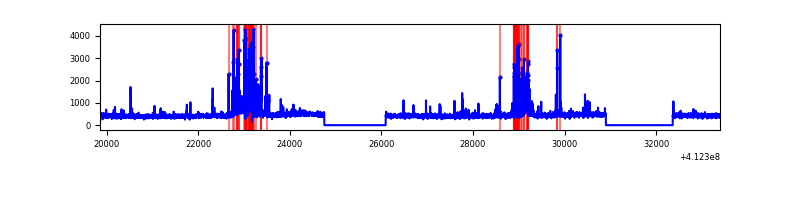 |
| C | 13540 | 10739 | 1042 | 1042 | 7.70% | 9.70% | 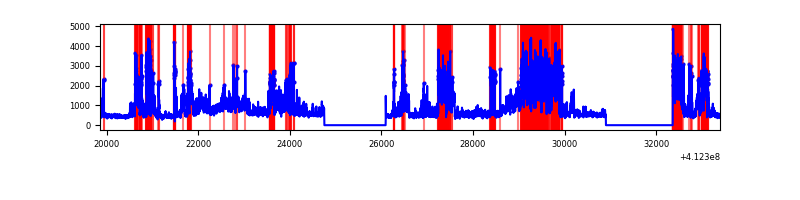 |
| D | 13540 | 10739 | 139 | 139 | 1.03% | 1.29% | 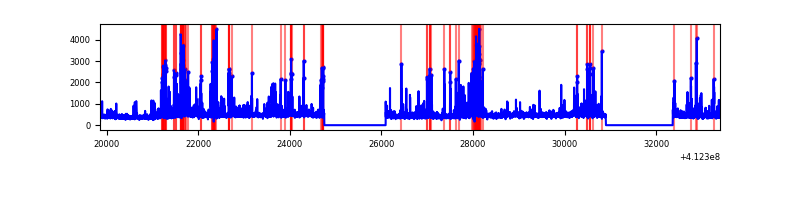 |
Top three noisy pixels from each quadrant. If the there are fewer than three noisy pixels in the level2.evt file, extra rows are filled as -1
| Pixel properties | Quadrant properties | ||||||
|---|---|---|---|---|---|---|---|
| Quadrant | DetID | PixID | Counts | Sigma | Mean | Median | Sigma |
| A | 13 | 248 | 1252905 | 5308.13 | 1154 | 1131 | 235.8 |
| A | 10 | 83 | 807421 | 3419.06 | 1154 | 1131 | 235.8 |
| A | 0 | 8 | 75768 | 316.5 | 1154 | 1131 | 235.8 |
| B | 5 | 255 | 759859 | 3444.92 | 1148 | 1115 | 220.3 |
| B | 4 | 170 | 36232 | 159.44 | 1148 | 1115 | 220.3 |
| B | 12 | 111 | 28360 | 123.7 | 1148 | 1115 | 220.3 |
| C | 9 | 187 | 5324950 | 21184.01 | 1086 | 1093 | 251.3 |
| C | 15 | 214 | 454795 | 1805.31 | 1086 | 1093 | 251.3 |
| C | 15 | 208 | 300760 | 1192.4 | 1086 | 1093 | 251.3 |
| D | 2 | 249 | 747537 | 2708.66 | 1129 | 1097 | 275.6 |
| D | 12 | 227 | 165130 | 595.24 | 1129 | 1097 | 275.6 |
| D | 2 | 250 | 133145 | 479.17 | 1129 | 1097 | 275.6 |
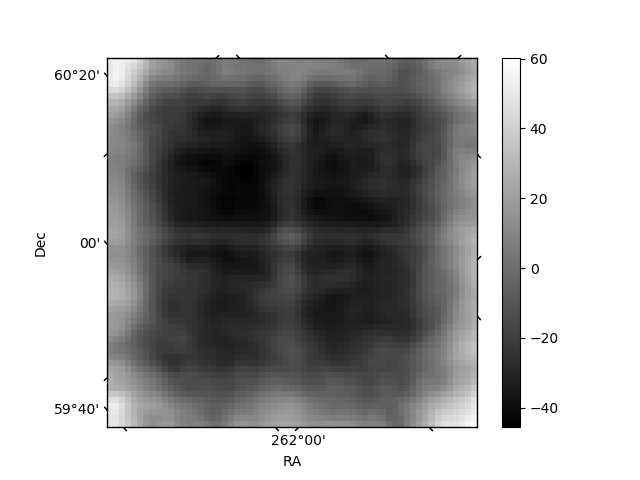
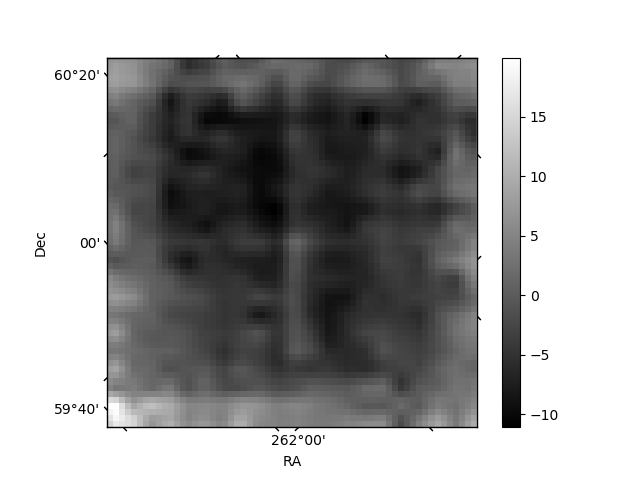
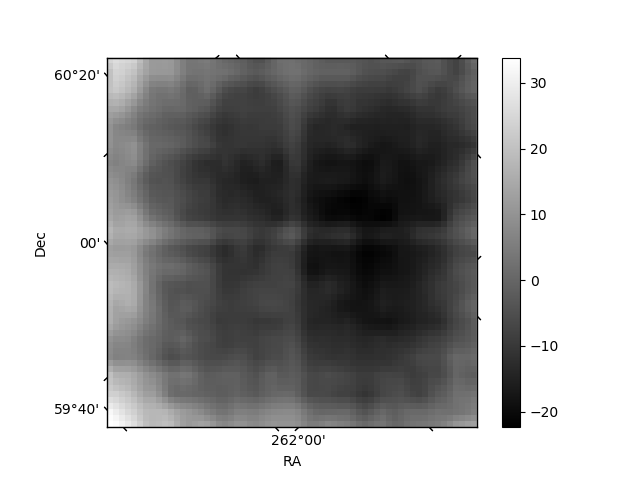
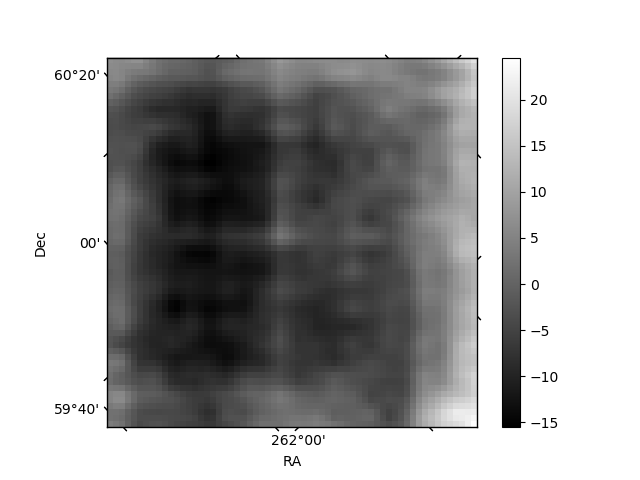
Histogram calculated using DETX and DETY for each event in the final _common_clean file
| Quadrant A | 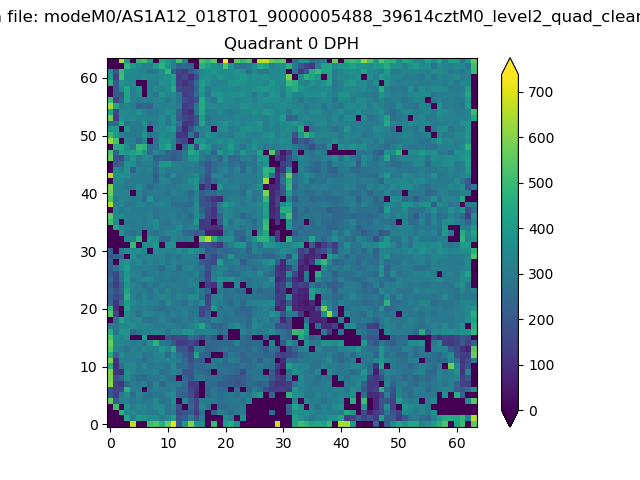 |
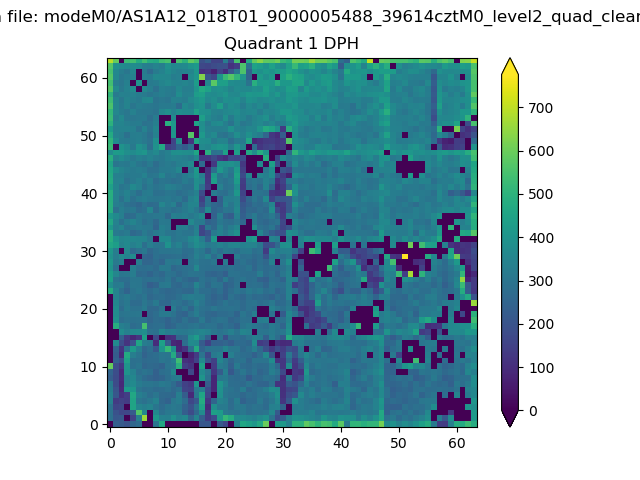 |
Quadrant B |
|---|---|---|---|
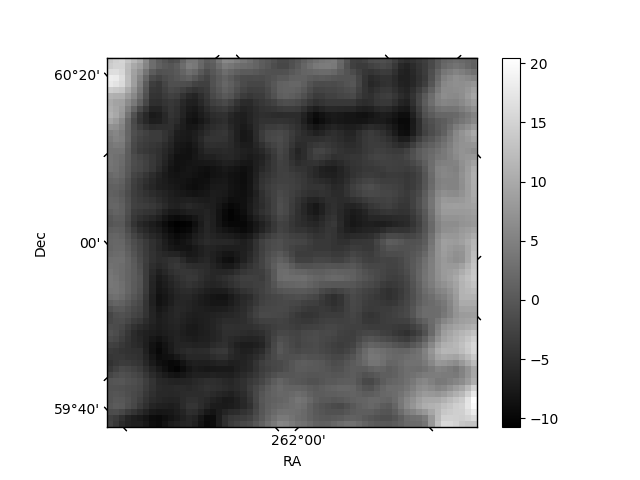
| Quadrant D | 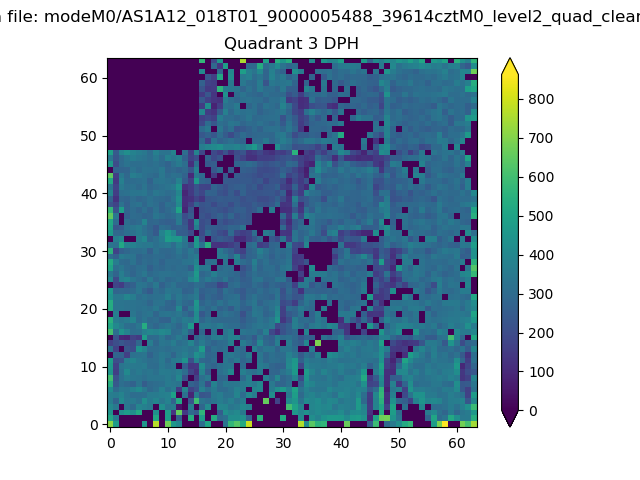 |
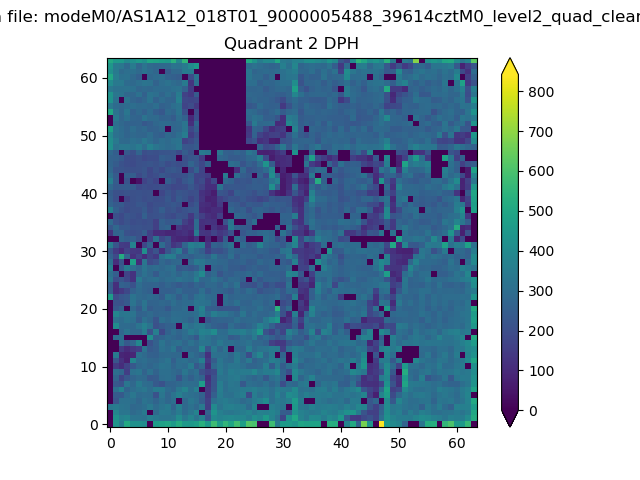 |
Quadrant C |
| Plot type | Count rate plots | Images |
|---|---|---|
| Comparison with Poisson distribution Blue bars denote a histogram of data divided into 1 sec bins. Red curve is a Poisson curve with rate = median count rate of data. |
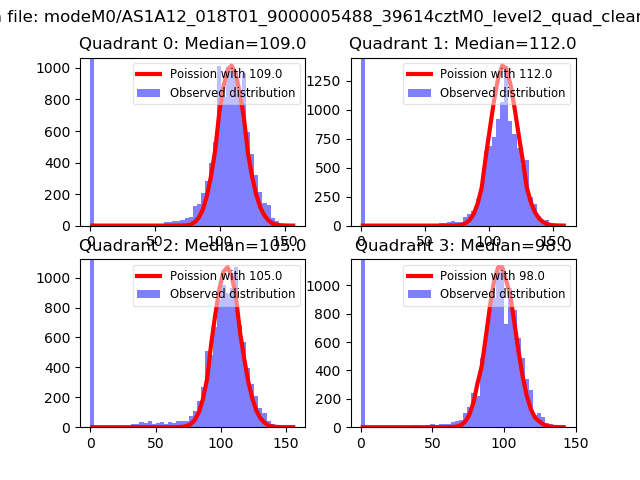 |
 |
| Quadrant-wise count rates Data is divided into 100 sec bins |
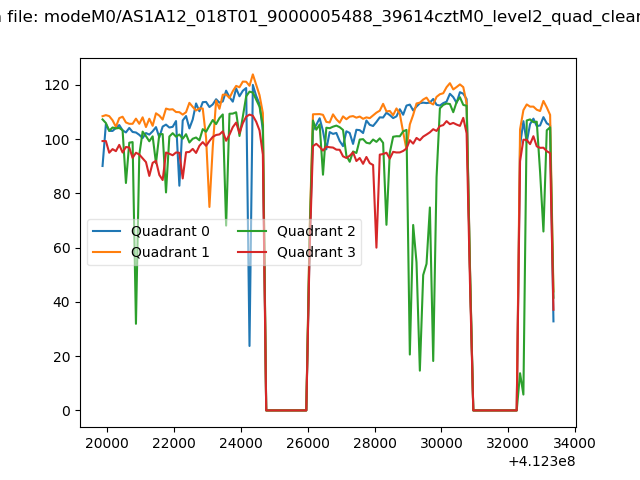 |
|
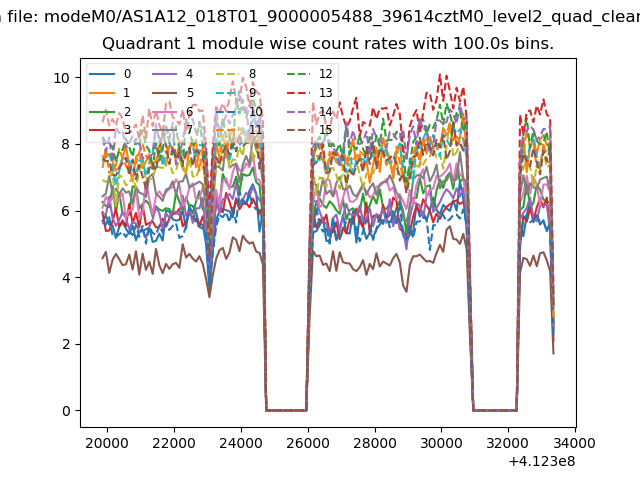
| Module-wise count rates for Quadrant A Data is divided into 100 sec bins |
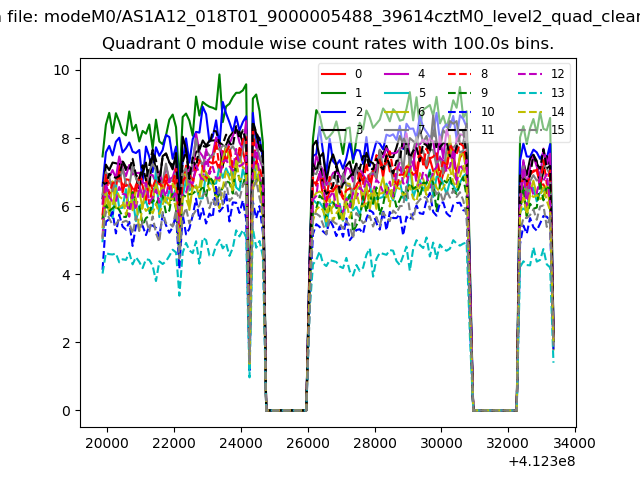 |
 |
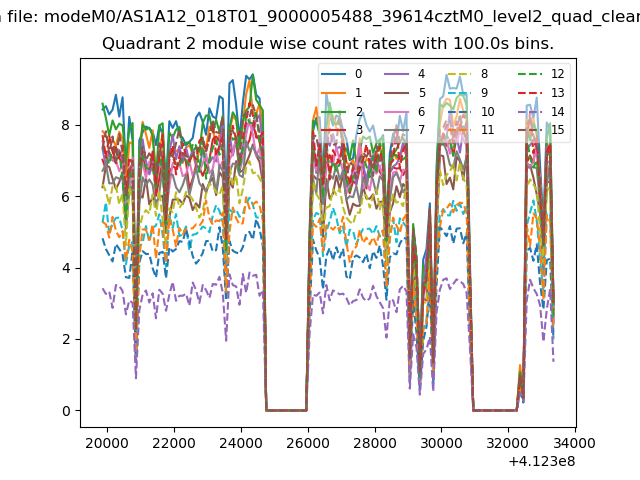
| Module-wise count rates for Quadrant B Data is divided into 100 sec bins |
 |
 |
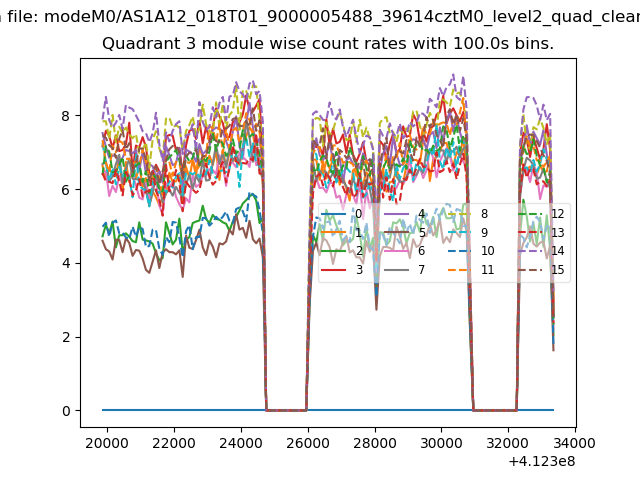
| Module-wise count rates for Quadrant C Data is divided into 100 sec bins |
 |
 |
| Module-wise count rates for Quadrant D Data is divided into 100 sec bins |
 |
 |
| Parameter | Plot |
|---|---|
| CZT HV Monitor | 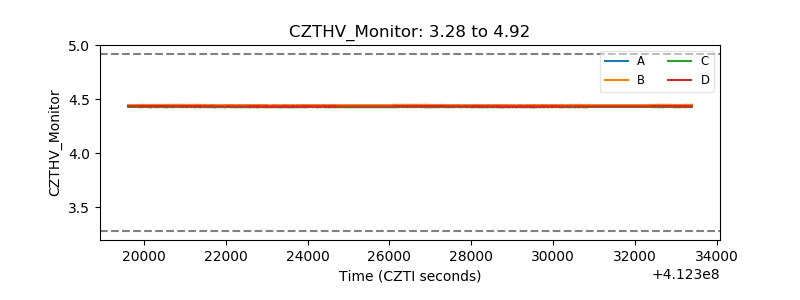 |
| D_VDD | 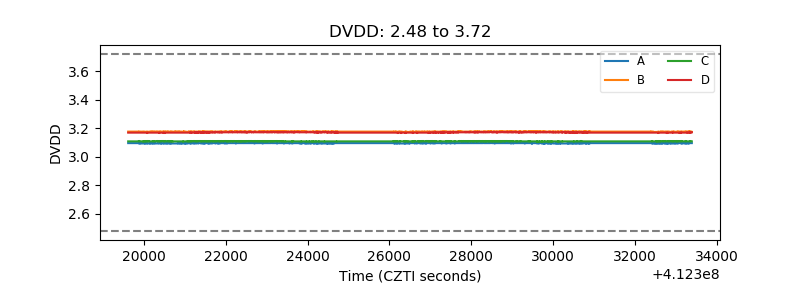 |
| Temperature 1 | 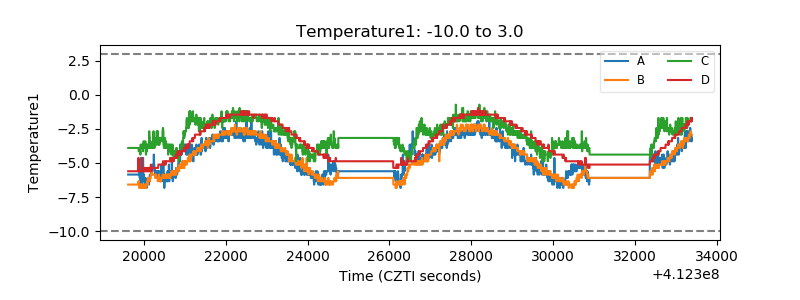 |
| Veto HV Monitor | 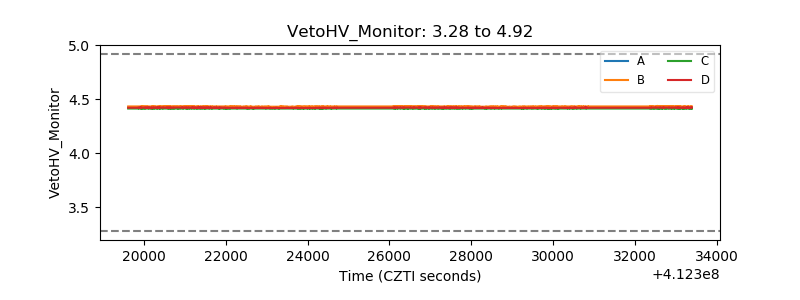 |
| Veto LLD | 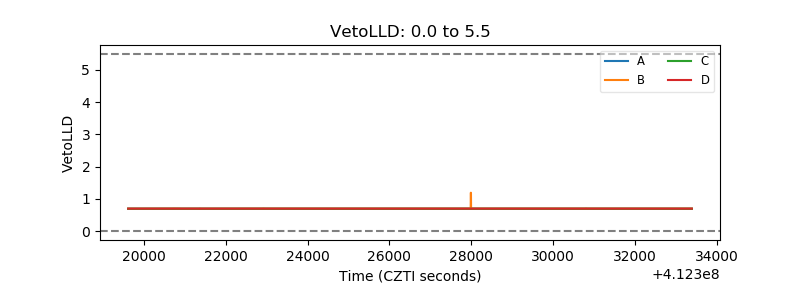 |
| Alpha Counter | 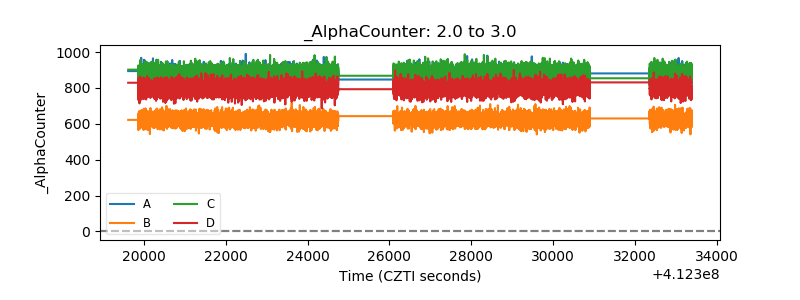 |
| _CPM_Rate | 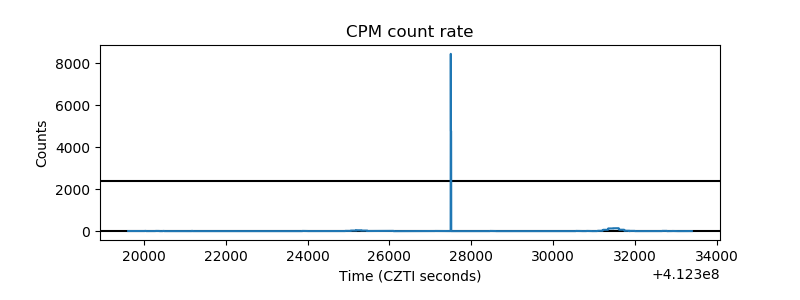 |
| CZT Counter | 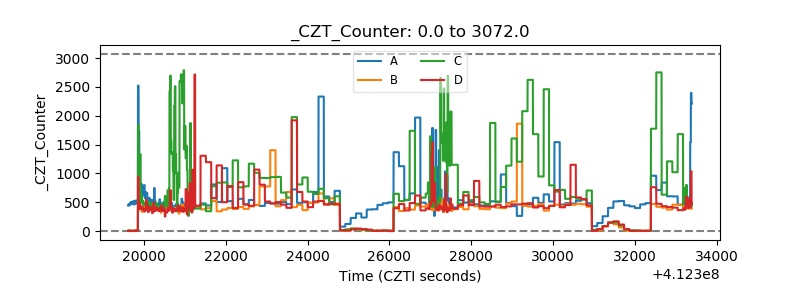 |
| +2.5 Volts monitor | 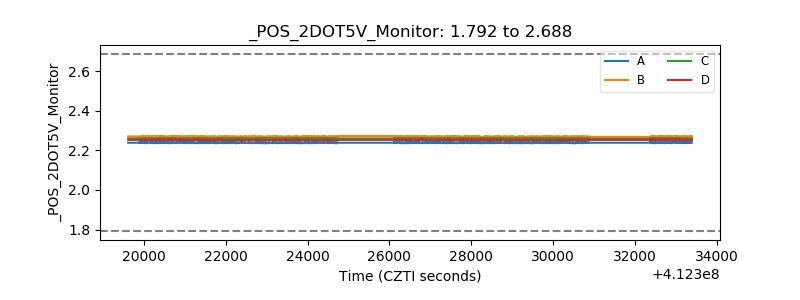 |
| +5 Volts monitor | 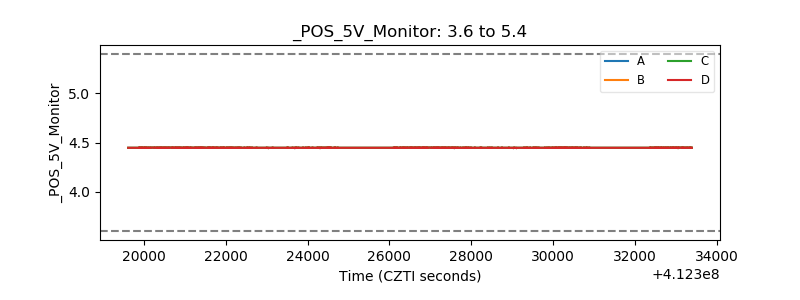 |
| _ROLL_ROT | 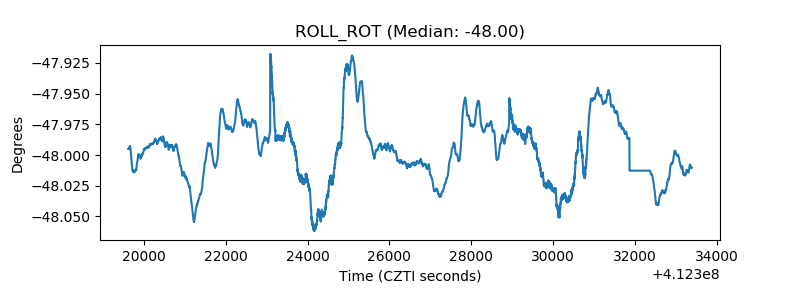 |
| _Roll_DEC | 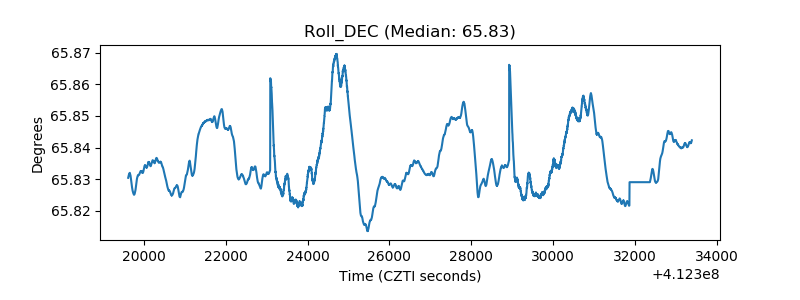 |
| _Roll_RA | 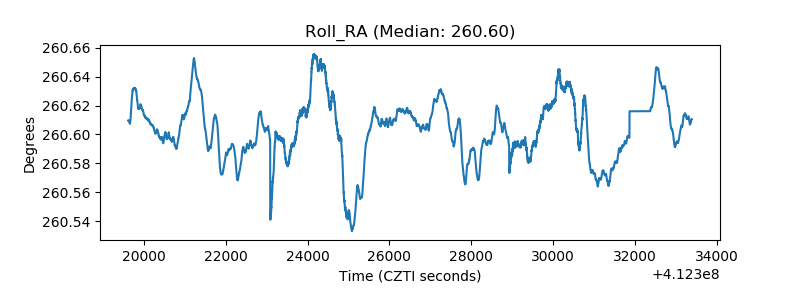 |
| Veto Counter | 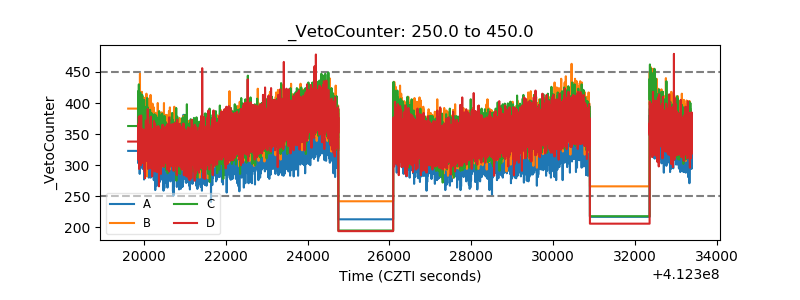 |