| Param | Original file | Final file |
|---|---|---|
| Filename | modeM0/AS1A12_018T01_9000005488_39618cztM0_level2.fits | modeM0/AS1A12_018T01_9000005488_39618cztM0_level2_quad_clean.evt |
| Size (bytes) | 407,148,480 | 98,176,320 |
| Size | 388.3 MB | 93.6 MB |
| Events in quadrant A | 3,315,880 | 678,328 |
| Events in quadrant B | 2,792,701 | 682,767 |
| Events in quadrant C | 4,643,683 | 633,411 |
| Events in quadrant D | 3,886,938 | 588,659 |
| Mode SS | |||
|---|---|---|---|
| Quadrant | BADHDUFLAG | Total packets | Discarded packets |
| A | 0 | 116 | 0 |
| B | 0 | 116 | 0 |
| C | 0 | 116 | 0 |
| D | 0 | 116 | 0 |
| Mode M0 | |||
|---|---|---|---|
| Quadrant | BADHDUFLAG | Total packets | Discarded packets |
| A | 0 | 13482 | 3 |
| B | 0 | 12053 | 2 |
| C | 0 | 17558 | 2 |
| D | 0 | 15208 | 2 |
| Mode M9 | |||
|---|---|---|---|
| Quadrant | BADHDUFLAG | Total packets | Discarded packets |
| A | 0 | 18 | 0 |
| B | 0 | 18 | 0 |
| C | 0 | 18 | 0 |
| D | 0 | 18 | 0 |
| Quadrant | Total seconds | Saturated seconds | Saturation percentage |
|---|---|---|---|
| A | 5562 | 19 | 0.341604% |
| B | 5562 | 69 | 1.240561% |
| C | 5562 | 193 | 3.469975% |
| D | 5563 | 221 | 3.972677% |
Noise dominated data is calculated using 1-second bins in cleaned event files. If a bin has >2000 counts, and if more than 50% of those come from <1% of pixels, then it is considered to be noise-dominated and hence unusable.
| Quadrant | # 1 sec bins | Bins with >0 counts | Bins with >2000 counts | High rate bins dominated by noise | Noise dominated (total time) | Noise dominated (detector-on time) | Marked lightcurve |
|---|---|---|---|---|---|---|---|
| A | 7414 | 5563 | 8 | 8 | 0.11% | 0.14% | 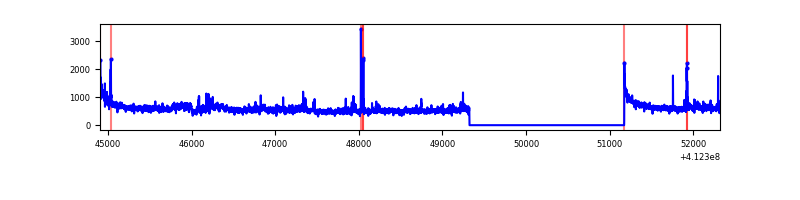 |
| B | 7414 | 5563 | 45 | 45 | 0.61% | 0.81% | 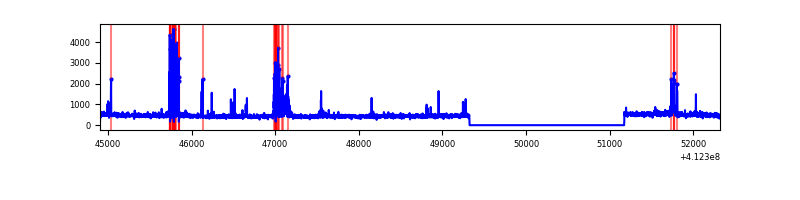 |
| C | 7414 | 5563 | 218 | 218 | 2.94% | 3.92% | 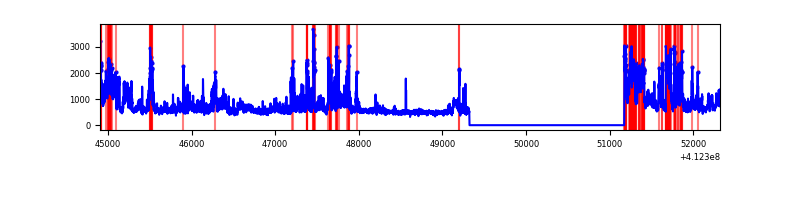 |
| D | 7415 | 5564 | 201 | 201 | 2.71% | 3.61% | 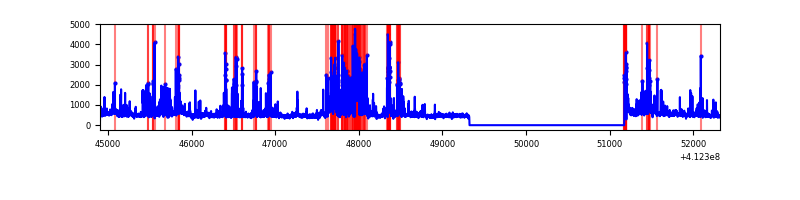 |
Top three noisy pixels from each quadrant. If the there are fewer than three noisy pixels in the level2.evt file, extra rows are filled as -1
| Pixel properties | Quadrant properties | ||||||
|---|---|---|---|---|---|---|---|
| Quadrant | DetID | PixID | Counts | Sigma | Mean | Median | Sigma |
| A | 10 | 83 | 471607 | 3700.22 | 634 | 621 | 127.3 |
| A | 15 | 222 | 311079 | 2439.06 | 634 | 621 | 127.3 |
| A | 15 | 223 | 30872 | 237.66 | 634 | 621 | 127.3 |
| B | 5 | 255 | 320667 | 2693.74 | 624 | 606 | 118.8 |
| B | 0 | 213 | 18863 | 153.66 | 624 | 606 | 118.8 |
| B | 12 | 111 | 14582 | 117.63 | 624 | 606 | 118.8 |
| C | 9 | 187 | 1469003 | 10315.15 | 613 | 618 | 142.4 |
| C | 15 | 208 | 527385 | 3700.45 | 613 | 618 | 142.4 |
| C | 15 | 214 | 230784 | 1616.88 | 613 | 618 | 142.4 |
| D | 2 | 249 | 790955 | 5252.3 | 618 | 601 | 150.5 |
| D | 13 | 249 | 145639 | 963.85 | 618 | 601 | 150.5 |
| D | 13 | 174 | 123386 | 815.97 | 618 | 601 | 150.5 |
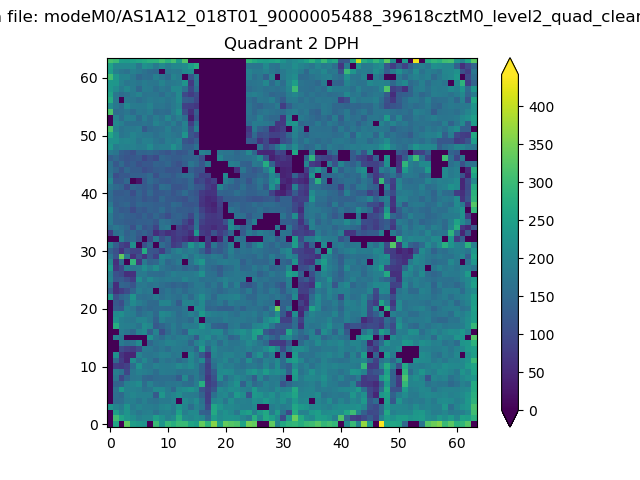
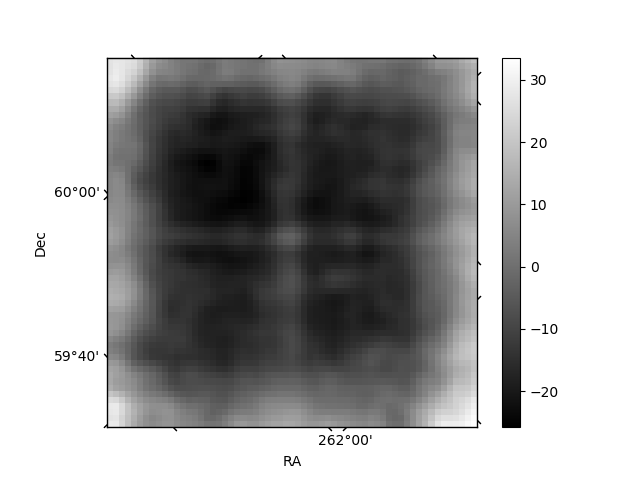
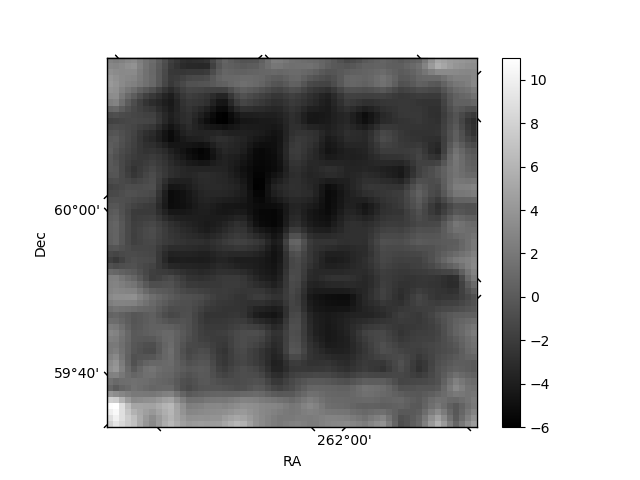
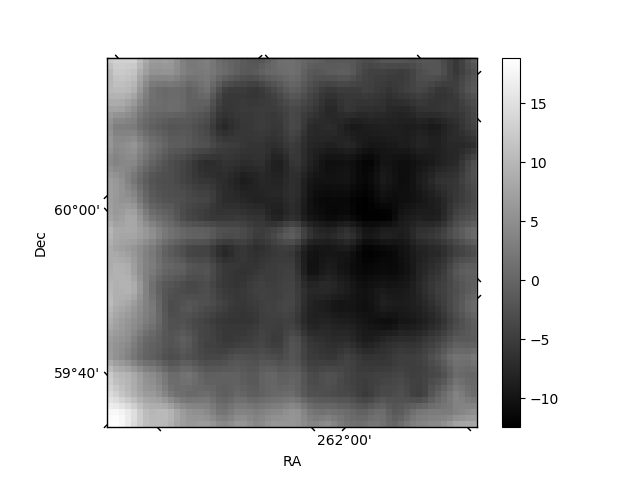
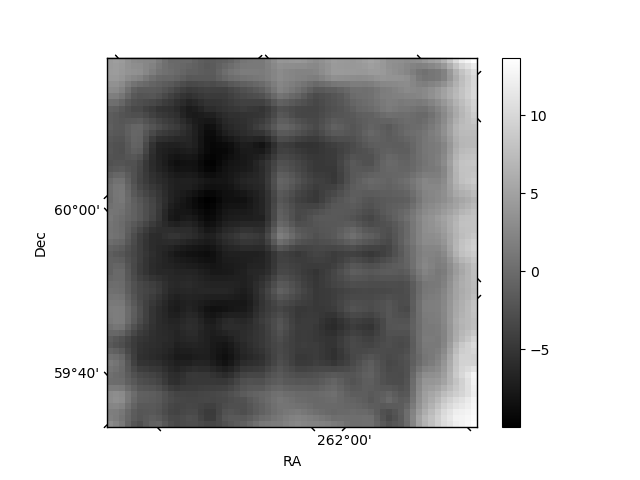
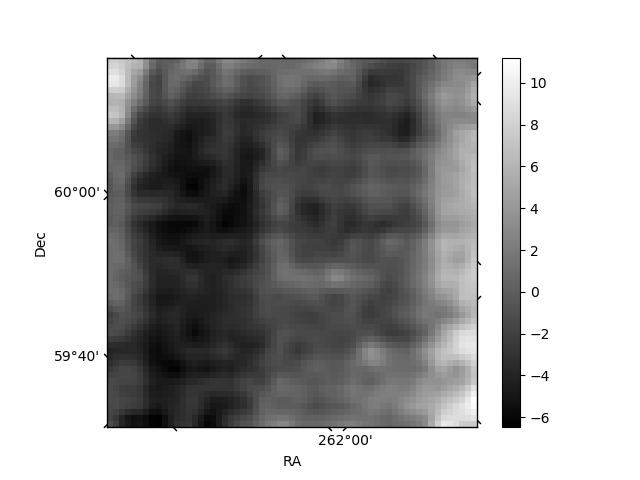
Histogram calculated using DETX and DETY for each event in the final _common_clean file
| Quadrant A | 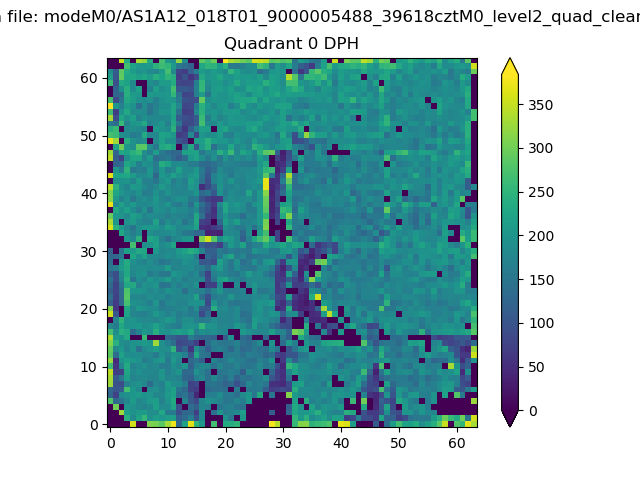 |
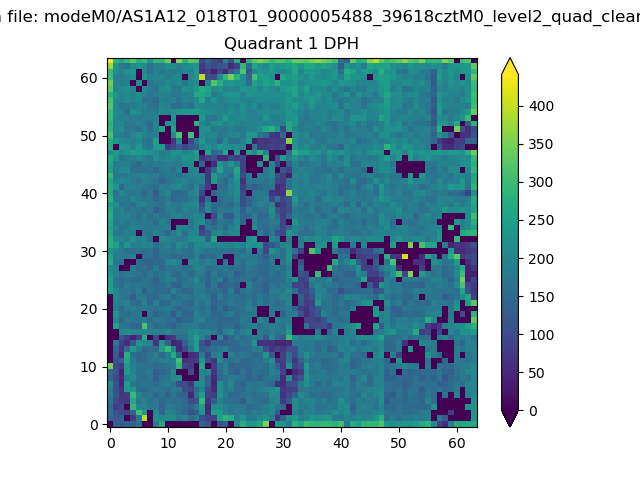 |
Quadrant B |
|---|---|---|---|
| Quadrant D | 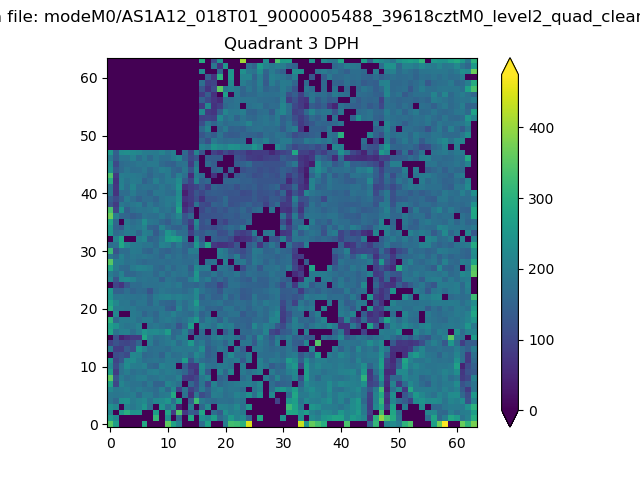 |
 |
Quadrant C |
| Plot type | Count rate plots | Images |
|---|---|---|
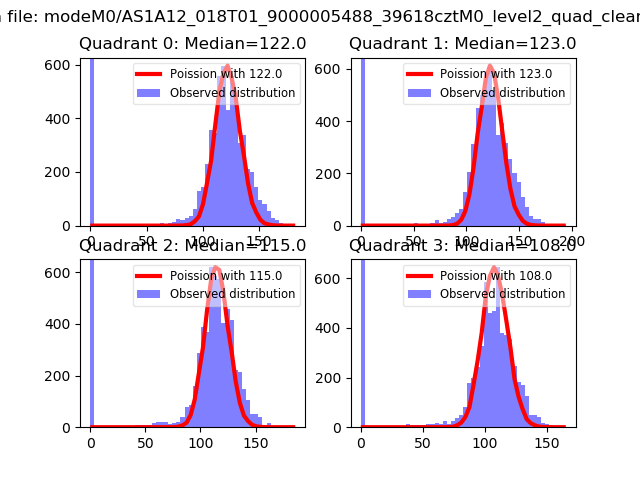
| Comparison with Poisson distribution Blue bars denote a histogram of data divided into 1 sec bins. Red curve is a Poisson curve with rate = median count rate of data. |
 |
 |
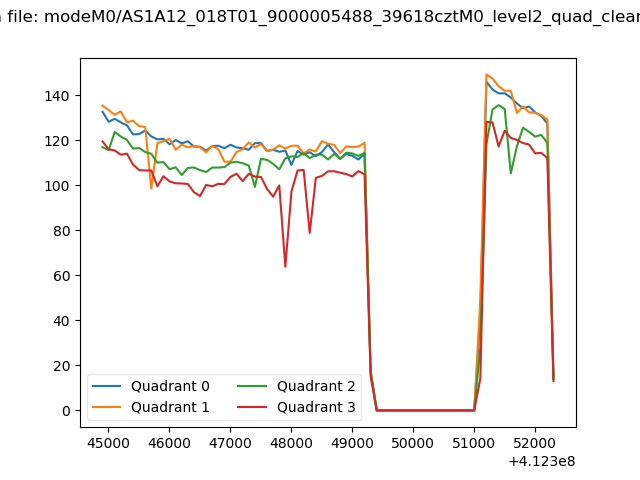
| Quadrant-wise count rates Data is divided into 100 sec bins |
 |
|
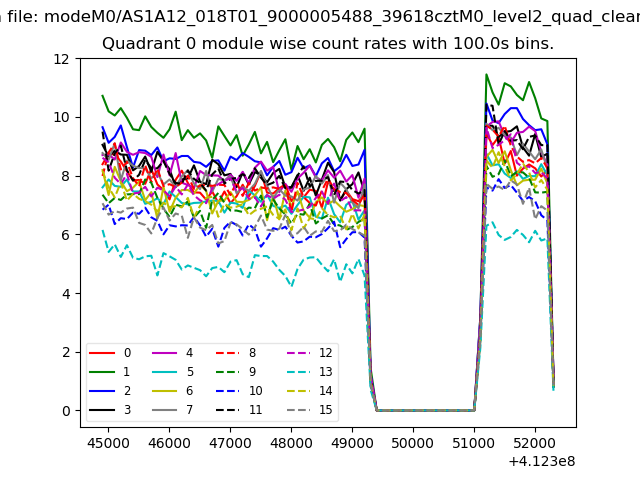
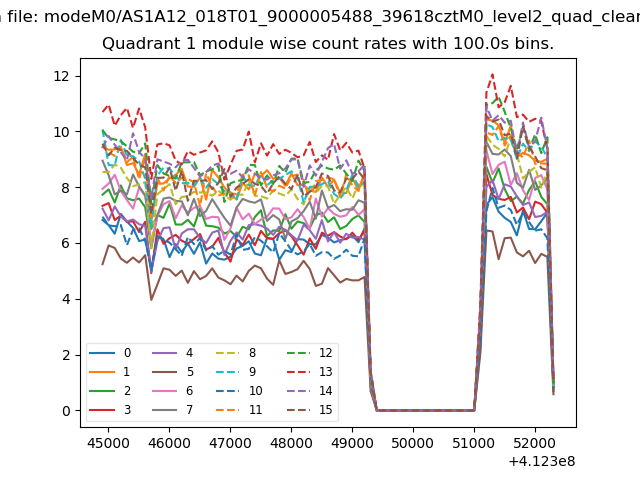
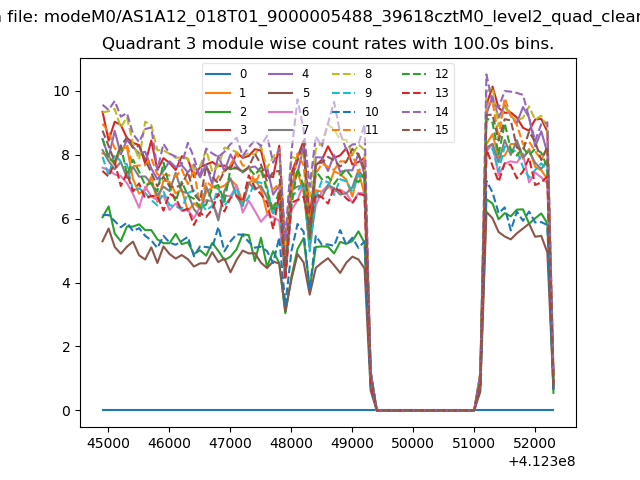
| Module-wise count rates for Quadrant A Data is divided into 100 sec bins |
 |
 |
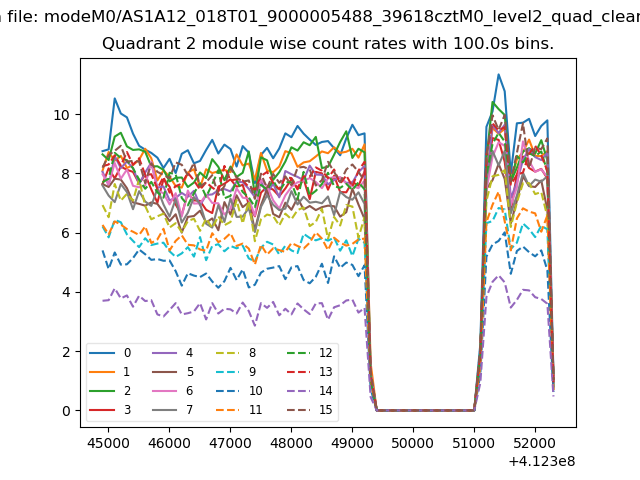
| Module-wise count rates for Quadrant B Data is divided into 100 sec bins |
 |
 |
| Module-wise count rates for Quadrant C Data is divided into 100 sec bins |
 |
 |
| Module-wise count rates for Quadrant D Data is divided into 100 sec bins |
 |
 |
| Parameter | Plot |
|---|---|
| CZT HV Monitor | 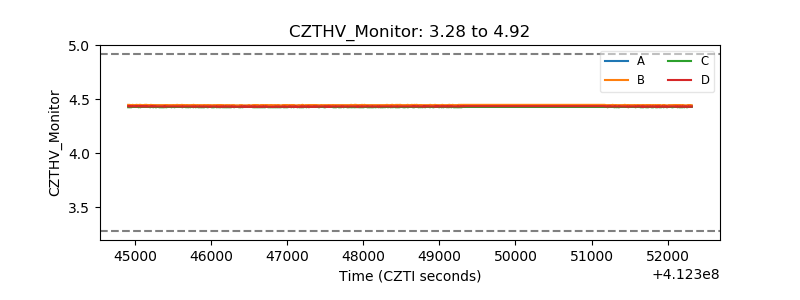 |
| D_VDD | 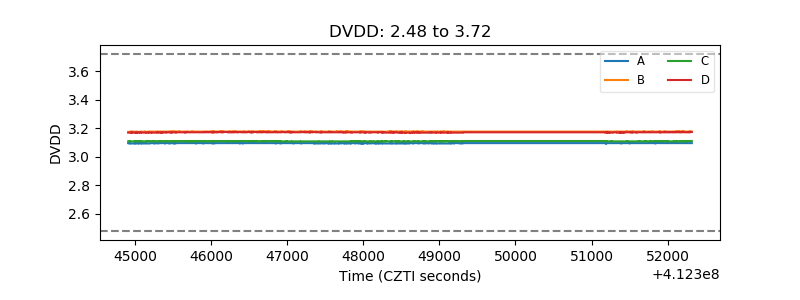 |
| Temperature 1 | 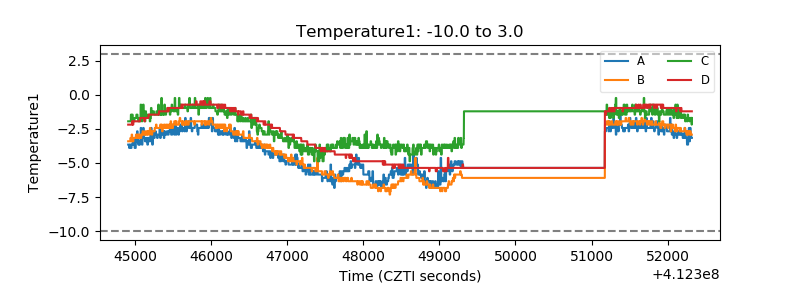 |
| Veto HV Monitor | 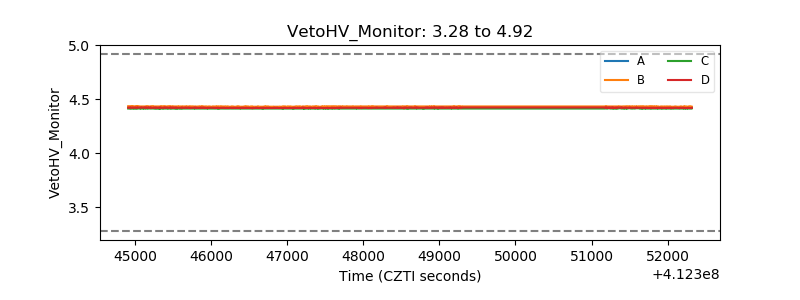 |
| Veto LLD | 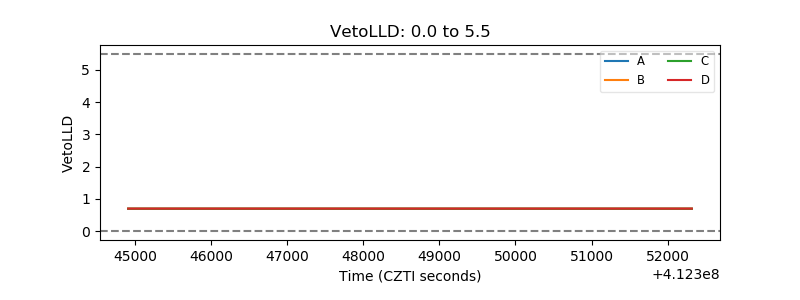 |
| Alpha Counter | 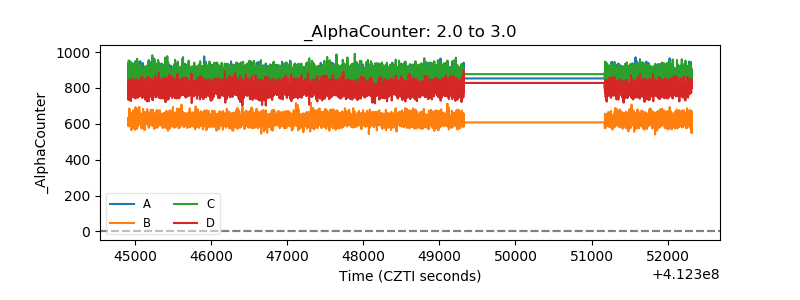 |
| _CPM_Rate | 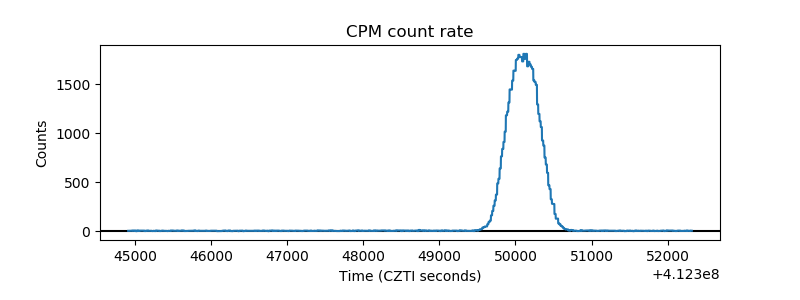 |
| CZT Counter | 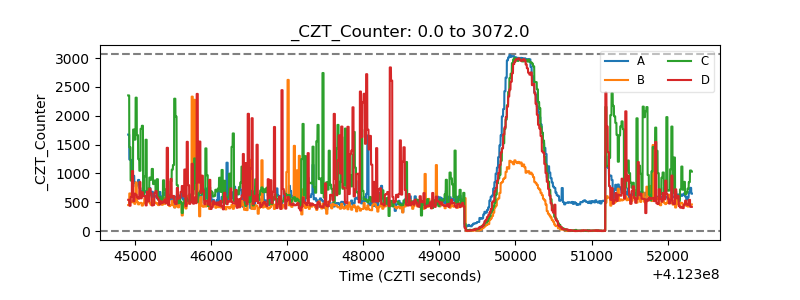 |
| +2.5 Volts monitor | 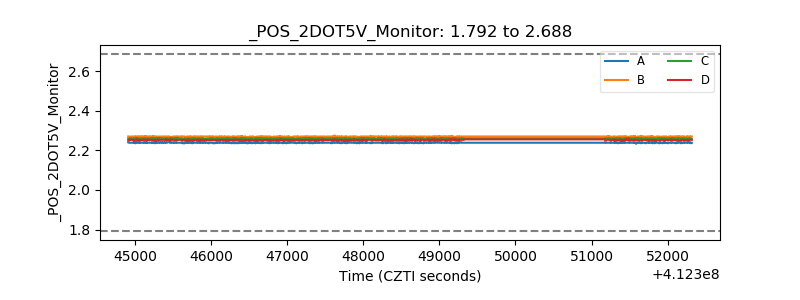 |
| +5 Volts monitor | 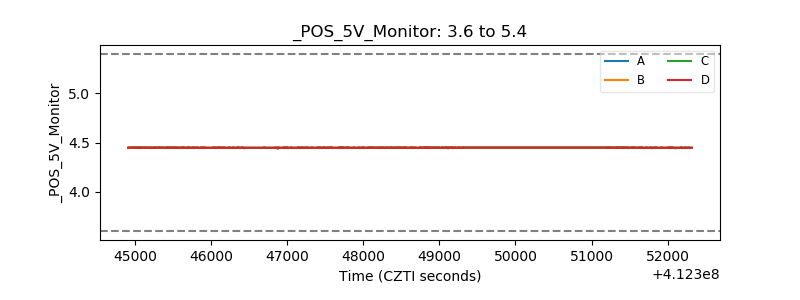 |
| _ROLL_ROT | 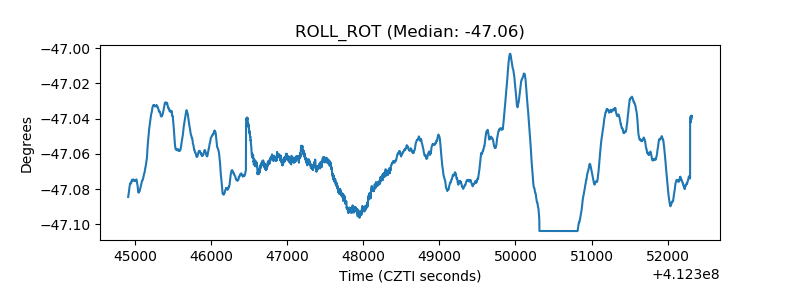 |
| _Roll_DEC | 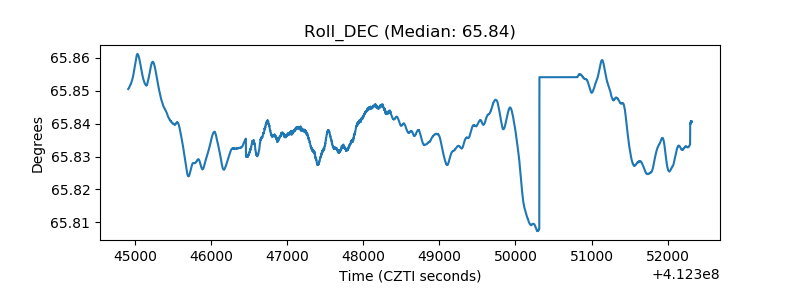 |
| _Roll_RA | 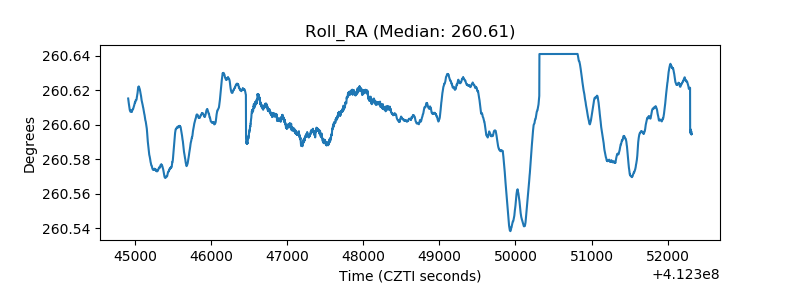 |
| Veto Counter | 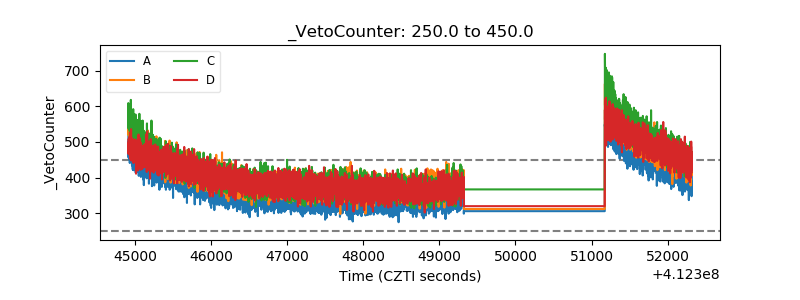 |