| Param | Original file | Final file |
|---|---|---|
| Filename | modeM0/AS1A12_018T01_9000005488_39619cztM0_level2.fits | modeM0/AS1A12_018T01_9000005488_39619cztM0_level2_quad_clean.evt |
| Size (bytes) | 397,776,960 | 96,667,200 |
| Size | 379.3 MB | 92.2 MB |
| Events in quadrant A | 2,984,348 | 679,852 |
| Events in quadrant B | 2,605,817 | 685,024 |
| Events in quadrant C | 5,744,830 | 588,337 |
| Events in quadrant D | 2,979,118 | 604,532 |
| Mode SS | |||
|---|---|---|---|
| Quadrant | BADHDUFLAG | Total packets | Discarded packets |
| A | 0 | 108 | 0 |
| B | 0 | 108 | 0 |
| C | 0 | 108 | 0 |
| D | 0 | 108 | 0 |
| Mode M0 | |||
|---|---|---|---|
| Quadrant | BADHDUFLAG | Total packets | Discarded packets |
| A | 0 | 12303 | 3 |
| B | 0 | 11158 | 2 |
| C | 0 | 20619 | 2 |
| D | 0 | 12446 | 2 |
| Mode M9 | |||
|---|---|---|---|
| Quadrant | BADHDUFLAG | Total packets | Discarded packets |
| A | 0 | 22 | 0 |
| B | 0 | 22 | 0 |
| C | 0 | 22 | 0 |
| D | 0 | 23 | 0 |
| Quadrant | Total seconds | Saturated seconds | Saturation percentage |
|---|---|---|---|
| A | 5276 | 16 | 0.303260% |
| B | 5276 | 26 | 0.492798% |
| C | 5276 | 678 | 12.850644% |
| D | 5276 | 70 | 1.326763% |
Noise dominated data is calculated using 1-second bins in cleaned event files. If a bin has >2000 counts, and if more than 50% of those come from <1% of pixels, then it is considered to be noise-dominated and hence unusable.
| Quadrant | # 1 sec bins | Bins with >0 counts | Bins with >2000 counts | High rate bins dominated by noise | Noise dominated (total time) | Noise dominated (detector-on time) | Marked lightcurve |
|---|---|---|---|---|---|---|---|
| A | 7249 | 5277 | 9 | 9 | 0.12% | 0.17% | 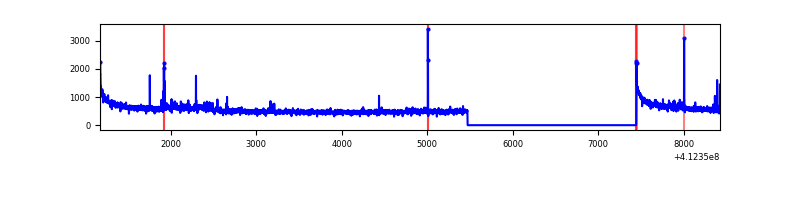 |
| B | 7249 | 5277 | 16 | 16 | 0.22% | 0.30% | 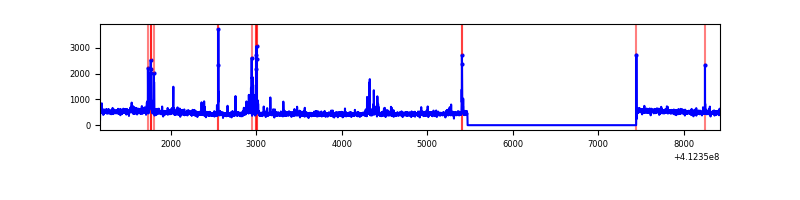 |
| C | 7249 | 5277 | 653 | 653 | 9.01% | 12.37% | 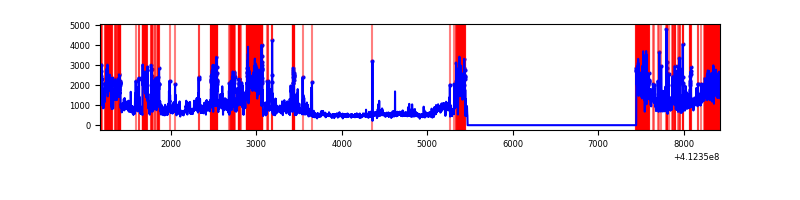 |
| D | 7249 | 5277 | 64 | 64 | 0.88% | 1.21% | 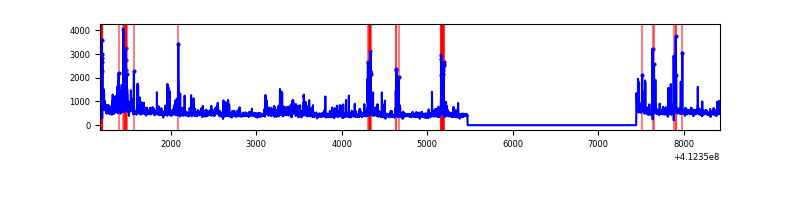 |
Top three noisy pixels from each quadrant. If the there are fewer than three noisy pixels in the level2.evt file, extra rows are filled as -1
| Pixel properties | Quadrant properties | ||||||
|---|---|---|---|---|---|---|---|
| Quadrant | DetID | PixID | Counts | Sigma | Mean | Median | Sigma |
| A | 10 | 83 | 465527 | 3701.69 | 620 | 610 | 125.6 |
| A | 15 | 222 | 59709 | 470.55 | 620 | 610 | 125.6 |
| A | 0 | 8 | 42532 | 333.79 | 620 | 610 | 125.6 |
| B | 5 | 255 | 135927 | 1168.15 | 614 | 599 | 115.8 |
| B | 5 | 172 | 38718 | 329.04 | 614 | 599 | 115.8 |
| B | 0 | 213 | 17109 | 142.51 | 614 | 599 | 115.8 |
| C | 9 | 187 | 2549913 | 18590.75 | 591 | 594 | 137.1 |
| C | 15 | 208 | 634677 | 4624.01 | 591 | 594 | 137.1 |
| C | 15 | 214 | 214797 | 1562.06 | 591 | 594 | 137.1 |
| D | 2 | 249 | 168707 | 1139.57 | 610 | 596 | 147.5 |
| D | 12 | 227 | 134508 | 907.75 | 610 | 596 | 147.5 |
| D | 12 | 233 | 74415 | 500.4 | 610 | 596 | 147.5 |
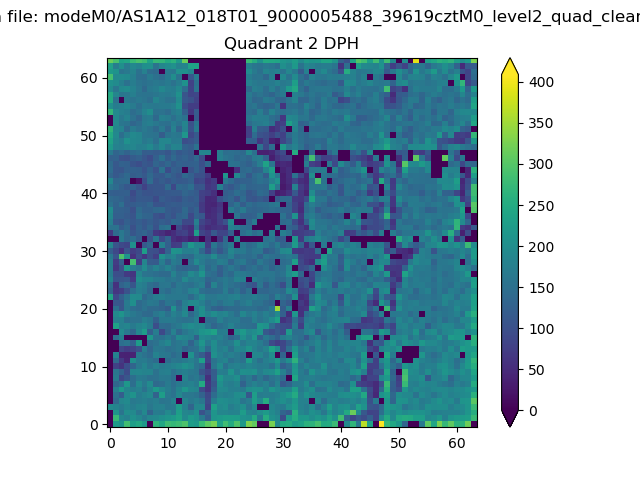
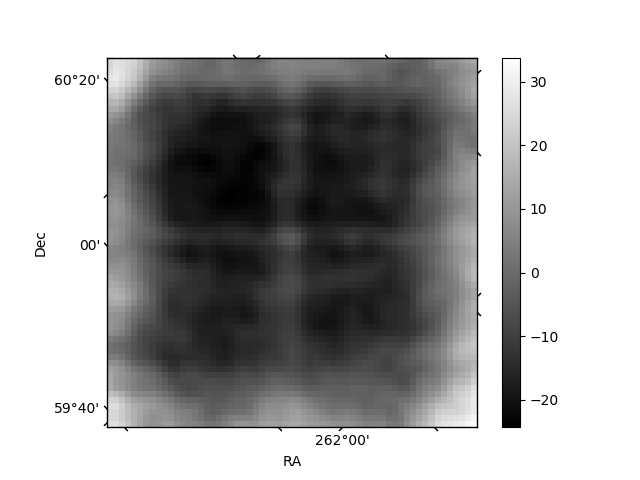
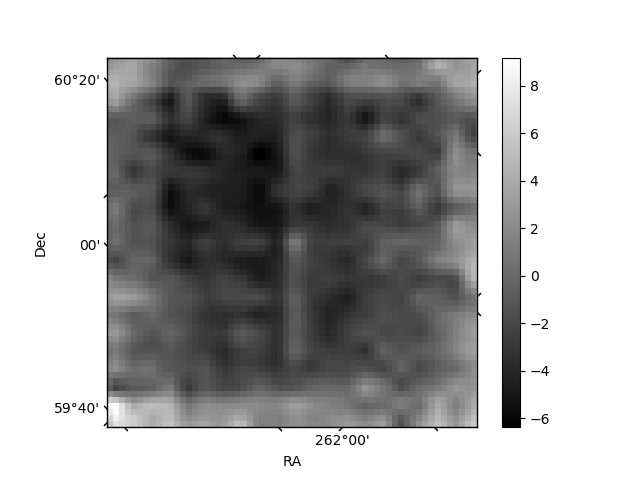
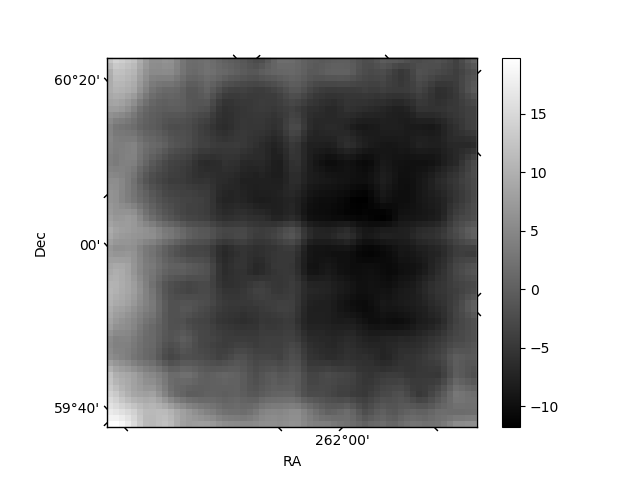
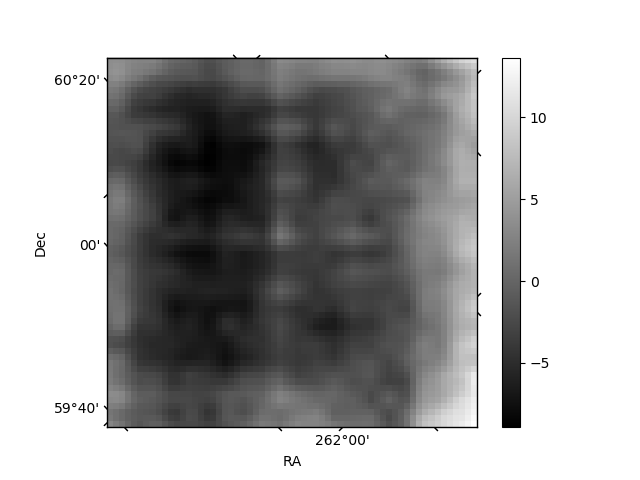
Histogram calculated using DETX and DETY for each event in the final _common_clean file
| Quadrant A | 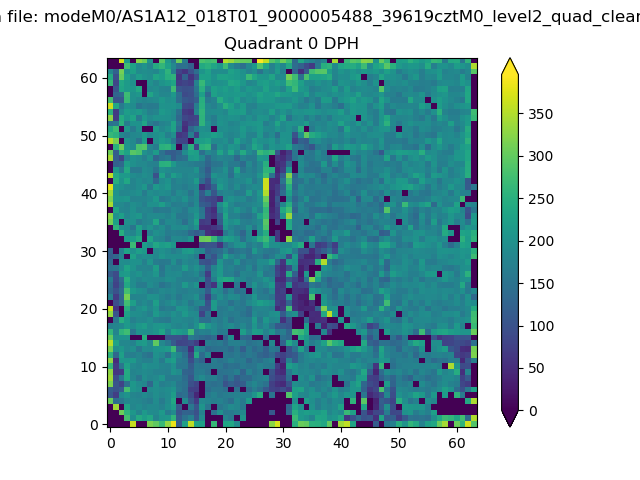 |
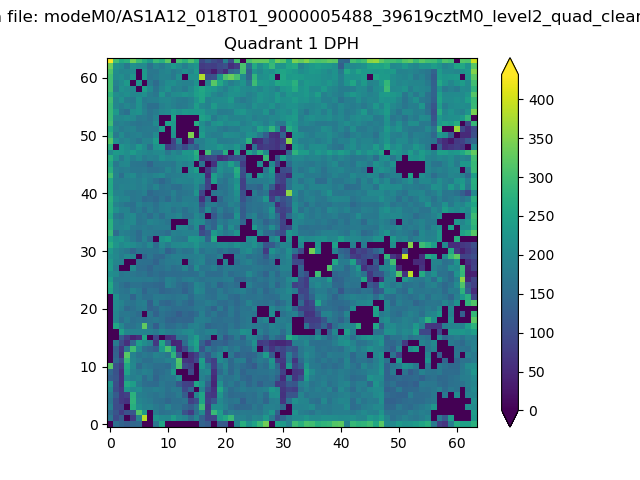 |
Quadrant B |
|---|---|---|---|
| Quadrant D | 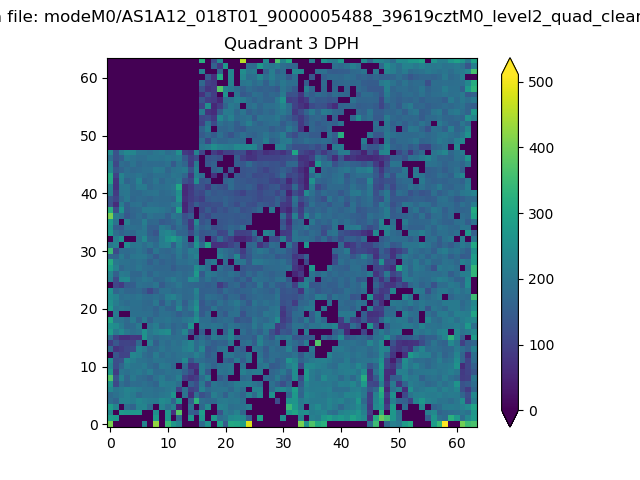 |
 |
Quadrant C |
| Plot type | Count rate plots | Images |
|---|---|---|
| Comparison with Poisson distribution Blue bars denote a histogram of data divided into 1 sec bins. Red curve is a Poisson curve with rate = median count rate of data. |
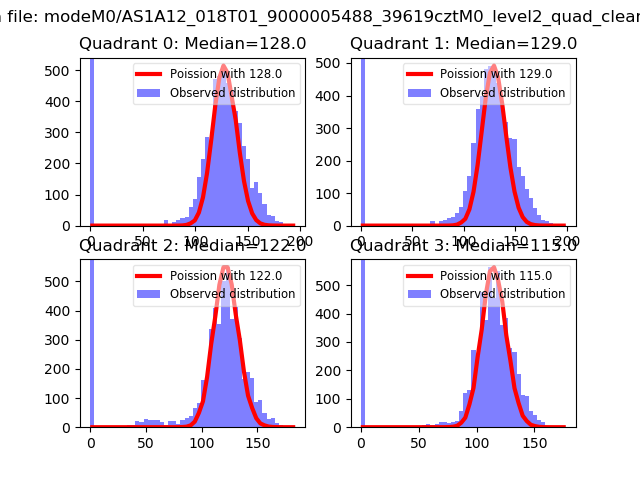 |
 |
| Quadrant-wise count rates Data is divided into 100 sec bins |
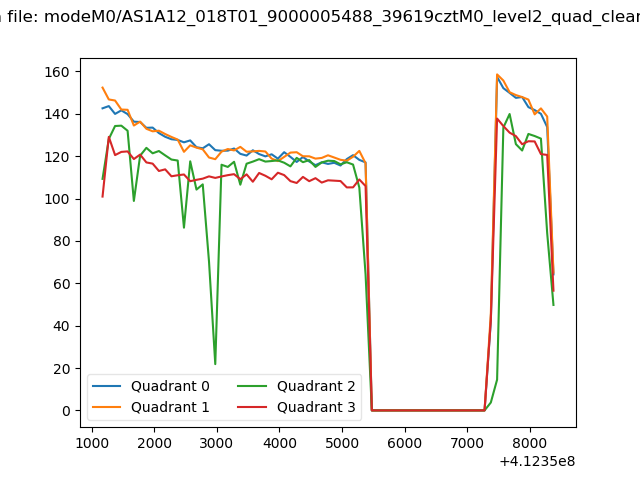 |
|
| Module-wise count rates for Quadrant A Data is divided into 100 sec bins |
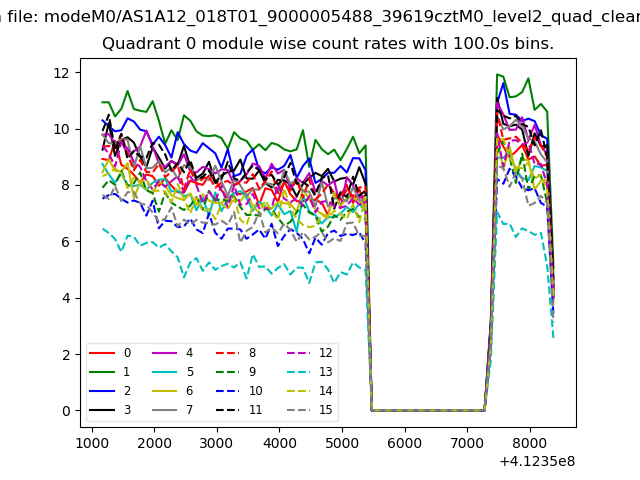 |
 |
| Module-wise count rates for Quadrant B Data is divided into 100 sec bins |
 |
 |
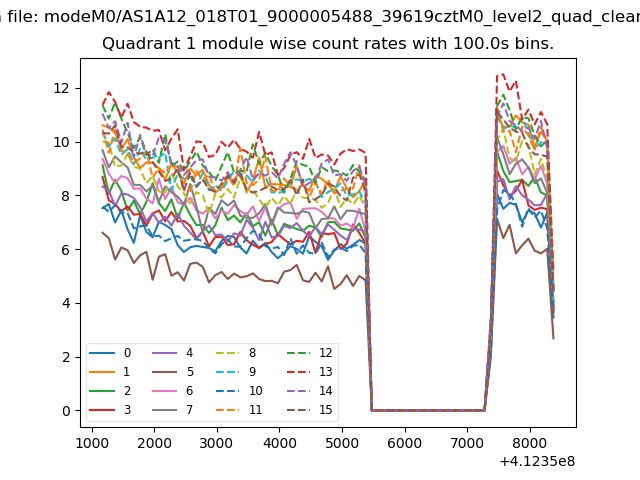
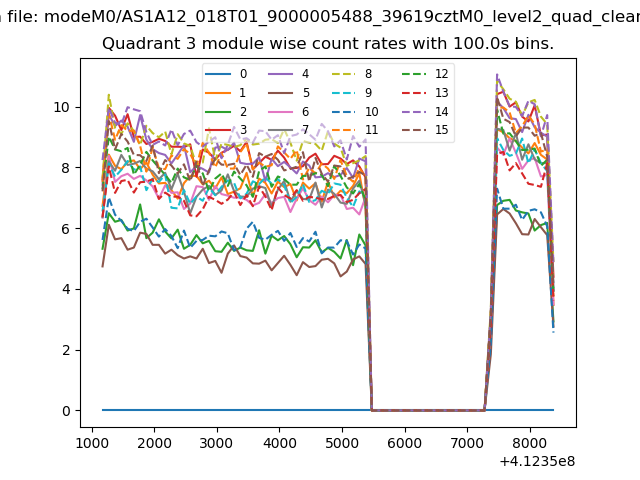
| Module-wise count rates for Quadrant C Data is divided into 100 sec bins |
 |
 |
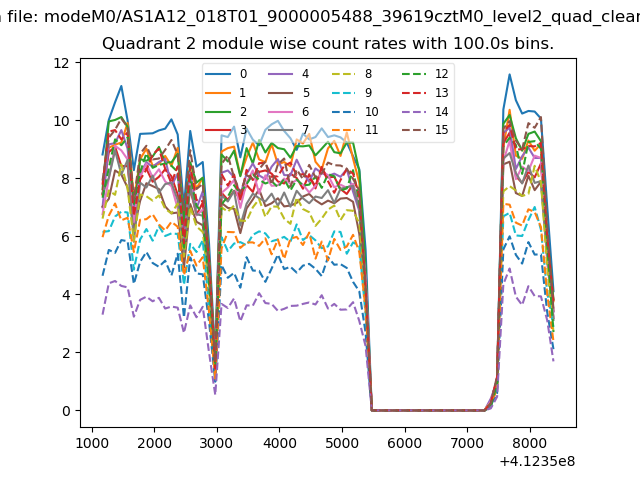
| Module-wise count rates for Quadrant D Data is divided into 100 sec bins |
 |
 |
| Parameter | Plot |
|---|---|
| CZT HV Monitor | 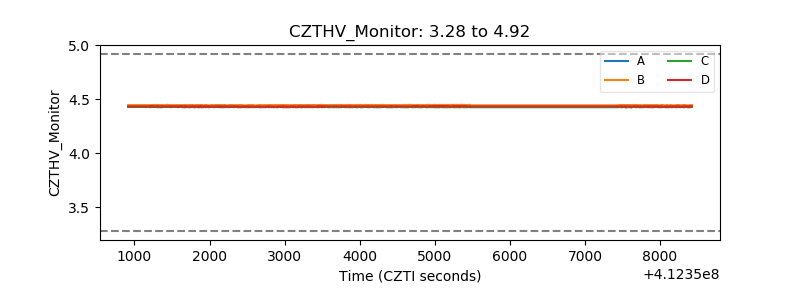 |
| D_VDD | 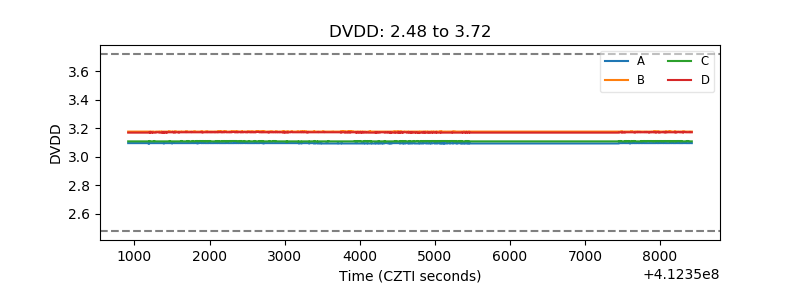 |
| Temperature 1 | 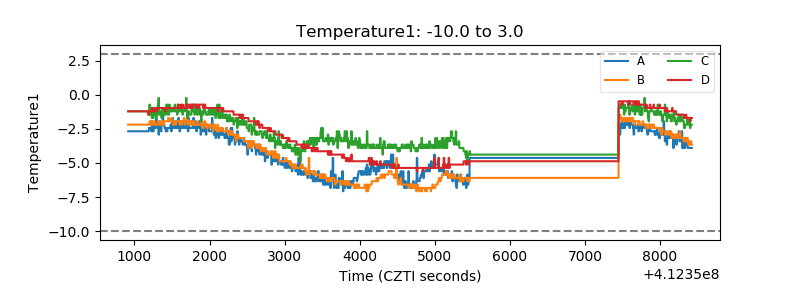 |
| Veto HV Monitor |  |
| Veto LLD | 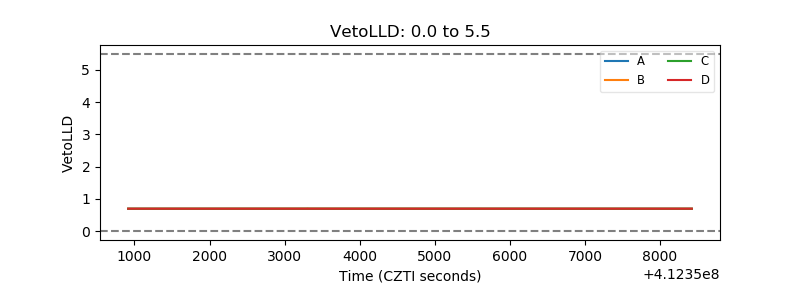 |
| Alpha Counter | 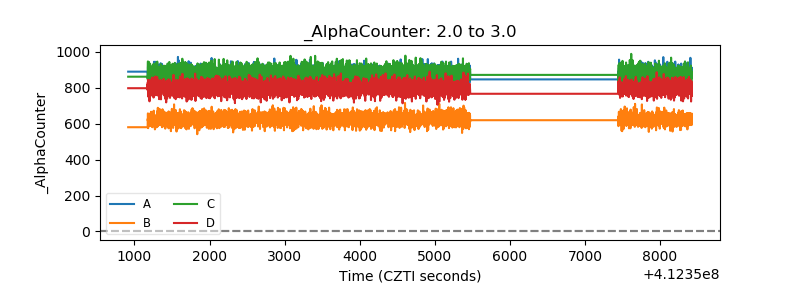 |
| _CPM_Rate | 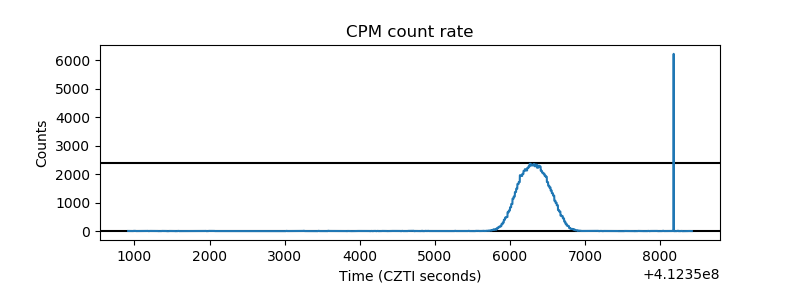 |
| CZT Counter | 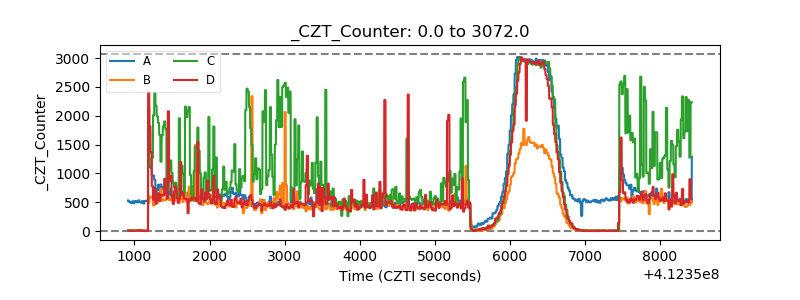 |
| +2.5 Volts monitor | 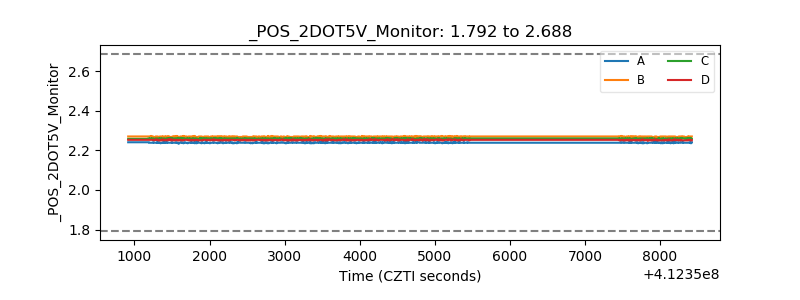 |
| +5 Volts monitor | 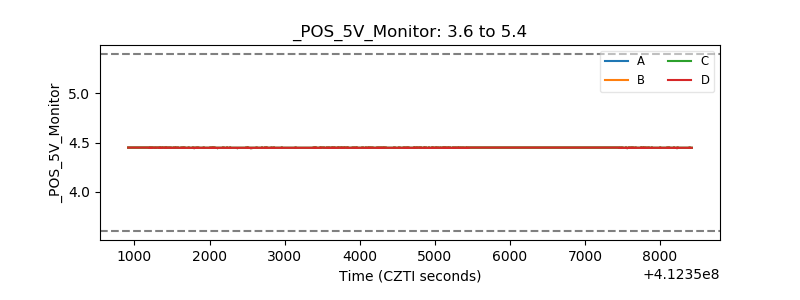 |
| _ROLL_ROT | 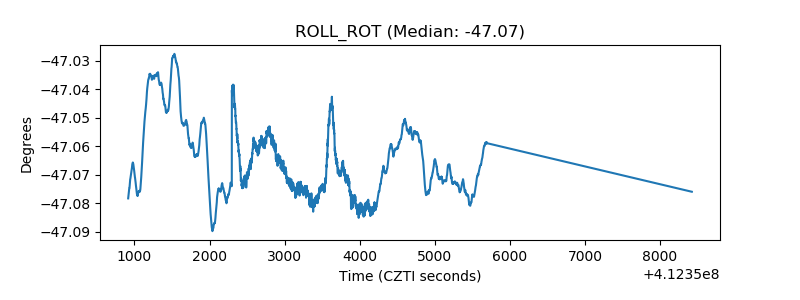 |
| _Roll_DEC |  |
| _Roll_RA | 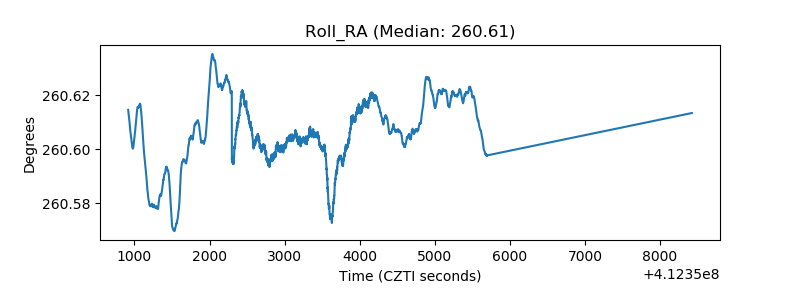 |
| Veto Counter | 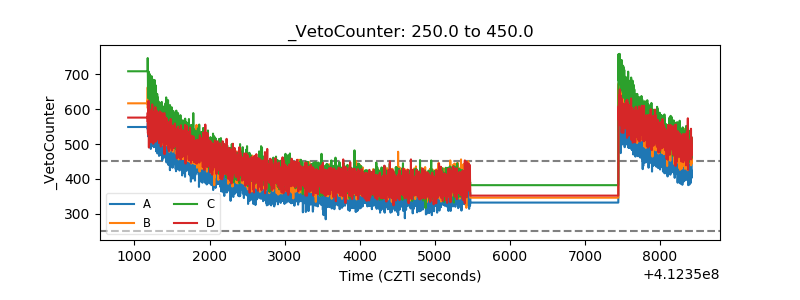 |