| Param | Original file | Final file |
|---|---|---|
| Filename | modeM0/AS1A12_018T01_9000005488_39620cztM0_level2.fits | modeM0/AS1A12_018T01_9000005488_39620cztM0_level2_quad_clean.evt |
| Size (bytes) | 411,396,480 | 96,131,520 |
| Size | 392.3 MB | 91.7 MB |
| Events in quadrant A | 2,965,591 | 672,626 |
| Events in quadrant B | 2,505,947 | 687,682 |
| Events in quadrant C | 6,267,289 | 585,853 |
| Events in quadrant D | 3,091,204 | 605,730 |
| Mode SS | |||
|---|---|---|---|
| Quadrant | BADHDUFLAG | Total packets | Discarded packets |
| A | 0 | 104 | 0 |
| B | 0 | 104 | 0 |
| C | 0 | 104 | 0 |
| D | 0 | 104 | 0 |
| Mode M0 | |||
|---|---|---|---|
| Quadrant | BADHDUFLAG | Total packets | Discarded packets |
| A | 0 | 12086 | 2 |
| B | 0 | 10675 | 1 |
| C | 0 | 22302 | 1 |
| D | 0 | 12607 | 1 |
| Mode M9 | |||
|---|---|---|---|
| Quadrant | BADHDUFLAG | Total packets | Discarded packets |
| A | 0 | 26 | 0 |
| B | 0 | 26 | 0 |
| C | 0 | 26 | 0 |
| D | 0 | 27 | 0 |
| Quadrant | Total seconds | Saturated seconds | Saturation percentage |
|---|---|---|---|
| A | 5128 | 15 | 0.292512% |
| B | 5128 | 12 | 0.234009% |
| C | 5128 | 765 | 14.918097% |
| D | 5128 | 93 | 1.813573% |
Noise dominated data is calculated using 1-second bins in cleaned event files. If a bin has >2000 counts, and if more than 50% of those come from <1% of pixels, then it is considered to be noise-dominated and hence unusable.
| Quadrant | # 1 sec bins | Bins with >0 counts | Bins with >2000 counts | High rate bins dominated by noise | Noise dominated (total time) | Noise dominated (detector-on time) | Marked lightcurve |
|---|---|---|---|---|---|---|---|
| A | 7190 | 5129 | 8 | 8 | 0.11% | 0.16% | 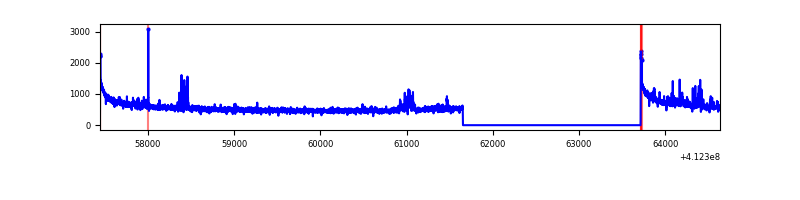 |
| B | 7190 | 5129 | 4 | 4 | 0.06% | 0.08% | 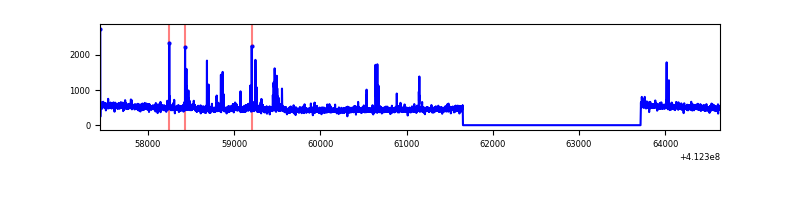 |
| C | 7190 | 5129 | 688 | 688 | 9.57% | 13.41% | 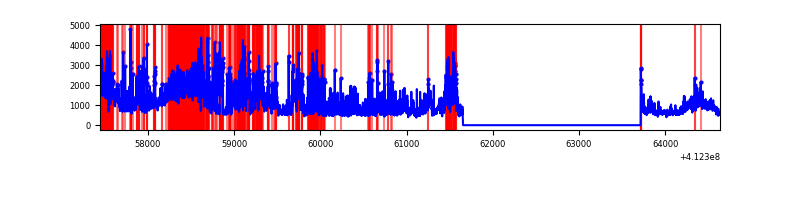 |
| D | 7190 | 5129 | 84 | 84 | 1.17% | 1.64% | 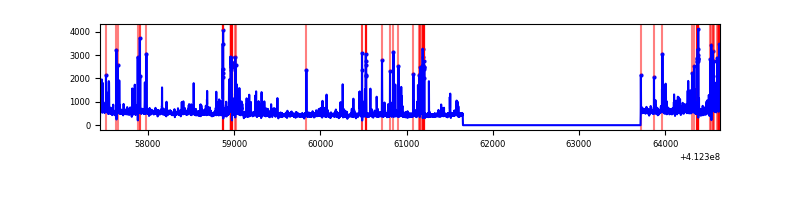 |
Top three noisy pixels from each quadrant. If the there are fewer than three noisy pixels in the level2.evt file, extra rows are filled as -1
| Pixel properties | Quadrant properties | ||||||
|---|---|---|---|---|---|---|---|
| Quadrant | DetID | PixID | Counts | Sigma | Mean | Median | Sigma |
| A | 10 | 83 | 456788 | 3717.89 | 607 | 597 | 122.7 |
| A | 15 | 222 | 94087 | 761.93 | 607 | 597 | 122.7 |
| A | 0 | 8 | 40168 | 322.5 | 607 | 597 | 122.7 |
| B | 5 | 255 | 62926 | 547.79 | 606 | 590 | 113.8 |
| B | 5 | 172 | 24492 | 210.04 | 606 | 590 | 113.8 |
| B | 15 | 35 | 22899 | 196.04 | 606 | 590 | 113.8 |
| C | 9 | 187 | 2583404 | 19531.32 | 577 | 582 | 132.2 |
| C | 15 | 208 | 1154943 | 8729.29 | 577 | 582 | 132.2 |
| C | 15 | 214 | 207269 | 1562.97 | 577 | 582 | 132.2 |
| D | 13 | 249 | 385076 | 2654.09 | 597 | 582 | 144.9 |
| D | 2 | 249 | 132304 | 909.25 | 597 | 582 | 144.9 |
| D | 12 | 227 | 117411 | 806.45 | 597 | 582 | 144.9 |
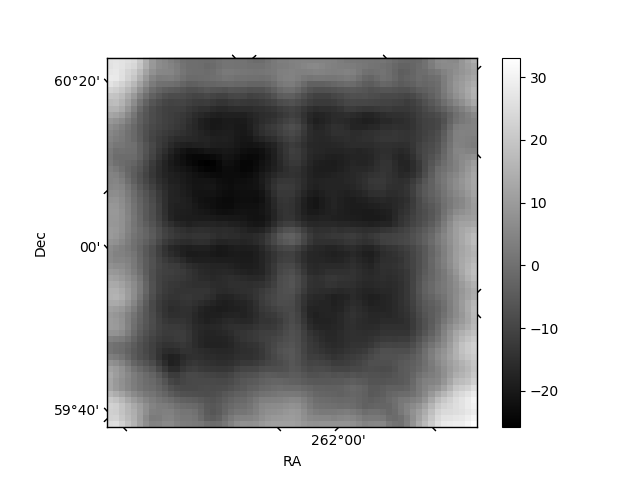
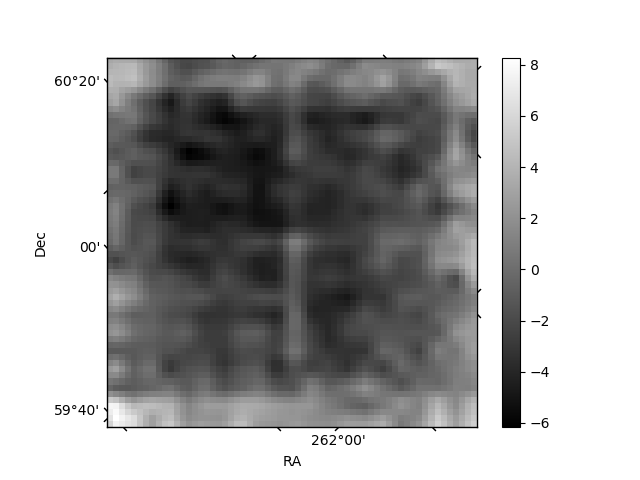
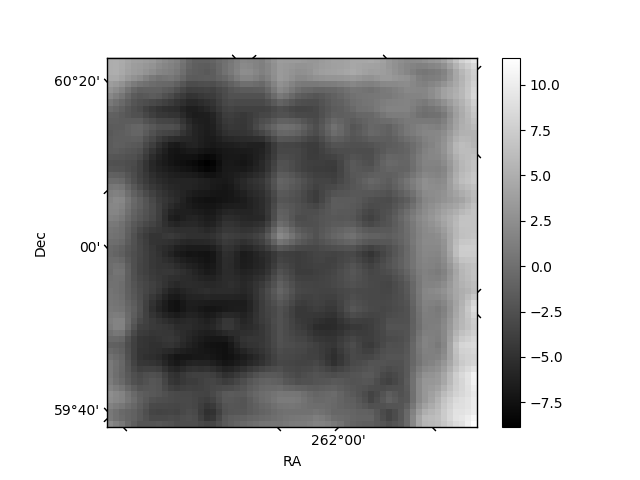
Histogram calculated using DETX and DETY for each event in the final _common_clean file
| Quadrant A | 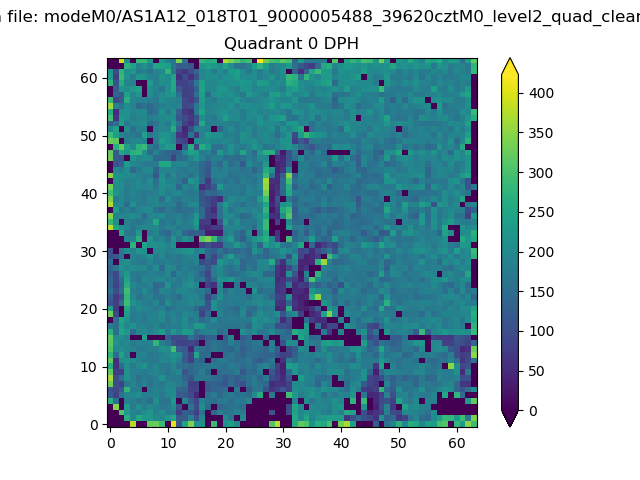 |
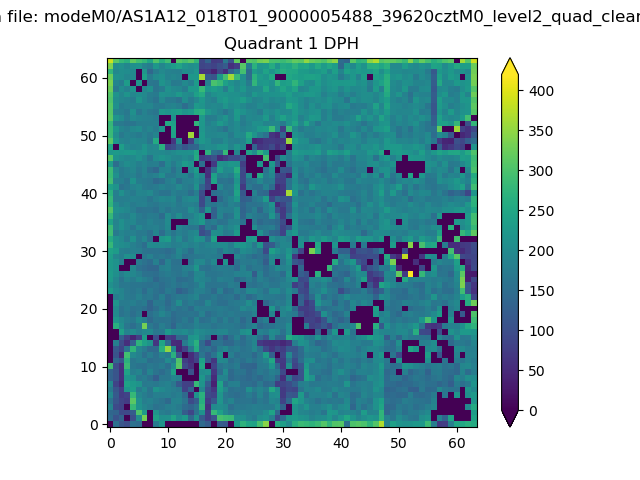 |
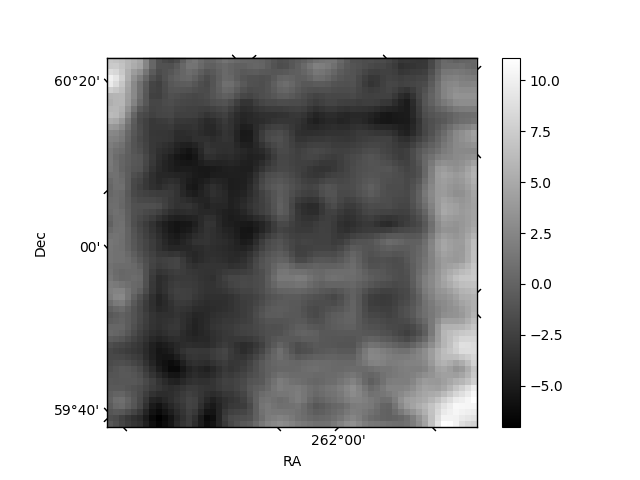
Quadrant B |
|---|---|---|---|
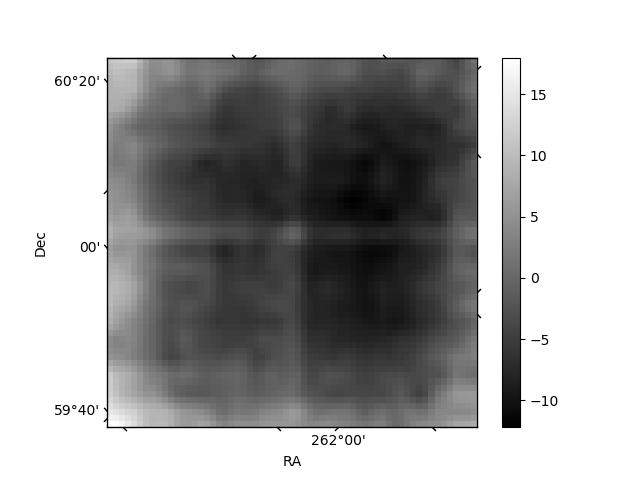
| Quadrant D | 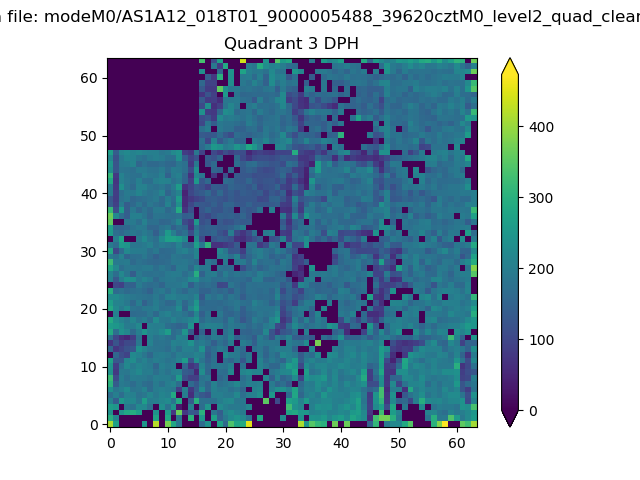 |
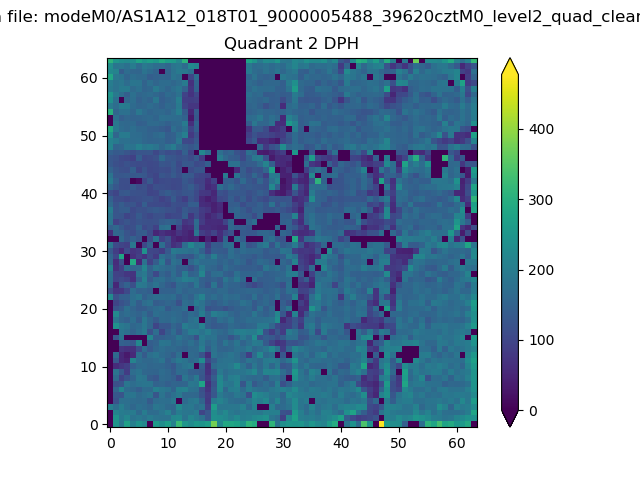 |
Quadrant C |
| Plot type | Count rate plots | Images |
|---|---|---|
| Comparison with Poisson distribution Blue bars denote a histogram of data divided into 1 sec bins. Red curve is a Poisson curve with rate = median count rate of data. |
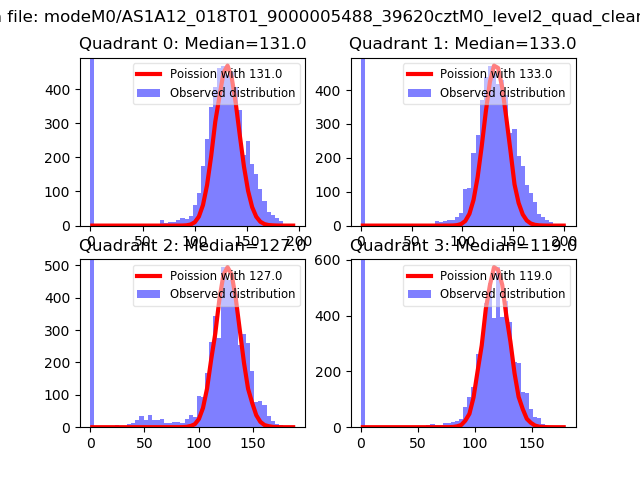 |
 |
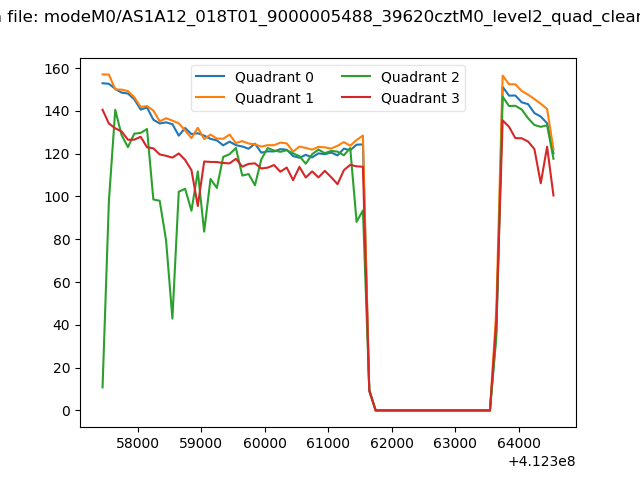
| Quadrant-wise count rates Data is divided into 100 sec bins |
 |
|
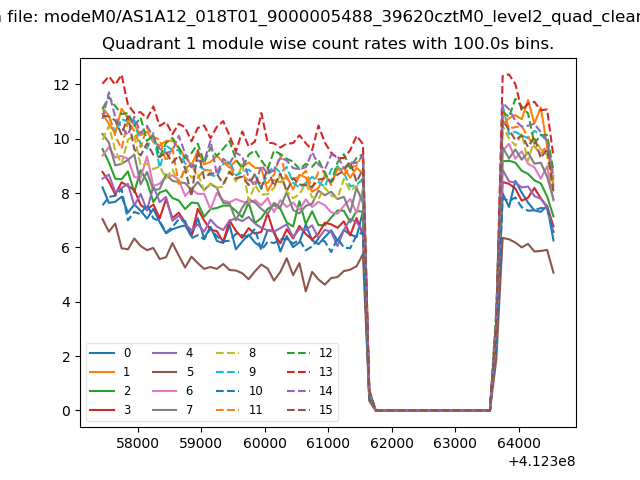
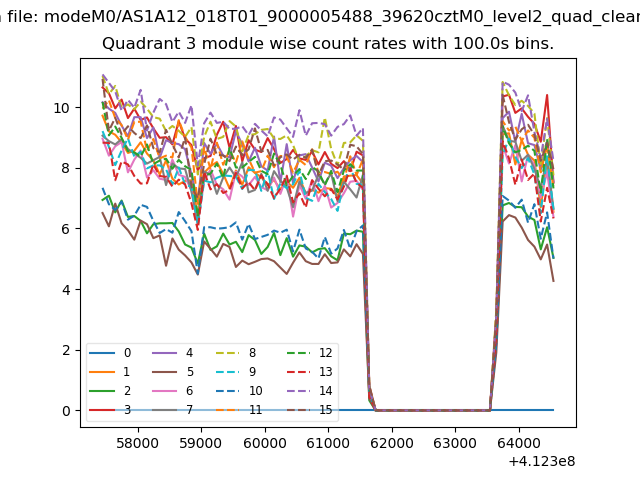
| Module-wise count rates for Quadrant A Data is divided into 100 sec bins |
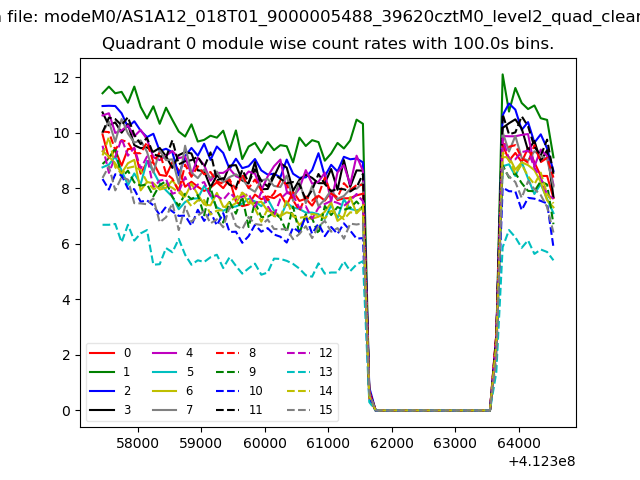 |
 |
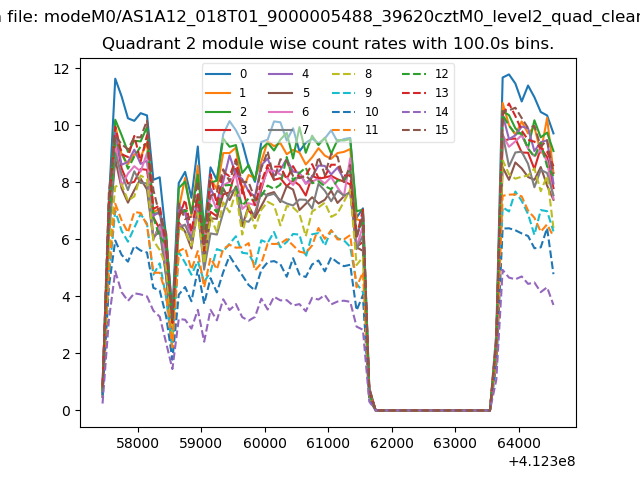
| Module-wise count rates for Quadrant B Data is divided into 100 sec bins |
 |
 |
| Module-wise count rates for Quadrant C Data is divided into 100 sec bins |
 |
 |
| Module-wise count rates for Quadrant D Data is divided into 100 sec bins |
 |
 |
| Parameter | Plot |
|---|---|
| CZT HV Monitor | 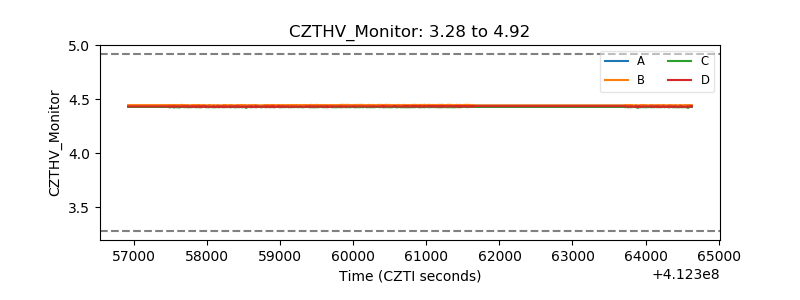 |
| D_VDD | 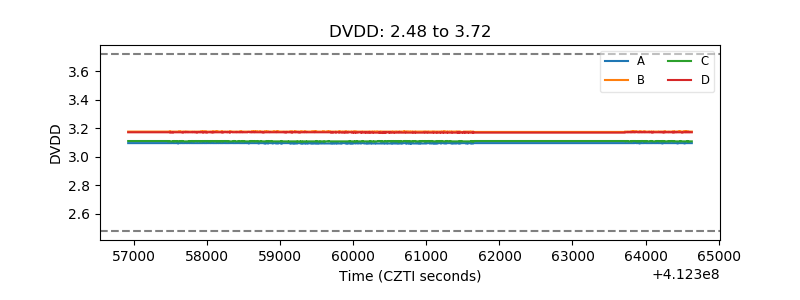 |
| Temperature 1 | 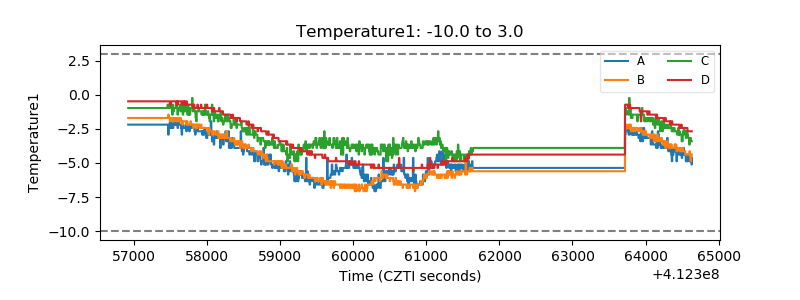 |
| Veto HV Monitor | 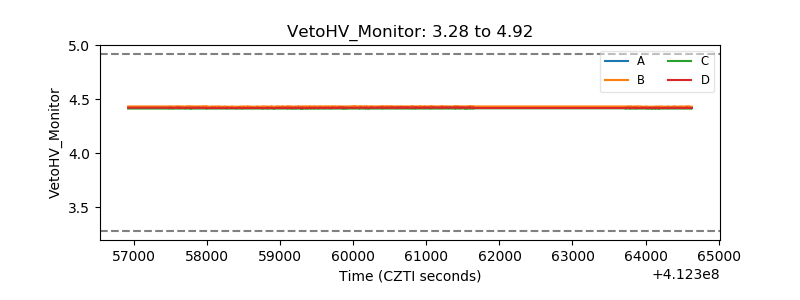 |
| Veto LLD | 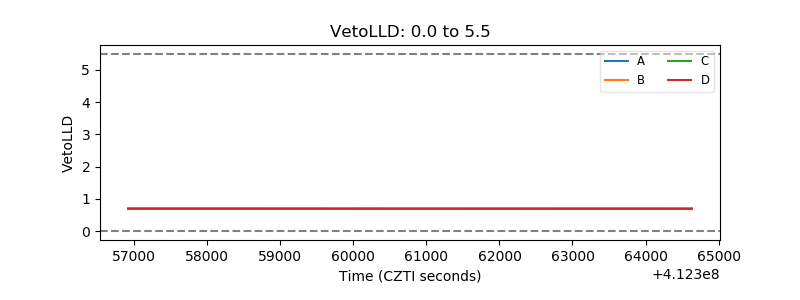 |
| Alpha Counter | 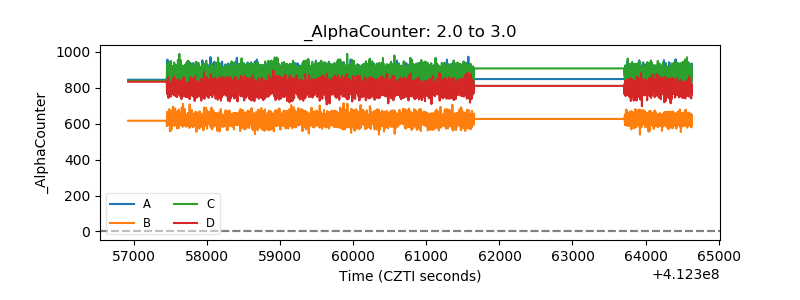 |
| _CPM_Rate | 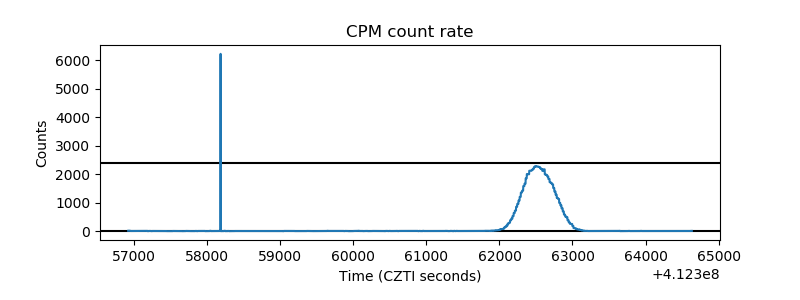 |
| CZT Counter | 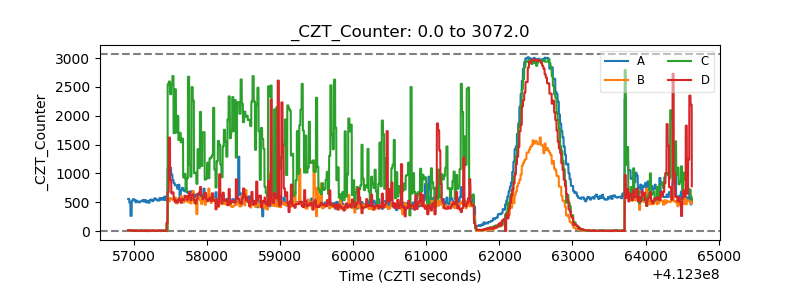 |
| +2.5 Volts monitor | 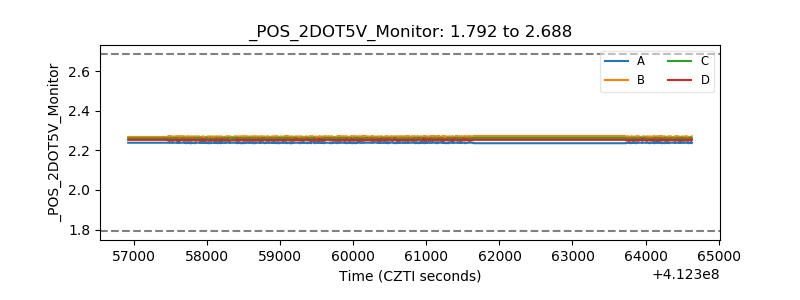 |
| +5 Volts monitor | 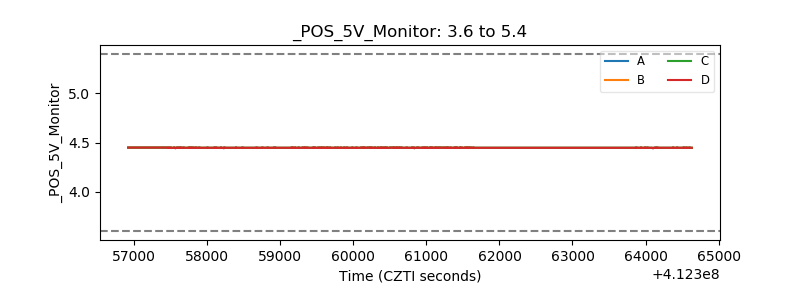 |
| _ROLL_ROT | 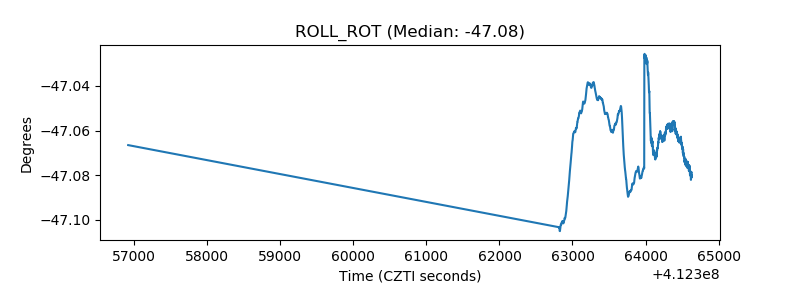 |
| _Roll_DEC | 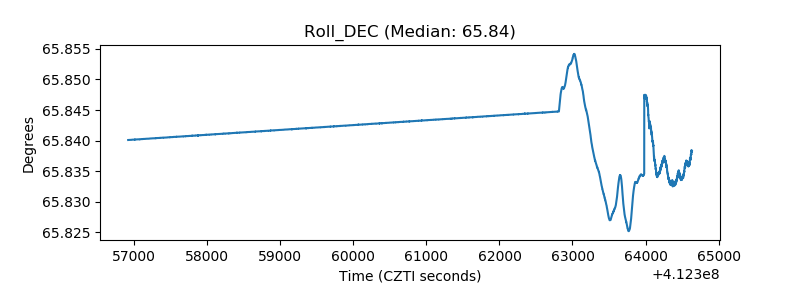 |
| _Roll_RA | 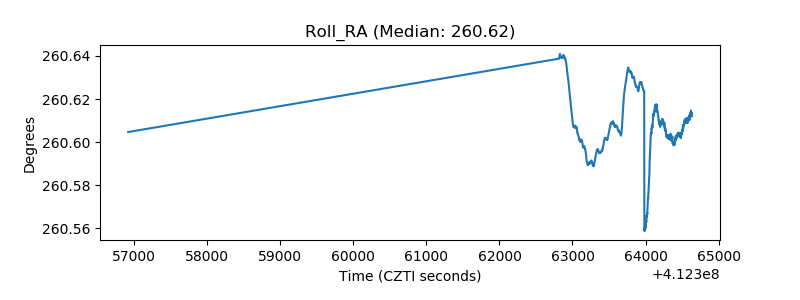 |
| Veto Counter | 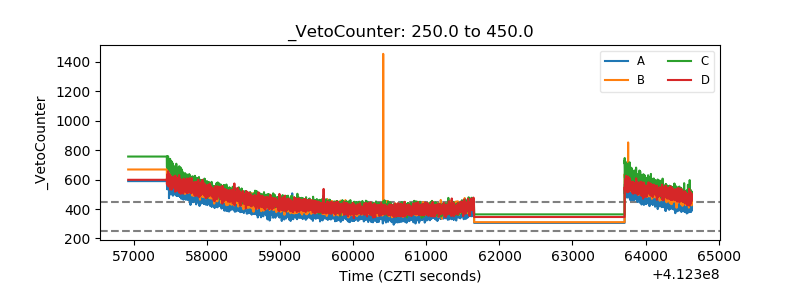 |