| Param | Original file | Final file |
|---|---|---|
| Filename | modeM0/AS1A12_018T01_9000005488_39622cztM0_level2.fits | modeM0/AS1A12_018T01_9000005488_39622cztM0_level2_quad_clean.evt |
| Size (bytes) | 403,436,160 | 86,414,400 |
| Size | 384.7 MB | 82.4 MB |
| Events in quadrant A | 2,703,744 | 600,157 |
| Events in quadrant B | 2,547,907 | 609,494 |
| Events in quadrant C | 4,593,808 | 565,037 |
| Events in quadrant D | 4,701,612 | 493,005 |
| Mode SS | |||
|---|---|---|---|
| Quadrant | BADHDUFLAG | Total packets | Discarded packets |
| A | 0 | 102 | 0 |
| B | 0 | 102 | 0 |
| C | 0 | 102 | 0 |
| D | 0 | 102 | 0 |
| Mode M0 | |||
|---|---|---|---|
| Quadrant | BADHDUFLAG | Total packets | Discarded packets |
| A | 0 | 11097 | 3 |
| B | 0 | 11053 | 2 |
| C | 0 | 17124 | 2 |
| D | 0 | 17502 | 2 |
| Mode M9 | |||
|---|---|---|---|
| Quadrant | BADHDUFLAG | Total packets | Discarded packets |
| A | 0 | 32 | 0 |
| B | 0 | 32 | 0 |
| C | 0 | 32 | 0 |
| D | 0 | 33 | 0 |
| Quadrant | Total seconds | Saturated seconds | Saturation percentage |
|---|---|---|---|
| A | 4975 | 21 | 0.422111% |
| B | 4975 | 84 | 1.688442% |
| C | 4975 | 374 | 7.517588% |
| D | 4975 | 647 | 13.005025% |
Noise dominated data is calculated using 1-second bins in cleaned event files. If a bin has >2000 counts, and if more than 50% of those come from <1% of pixels, then it is considered to be noise-dominated and hence unusable.
| Quadrant | # 1 sec bins | Bins with >0 counts | Bins with >2000 counts | High rate bins dominated by noise | Noise dominated (total time) | Noise dominated (detector-on time) | Marked lightcurve |
|---|---|---|---|---|---|---|---|
| A | 7098 | 4976 | 8 | 8 | 0.11% | 0.16% | 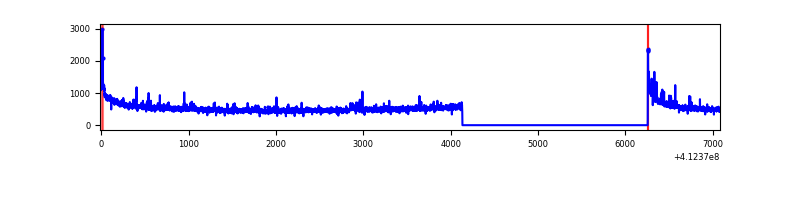 |
| B | 7098 | 4976 | 46 | 46 | 0.65% | 0.92% | 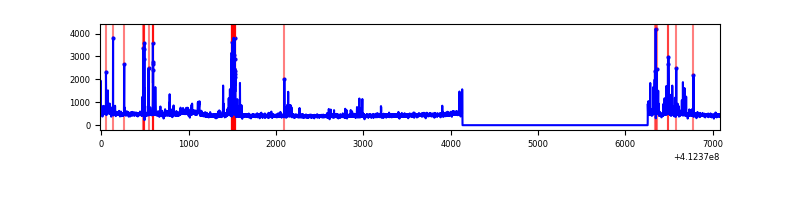 |
| C | 7098 | 4976 | 362 | 362 | 5.10% | 7.27% | 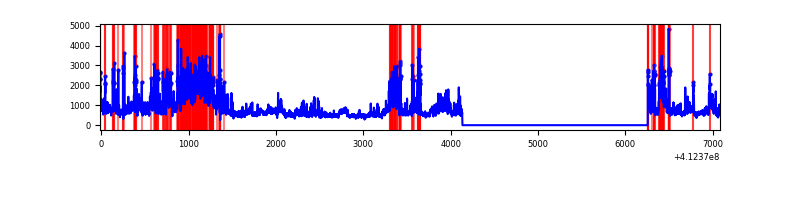 |
| D | 7098 | 4976 | 598 | 598 | 8.42% | 12.02% | 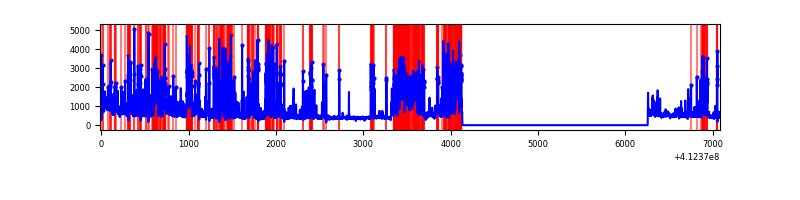 |
Top three noisy pixels from each quadrant. If the there are fewer than three noisy pixels in the level2.evt file, extra rows are filled as -1
| Pixel properties | Quadrant properties | ||||||
|---|---|---|---|---|---|---|---|
| Quadrant | DetID | PixID | Counts | Sigma | Mean | Median | Sigma |
| A | 10 | 83 | 425426 | 3846.65 | 551 | 540 | 110.5 |
| A | 15 | 222 | 123522 | 1113.4 | 551 | 540 | 110.5 |
| A | 13 | 254 | 8330 | 70.53 | 551 | 540 | 110.5 |
| B | 5 | 172 | 282990 | 2707.56 | 548 | 534 | 104.3 |
| B | 5 | 255 | 111503 | 1063.72 | 548 | 534 | 104.3 |
| B | 12 | 111 | 12714 | 116.75 | 548 | 534 | 104.3 |
| C | 9 | 187 | 1492494 | 12004.08 | 535 | 539 | 124.3 |
| C | 15 | 208 | 768985 | 6182.82 | 535 | 539 | 124.3 |
| C | 15 | 214 | 203862 | 1635.91 | 535 | 539 | 124.3 |
| D | 13 | 249 | 1374816 | 11127.58 | 509 | 495 | 123.5 |
| D | 12 | 227 | 748847 | 6059.24 | 509 | 495 | 123.5 |
| D | 2 | 249 | 150590 | 1215.29 | 509 | 495 | 123.5 |
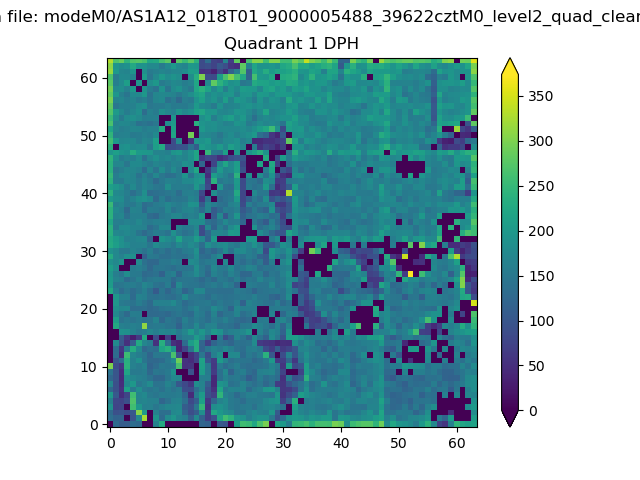
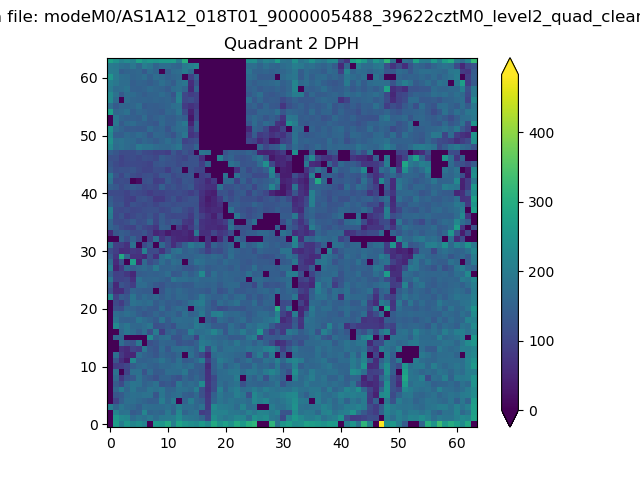
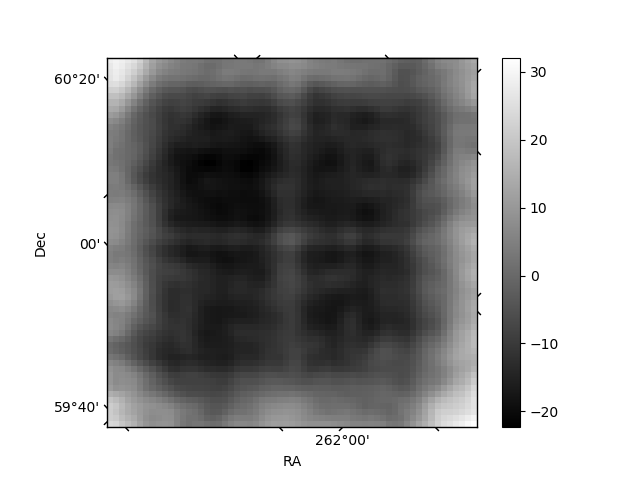
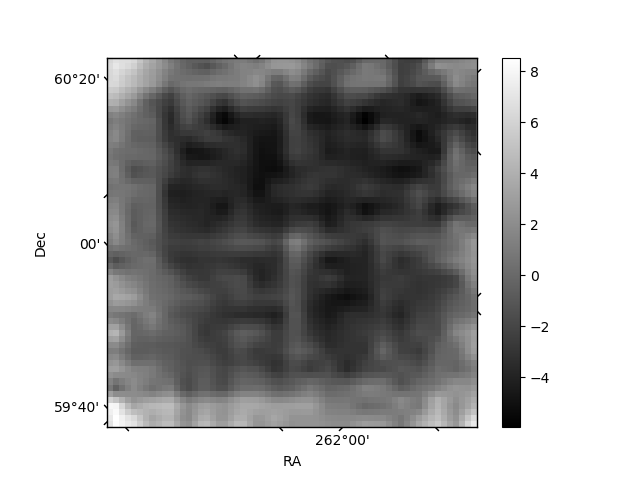
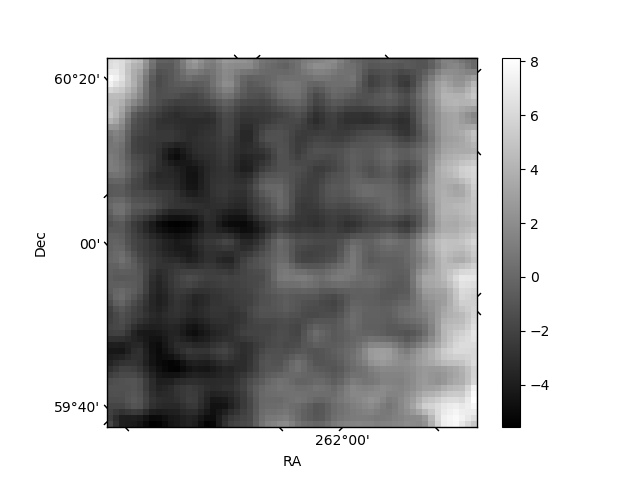
Histogram calculated using DETX and DETY for each event in the final _common_clean file
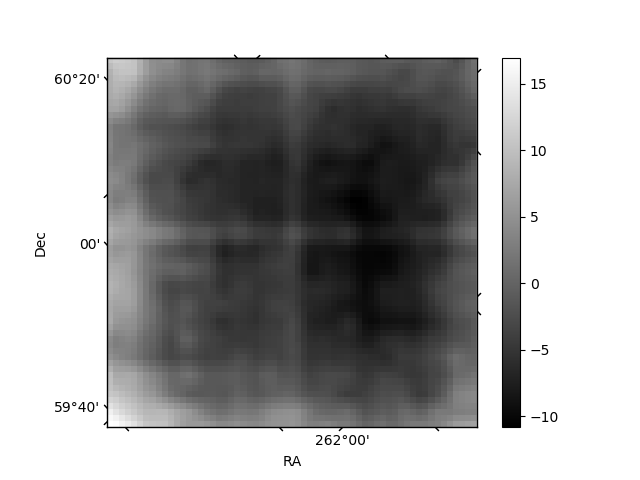
| Quadrant A |  |
 |
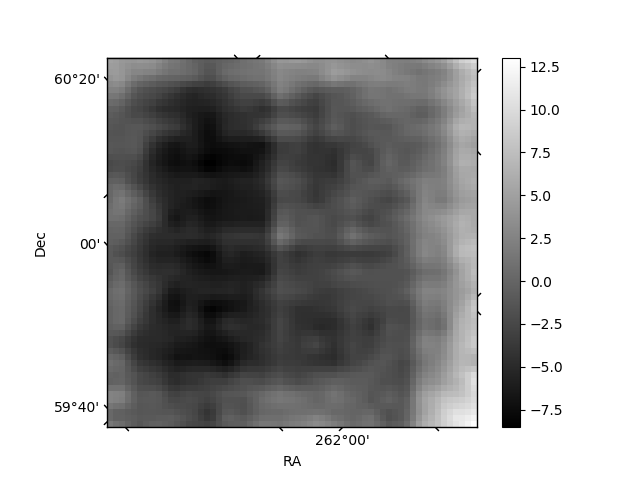
Quadrant B |
|---|---|---|---|
| Quadrant D | 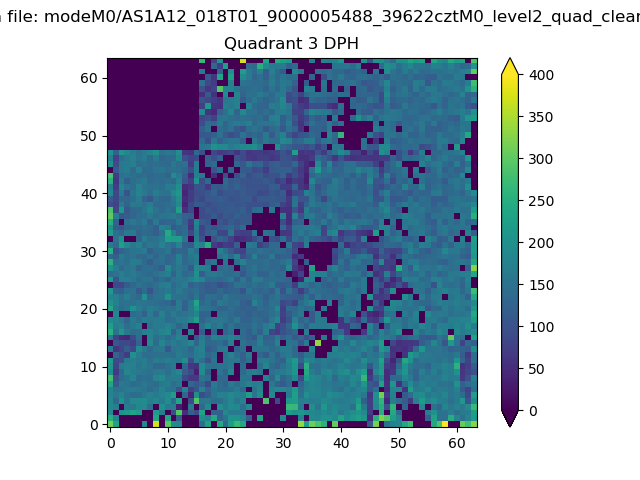 |
 |
Quadrant C |
| Plot type | Count rate plots | Images |
|---|---|---|
| Comparison with Poisson distribution Blue bars denote a histogram of data divided into 1 sec bins. Red curve is a Poisson curve with rate = median count rate of data. |
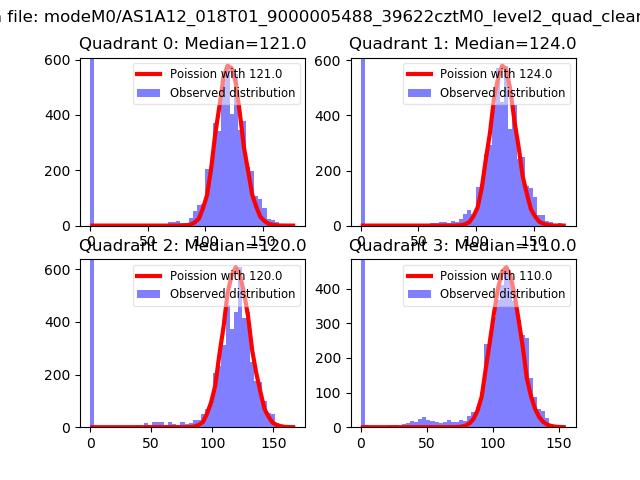 |
 |
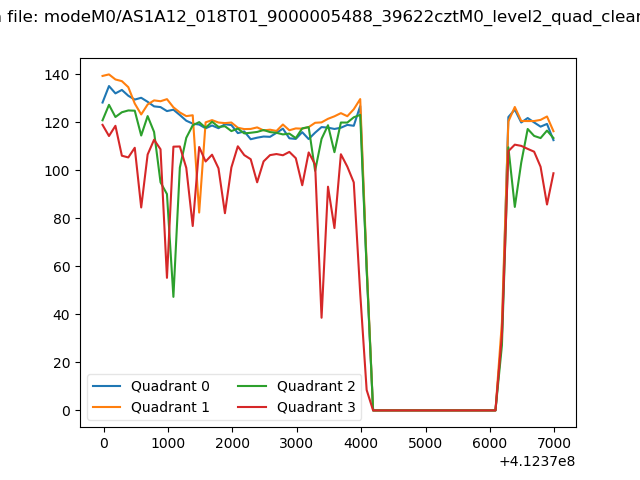
| Quadrant-wise count rates Data is divided into 100 sec bins |
 |
|
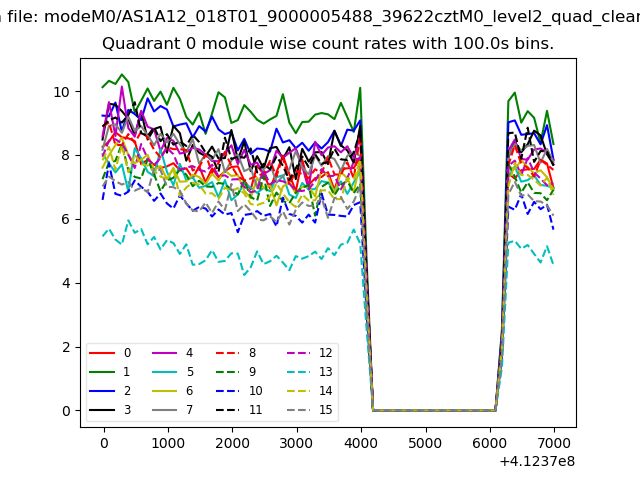
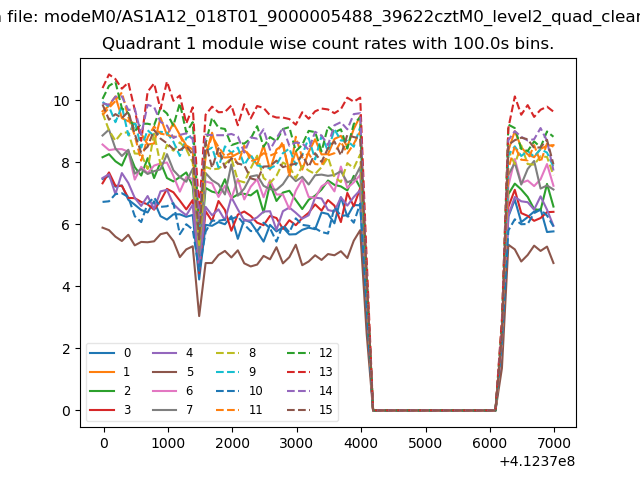
| Module-wise count rates for Quadrant A Data is divided into 100 sec bins |
 |
 |
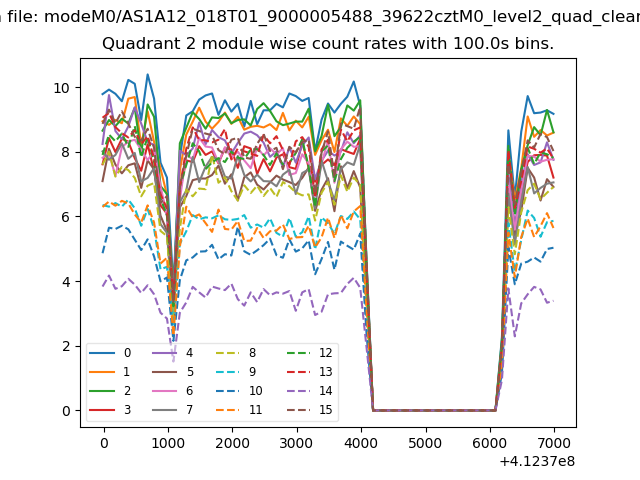
| Module-wise count rates for Quadrant B Data is divided into 100 sec bins |
 |
 |
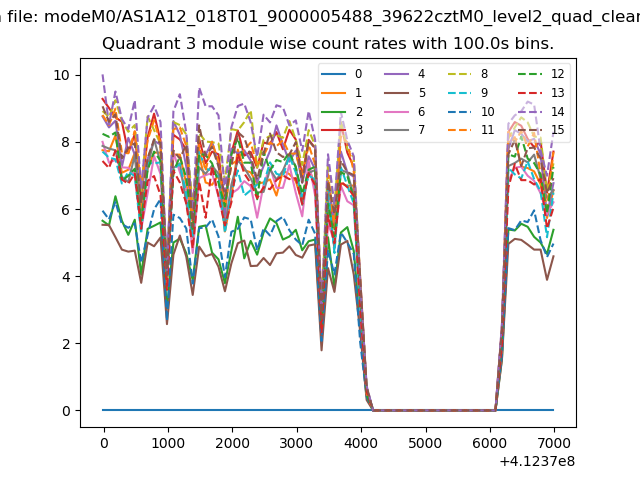
| Module-wise count rates for Quadrant C Data is divided into 100 sec bins |
 |
 |
| Module-wise count rates for Quadrant D Data is divided into 100 sec bins |
 |
 |
| Parameter | Plot |
|---|---|
| CZT HV Monitor |  |
| D_VDD | 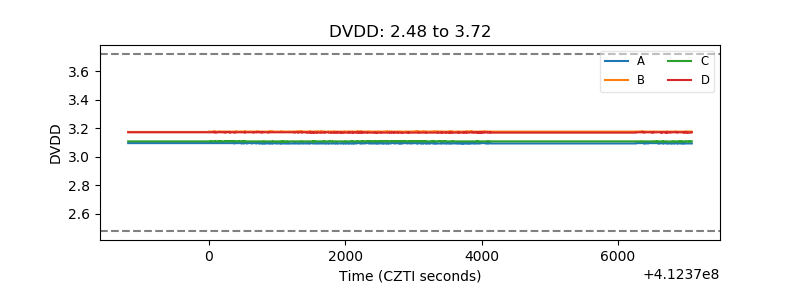 |
| Temperature 1 | 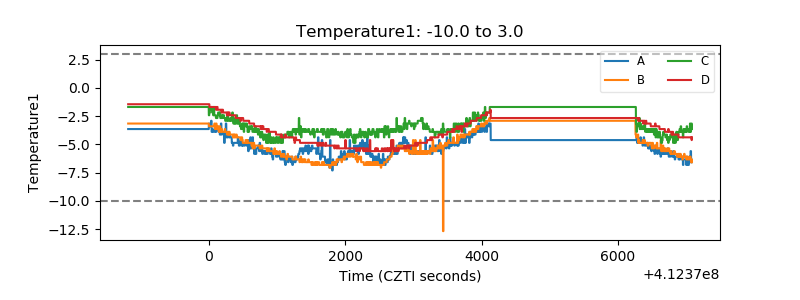 |
| Veto HV Monitor | 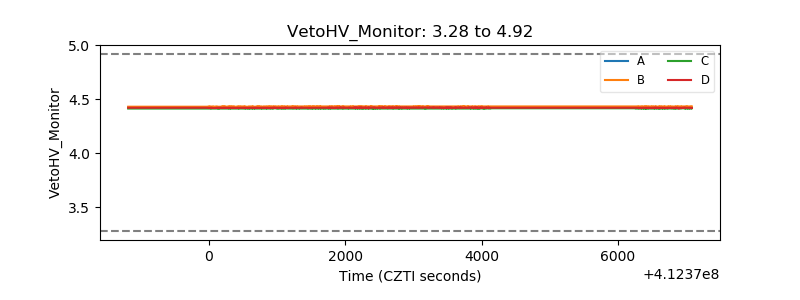 |
| Veto LLD | 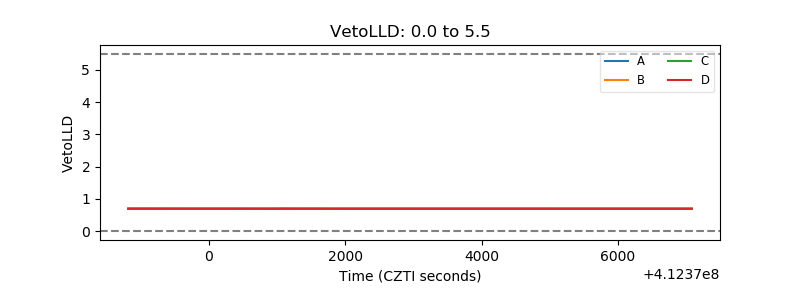 |
| Alpha Counter | 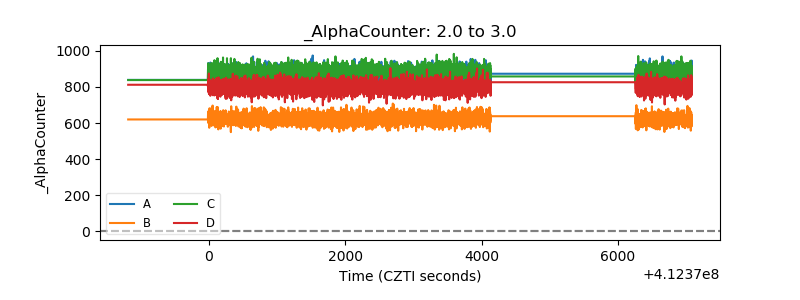 |
| _CPM_Rate | 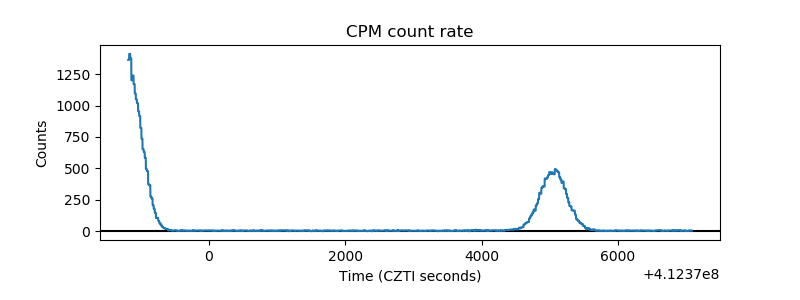 |
| CZT Counter | 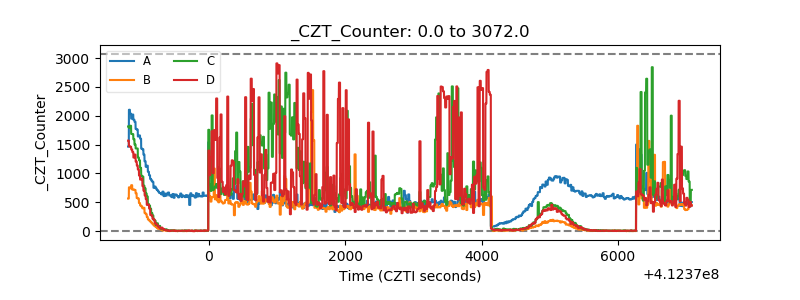 |
| +2.5 Volts monitor | 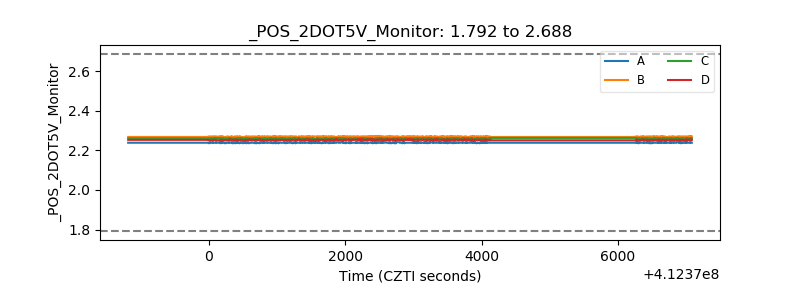 |
| +5 Volts monitor | 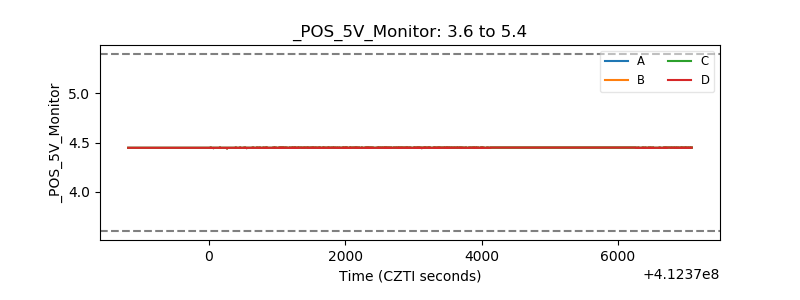 |
| _ROLL_ROT | 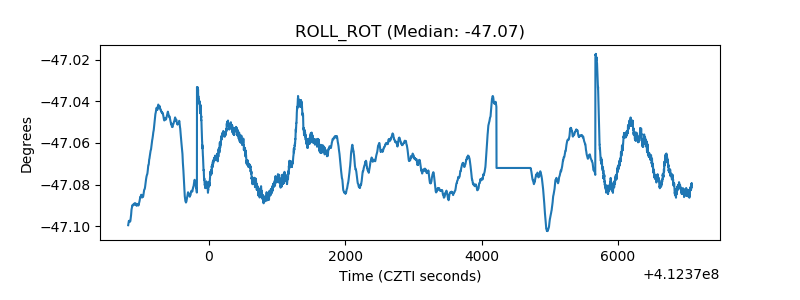 |
| _Roll_DEC | 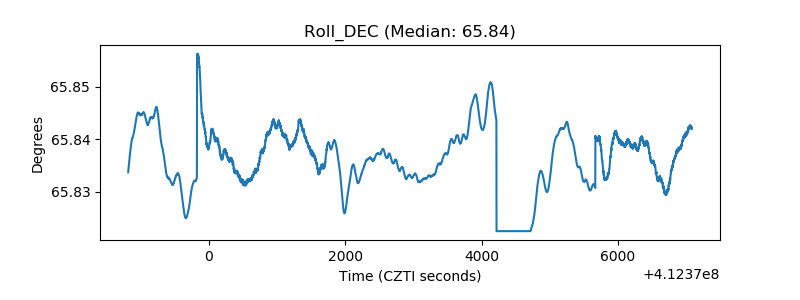 |
| _Roll_RA | 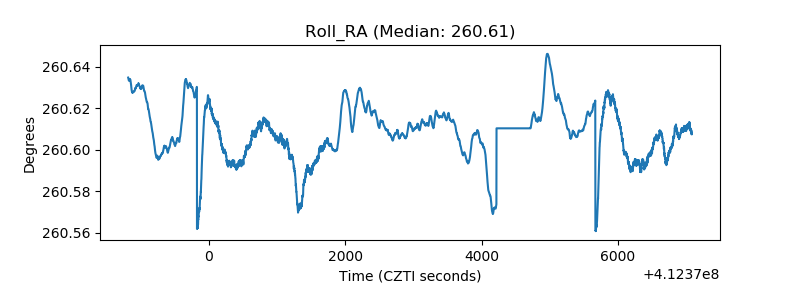 |
| Veto Counter | 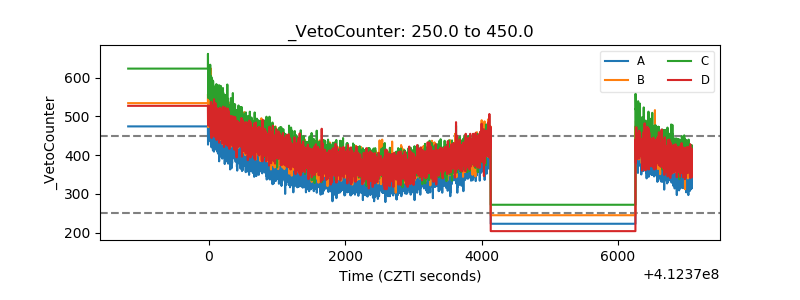 |