| Param | Original file | Final file |
|---|---|---|
| Filename | modeM0/AS1A12_018T01_9000005488_39623cztM0_level2.fits | modeM0/AS1A12_018T01_9000005488_39623cztM0_level2_quad_clean.evt |
| Size (bytes) | 386,985,600 | 83,030,400 |
| Size | 369.1 MB | 79.2 MB |
| Events in quadrant A | 2,596,874 | 572,272 |
| Events in quadrant B | 2,284,019 | 585,264 |
| Events in quadrant C | 5,347,000 | 508,438 |
| Events in quadrant D | 3,706,771 | 496,411 |
| Mode SS | |||
|---|---|---|---|
| Quadrant | BADHDUFLAG | Total packets | Discarded packets |
| A | 0 | 102 | 0 |
| B | 0 | 102 | 0 |
| C | 0 | 102 | 0 |
| D | 0 | 102 | 0 |
| Mode M0 | |||
|---|---|---|---|
| Quadrant | BADHDUFLAG | Total packets | Discarded packets |
| A | 0 | 10978 | 3 |
| B | 0 | 10516 | 2 |
| C | 0 | 19395 | 2 |
| D | 0 | 14610 | 2 |
| Mode M9 | |||
|---|---|---|---|
| Quadrant | BADHDUFLAG | Total packets | Discarded packets |
| A | 0 | 34 | 0 |
| B | 0 | 34 | 0 |
| C | 0 | 34 | 0 |
| D | 0 | 35 | 0 |
| Quadrant | Total seconds | Saturated seconds | Saturation percentage |
|---|---|---|---|
| A | 5016 | 13 | 0.259171% |
| B | 5016 | 25 | 0.498405% |
| C | 5016 | 665 | 13.257576% |
| D | 5016 | 347 | 6.917863% |
Noise dominated data is calculated using 1-second bins in cleaned event files. If a bin has >2000 counts, and if more than 50% of those come from <1% of pixels, then it is considered to be noise-dominated and hence unusable.
| Quadrant | # 1 sec bins | Bins with >0 counts | Bins with >2000 counts | High rate bins dominated by noise | Noise dominated (total time) | Noise dominated (detector-on time) | Marked lightcurve |
|---|---|---|---|---|---|---|---|
| A | 6989 | 5017 | 5 | 5 | 0.07% | 0.10% | 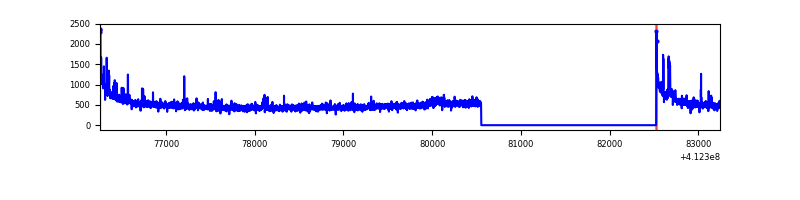 |
| B | 6989 | 5017 | 9 | 9 | 0.13% | 0.18% | 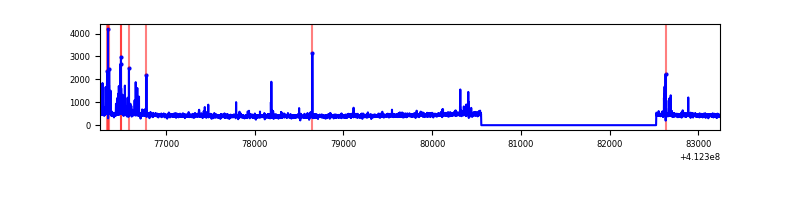 |
| C | 6989 | 5017 | 618 | 618 | 8.84% | 12.32% | 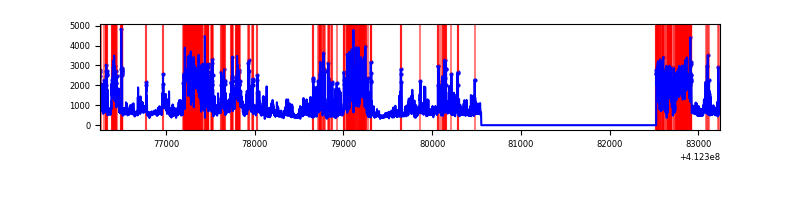 |
| D | 6989 | 5017 | 298 | 298 | 4.26% | 5.94% |  |
Top three noisy pixels from each quadrant. If the there are fewer than three noisy pixels in the level2.evt file, extra rows are filled as -1
| Pixel properties | Quadrant properties | ||||||
|---|---|---|---|---|---|---|---|
| Quadrant | DetID | PixID | Counts | Sigma | Mean | Median | Sigma |
| A | 10 | 83 | 413910 | 3784.5 | 537 | 525 | 109.2 |
| A | 15 | 222 | 91656 | 834.3 | 537 | 525 | 109.2 |
| A | 13 | 254 | 8670 | 74.57 | 537 | 525 | 109.2 |
| B | 5 | 255 | 87347 | 839.24 | 537 | 522 | 103.5 |
| B | 5 | 172 | 82767 | 794.97 | 537 | 522 | 103.5 |
| B | 12 | 111 | 12720 | 117.9 | 537 | 522 | 103.5 |
| C | 9 | 187 | 1985097 | 16893.71 | 504 | 508 | 117.5 |
| C | 15 | 208 | 1146665 | 9756.6 | 504 | 508 | 117.5 |
| C | 15 | 214 | 201203 | 1708.41 | 504 | 508 | 117.5 |
| D | 13 | 249 | 684376 | 5518.48 | 508 | 494 | 123.9 |
| D | 12 | 227 | 562943 | 4538.6 | 508 | 494 | 123.9 |
| D | 2 | 153 | 161306 | 1297.65 | 508 | 494 | 123.9 |
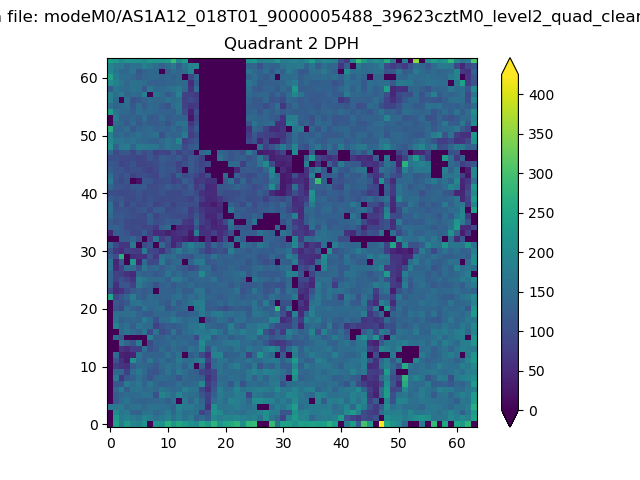
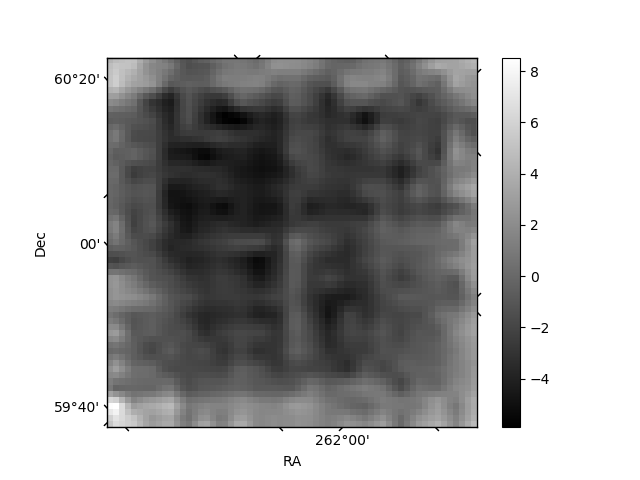
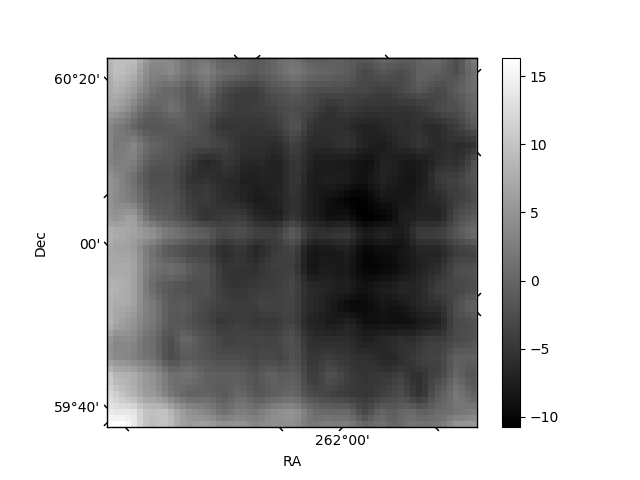
Histogram calculated using DETX and DETY for each event in the final _common_clean file
| Quadrant A |  |
 |
Quadrant B |
|---|---|---|---|
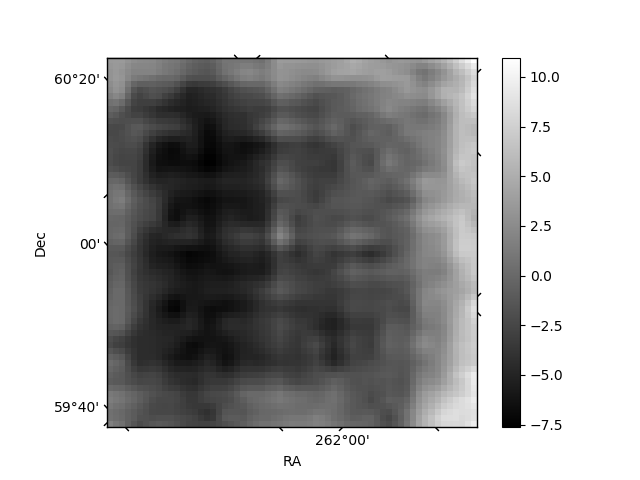
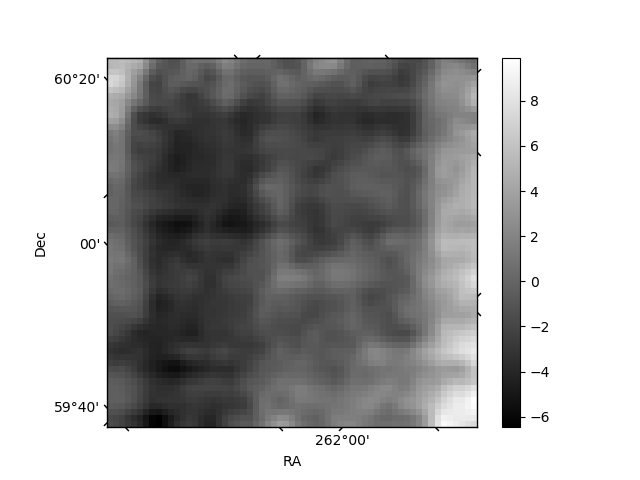
| Quadrant D | 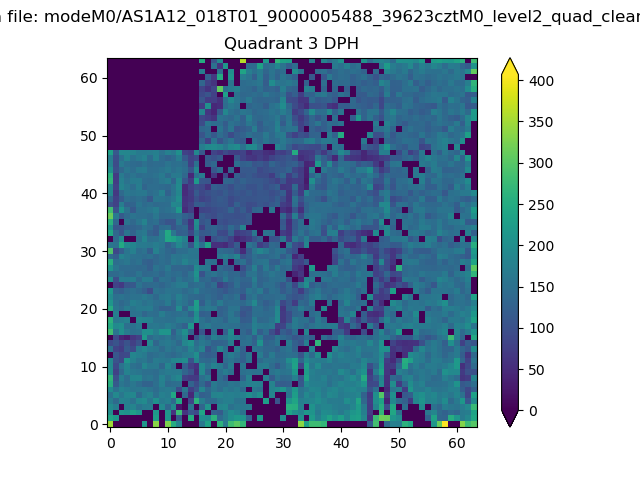 |
 |
Quadrant C |
| Plot type | Count rate plots | Images |
|---|---|---|
| Comparison with Poisson distribution Blue bars denote a histogram of data divided into 1 sec bins. Red curve is a Poisson curve with rate = median count rate of data. |
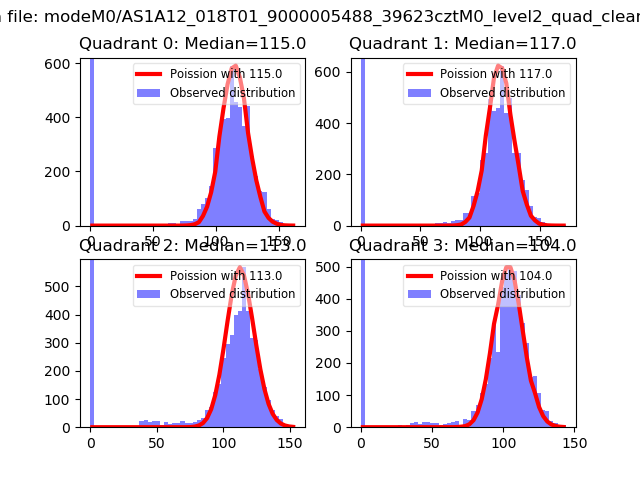 |
 |
| Quadrant-wise count rates Data is divided into 100 sec bins |
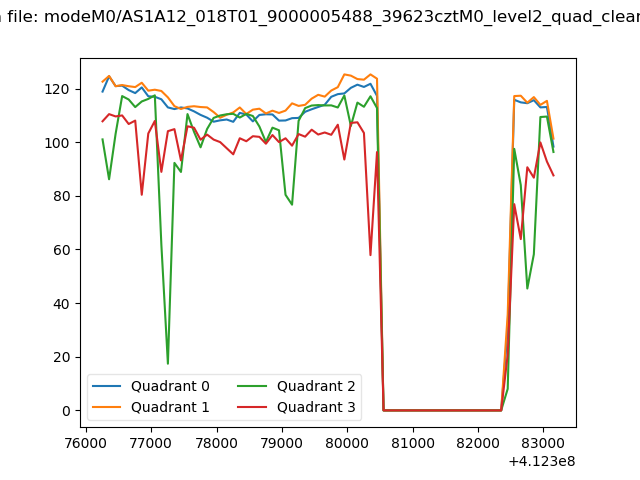 |
|
| Module-wise count rates for Quadrant A Data is divided into 100 sec bins |
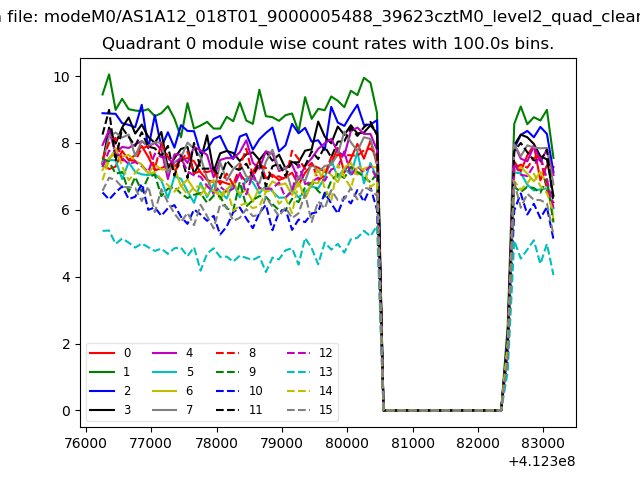 |
 |
| Module-wise count rates for Quadrant B Data is divided into 100 sec bins |
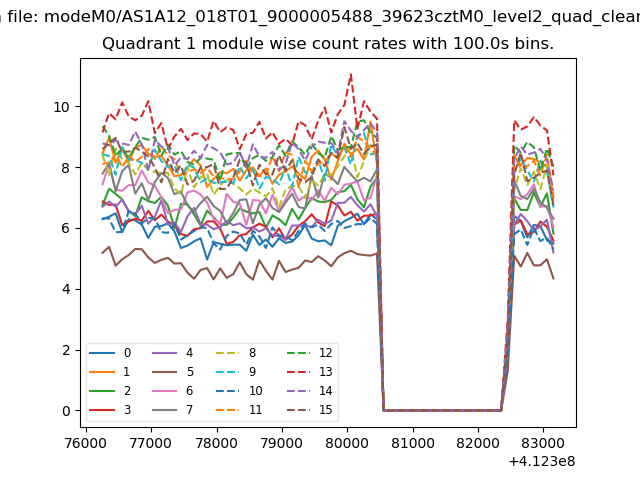 |
 |
| Module-wise count rates for Quadrant C Data is divided into 100 sec bins |
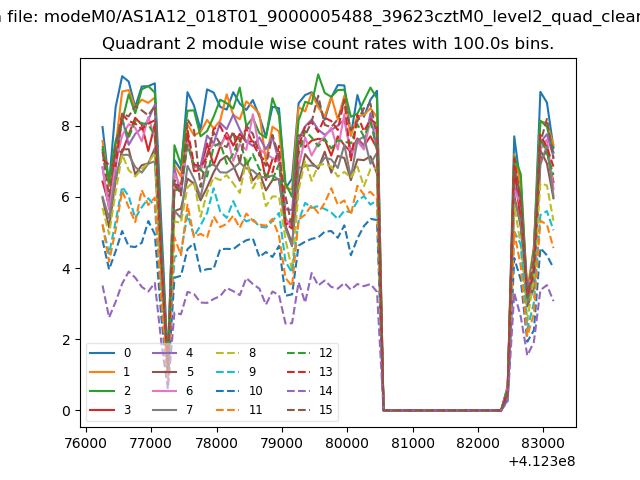 |
 |
| Module-wise count rates for Quadrant D Data is divided into 100 sec bins |
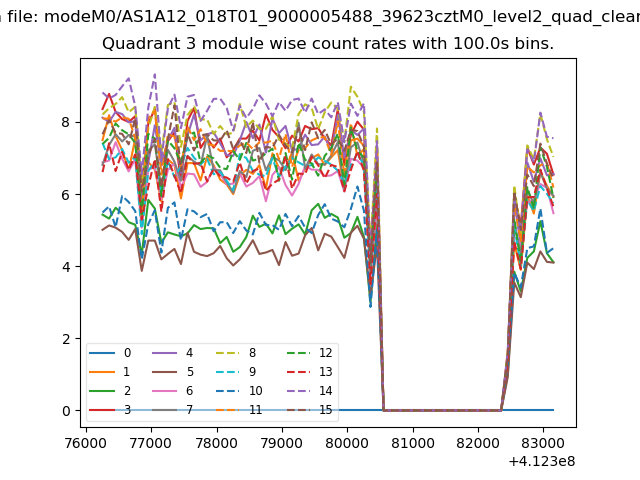 |
 |
| Parameter | Plot |
|---|---|
| CZT HV Monitor | 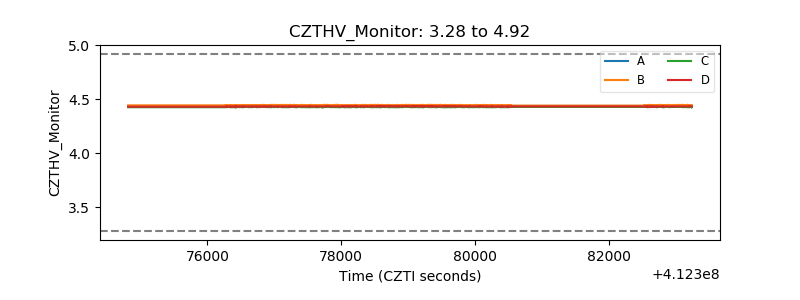 |
| D_VDD | 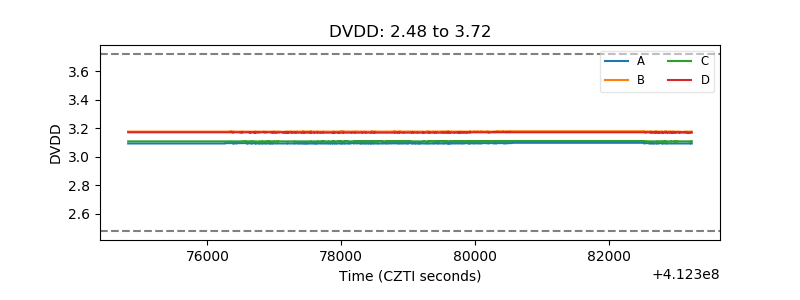 |
| Temperature 1 | 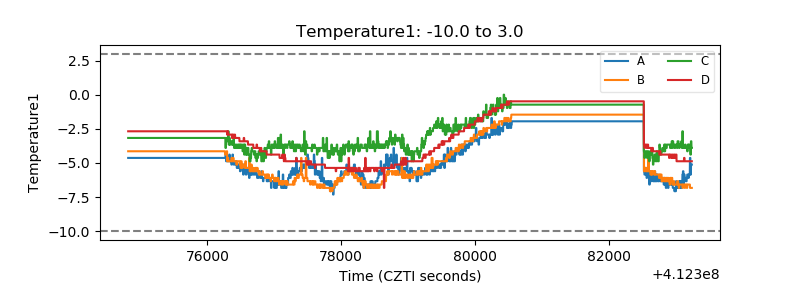 |
| Veto HV Monitor | 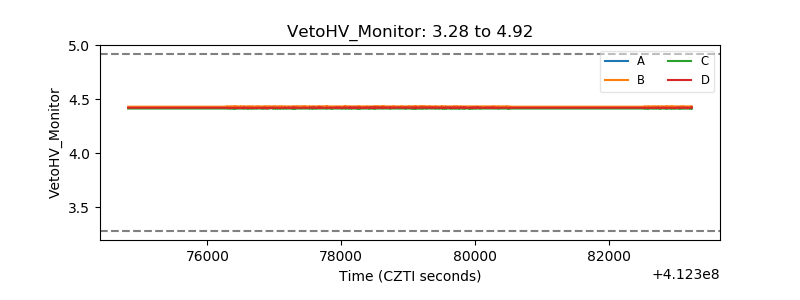 |
| Veto LLD | 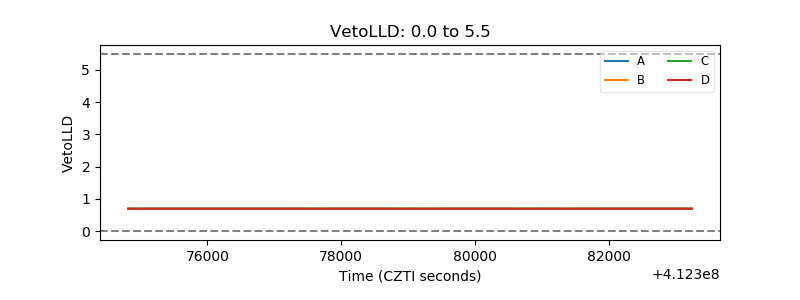 |
| Alpha Counter | 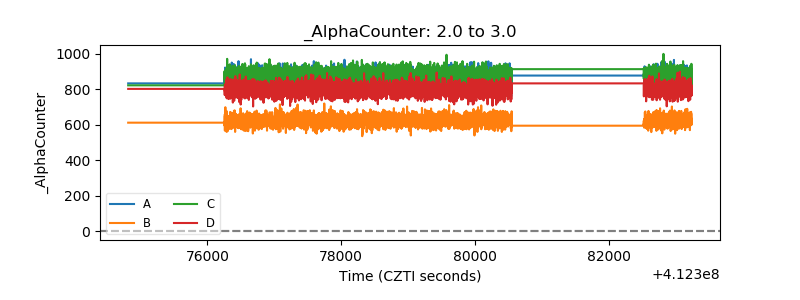 |
| _CPM_Rate | 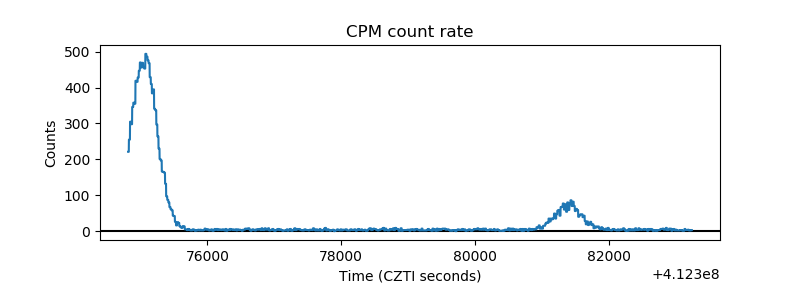 |
| CZT Counter | 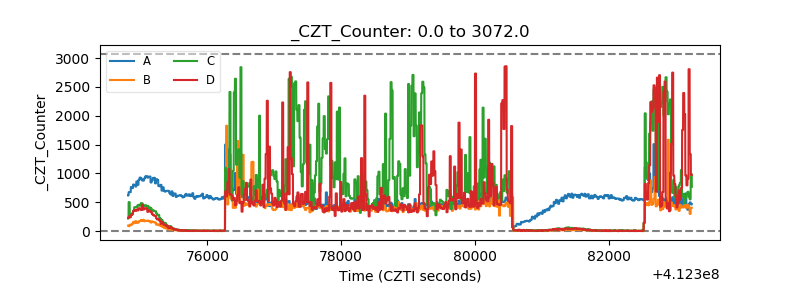 |
| +2.5 Volts monitor | 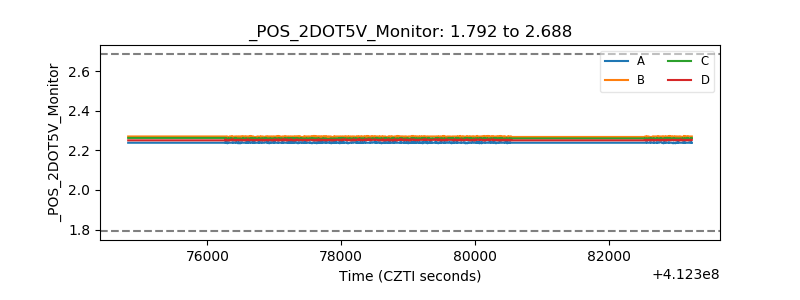 |
| +5 Volts monitor | 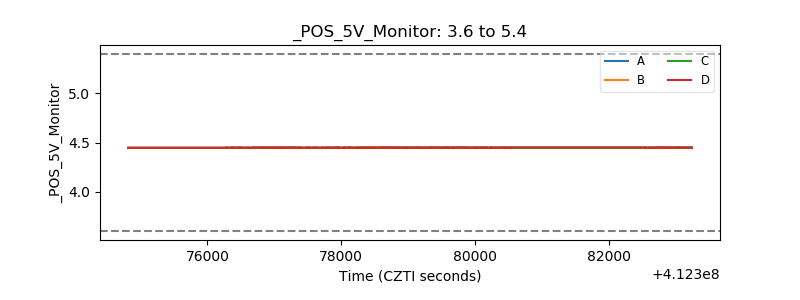 |
| _ROLL_ROT | 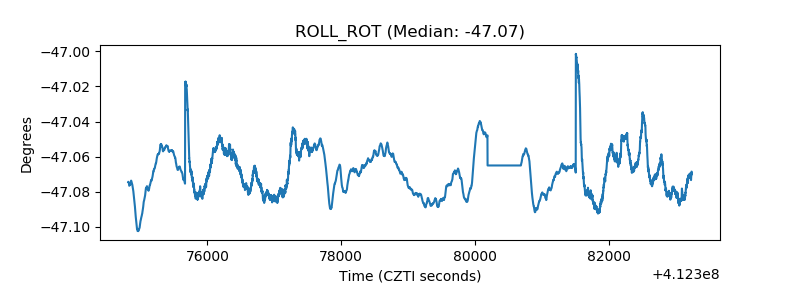 |
| _Roll_DEC | 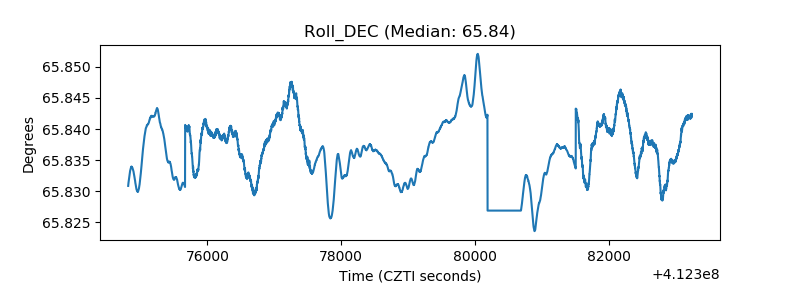 |
| _Roll_RA | 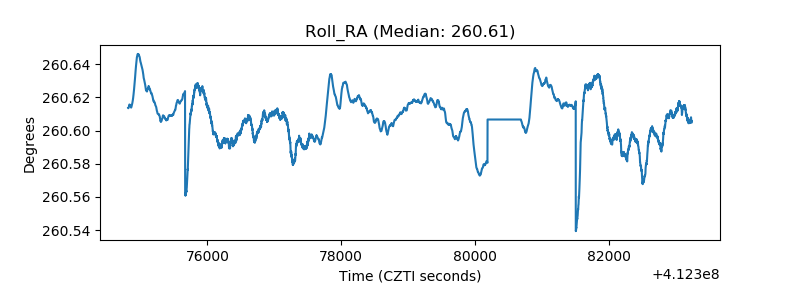 |
| Veto Counter | 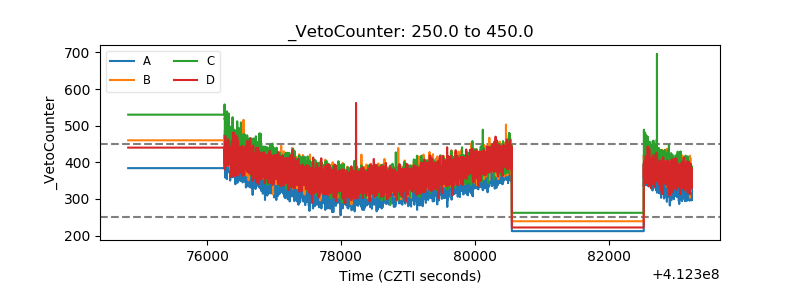 |