| Param | Original file | Final file |
|---|---|---|
| Filename | modeM0/AS1A12_018T01_9000005488_39625cztM0_level2.fits | modeM0/AS1A12_018T01_9000005488_39625cztM0_level2_quad_clean.evt |
| Size (bytes) | 1,766,543,040 | 385,248,960 |
| Size | 1.6 GB | 367.4 MB |
| Events in quadrant A | 12,293,651 | 2,648,929 |
| Events in quadrant B | 10,759,656 | 2,717,906 |
| Events in quadrant C | 22,937,193 | 2,430,874 |
| Events in quadrant D | 17,624,629 | 2,283,602 |
| Mode SS | |||
|---|---|---|---|
| Quadrant | BADHDUFLAG | Total packets | Discarded packets |
| A | 0 | 472 | 0 |
| B | 0 | 472 | 0 |
| C | 0 | 472 | 0 |
| D | 0 | 472 | 0 |
| Mode M0 | |||
|---|---|---|---|
| Quadrant | BADHDUFLAG | Total packets | Discarded packets |
| A | 0 | 51570 | 6 |
| B | 0 | 48646 | 5 |
| C | 0 | 84182 | 5 |
| D | 0 | 68716 | 5 |
| Mode M9 | |||
|---|---|---|---|
| Quadrant | BADHDUFLAG | Total packets | Discarded packets |
| A | 0 | 92 | 0 |
| B | 0 | 92 | 0 |
| C | 0 | 92 | 0 |
| D | 0 | 92 | 0 |
| Quadrant | Total seconds | Saturated seconds | Saturation percentage |
|---|---|---|---|
| A | 23003 | 135 | 0.586880% |
| B | 23003 | 222 | 0.965092% |
| C | 23003 | 2456 | 10.676868% |
| D | 23003 | 1799 | 7.820719% |
Noise dominated data is calculated using 1-second bins in cleaned event files. If a bin has >2000 counts, and if more than 50% of those come from <1% of pixels, then it is considered to be noise-dominated and hence unusable.
| Quadrant | # 1 sec bins | Bins with >0 counts | Bins with >2000 counts | High rate bins dominated by noise | Noise dominated (total time) | Noise dominated (detector-on time) | Marked lightcurve |
|---|---|---|---|---|---|---|---|
| A | 32236 | 23008 | 93 | 93 | 0.29% | 0.40% | 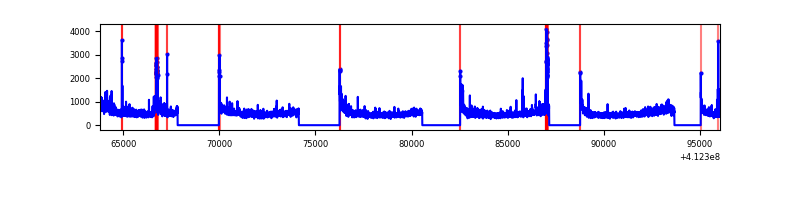 |
| B | 32236 | 23008 | 117 | 117 | 0.36% | 0.51% | 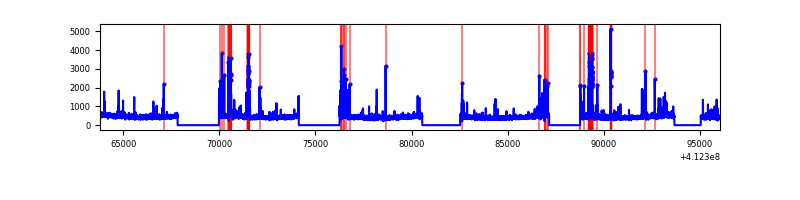 |
| C | 32236 | 23008 | 2319 | 2319 | 7.19% | 10.08% | 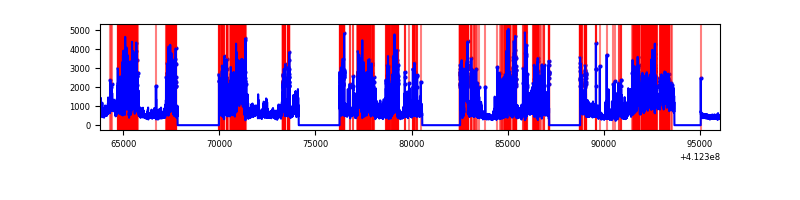 |
| D | 32236 | 23008 | 1572 | 1572 | 4.88% | 6.83% | 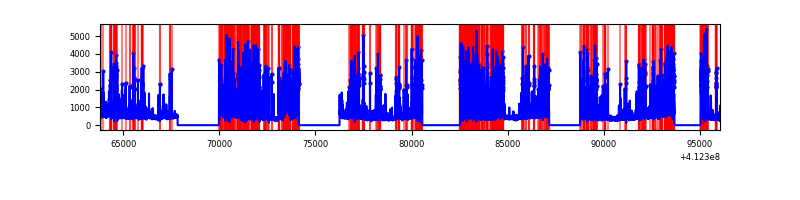 |
Top three noisy pixels from each quadrant. If the there are fewer than three noisy pixels in the level2.evt file, extra rows are filled as -1
| Pixel properties | Quadrant properties | ||||||
|---|---|---|---|---|---|---|---|
| Quadrant | DetID | PixID | Counts | Sigma | Mean | Median | Sigma |
| A | 10 | 83 | 1615821 | 3271.94 | 2491 | 2446 | 493.1 |
| A | 15 | 222 | 686586 | 1387.44 | 2491 | 2446 | 493.1 |
| A | 15 | 174 | 147720 | 294.62 | 2491 | 2446 | 493.1 |
| B | 5 | 172 | 690587 | 1478.81 | 2481 | 2413 | 465.4 |
| B | 5 | 255 | 291604 | 621.44 | 2481 | 2413 | 465.4 |
| B | 12 | 111 | 58613 | 120.77 | 2481 | 2413 | 465.4 |
| C | 9 | 187 | 9284478 | 17138.7 | 2367 | 2386 | 541.6 |
| C | 15 | 208 | 3381337 | 6238.98 | 2367 | 2386 | 541.6 |
| C | 15 | 214 | 913804 | 1682.87 | 2367 | 2386 | 541.6 |
| D | 13 | 249 | 4550462 | 8001.29 | 2357 | 2296 | 568.4 |
| D | 12 | 227 | 1777283 | 3122.62 | 2357 | 2296 | 568.4 |
| D | 2 | 249 | 542501 | 950.35 | 2357 | 2296 | 568.4 |
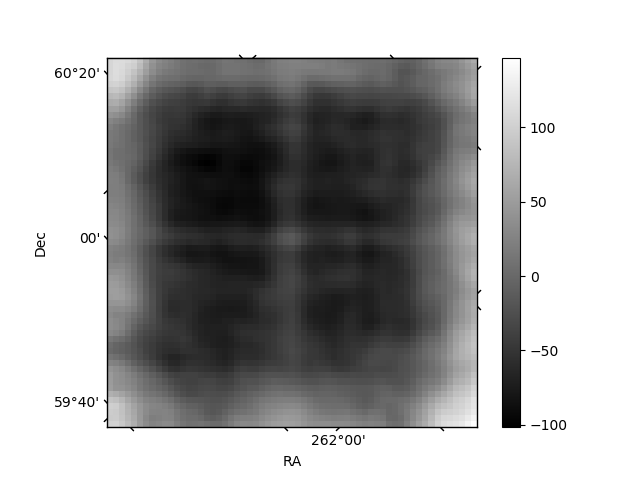
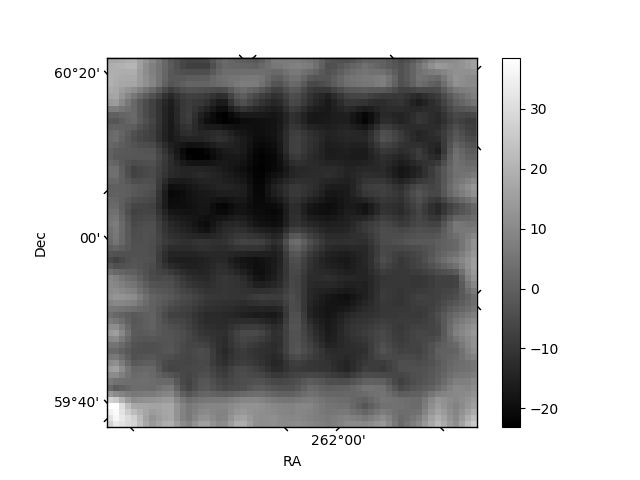
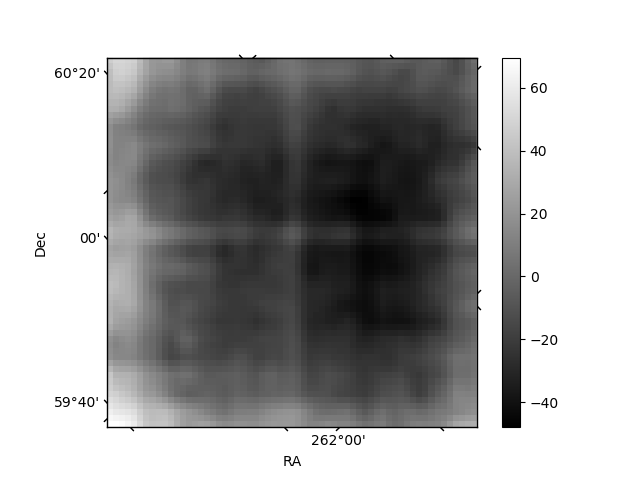
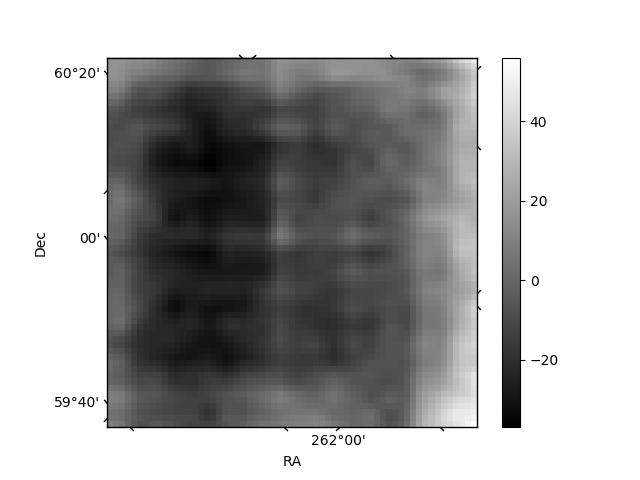
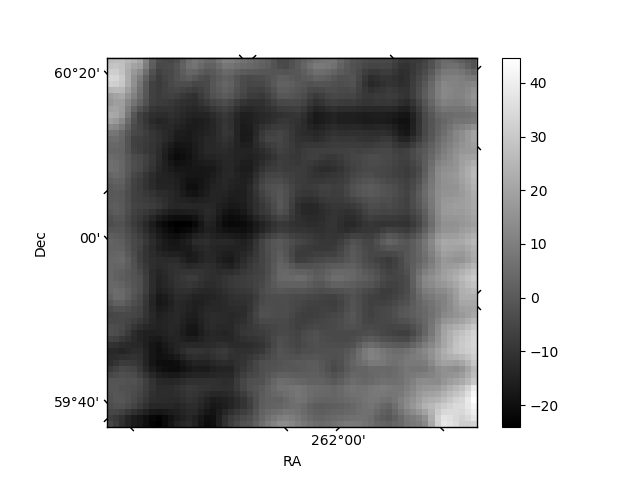
Histogram calculated using DETX and DETY for each event in the final _common_clean file
| Quadrant A | 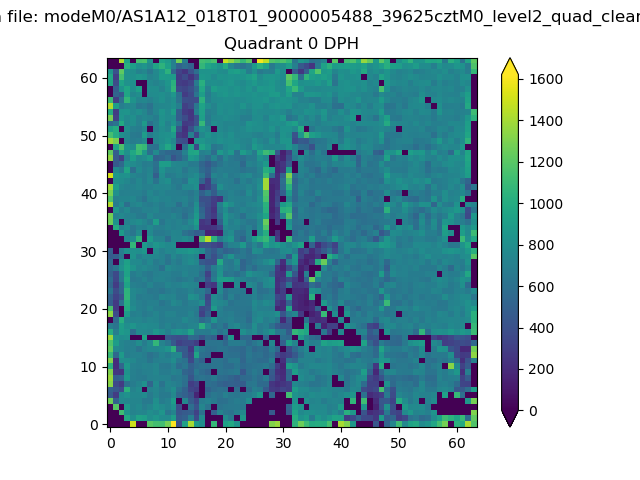 |
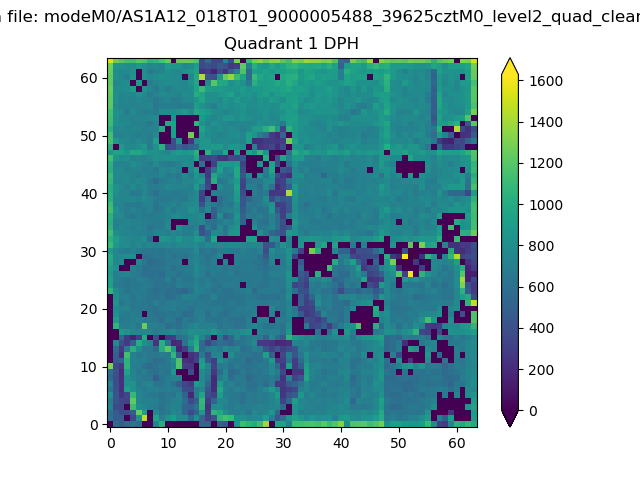 |
Quadrant B |
|---|---|---|---|
| Quadrant D | 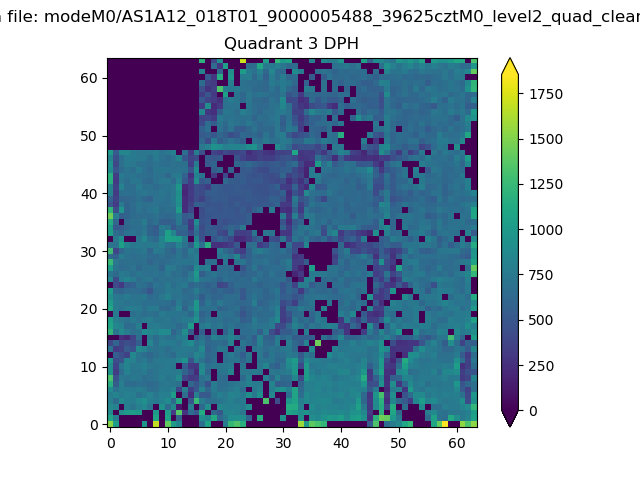 |
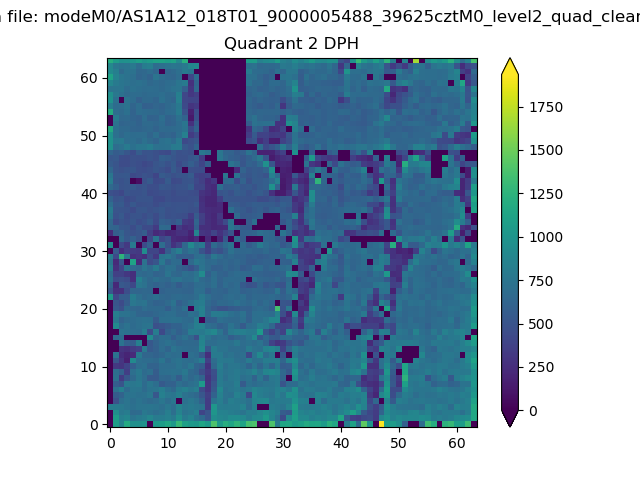 |
Quadrant C |
| Plot type | Count rate plots | Images |
|---|---|---|
| Comparison with Poisson distribution Blue bars denote a histogram of data divided into 1 sec bins. Red curve is a Poisson curve with rate = median count rate of data. |
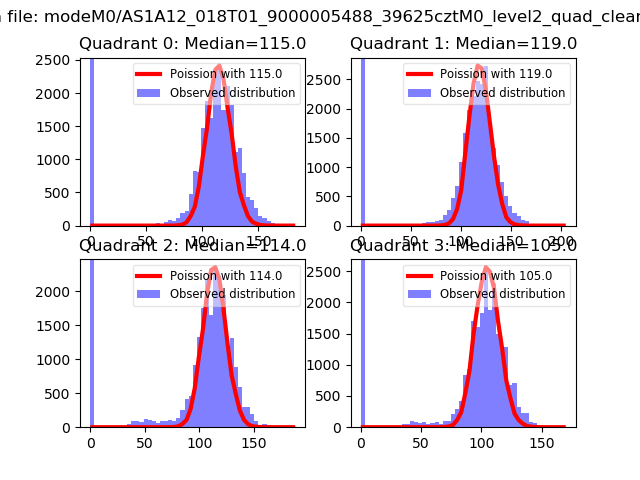 |
 |
| Quadrant-wise count rates Data is divided into 100 sec bins |
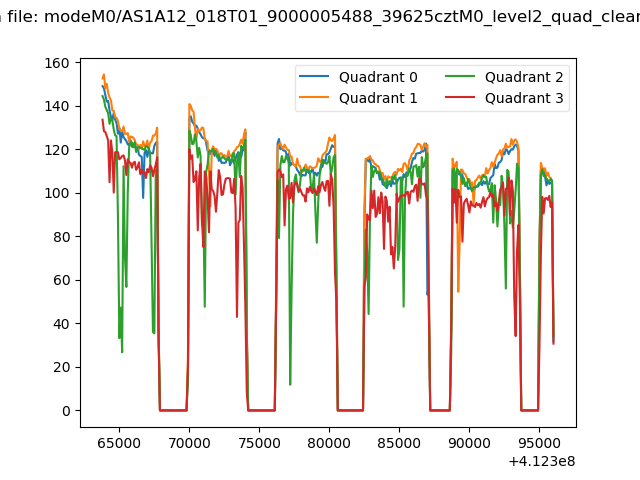 |
|
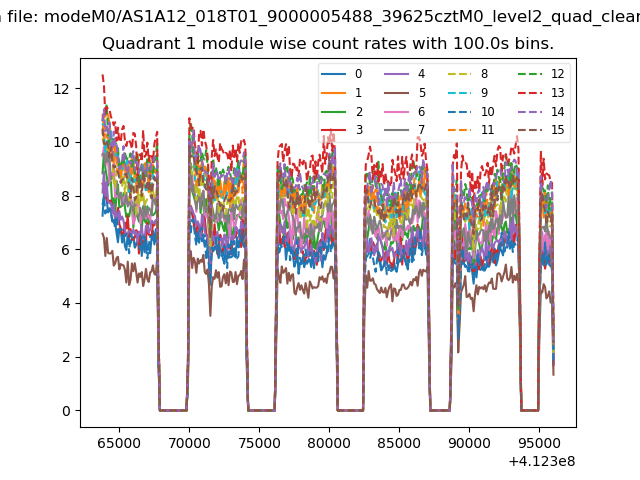
| Module-wise count rates for Quadrant A Data is divided into 100 sec bins |
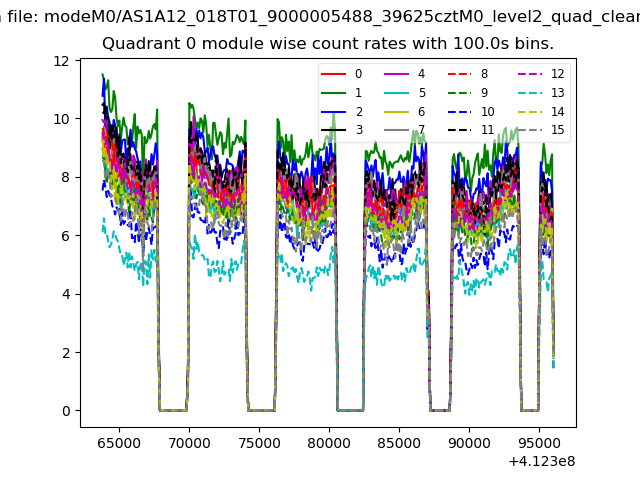 |
 |
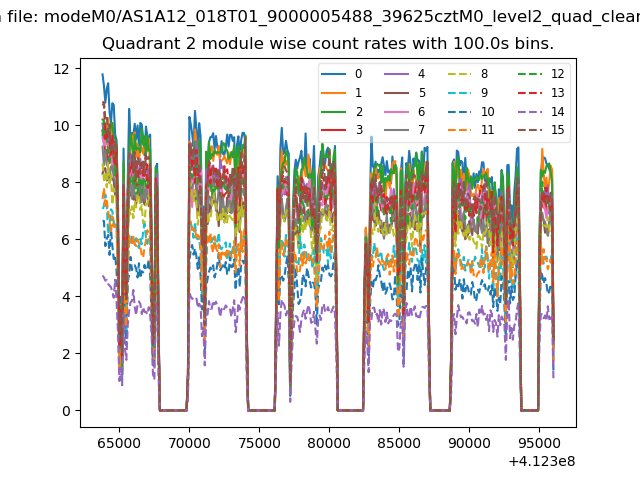
| Module-wise count rates for Quadrant B Data is divided into 100 sec bins |
 |
 |
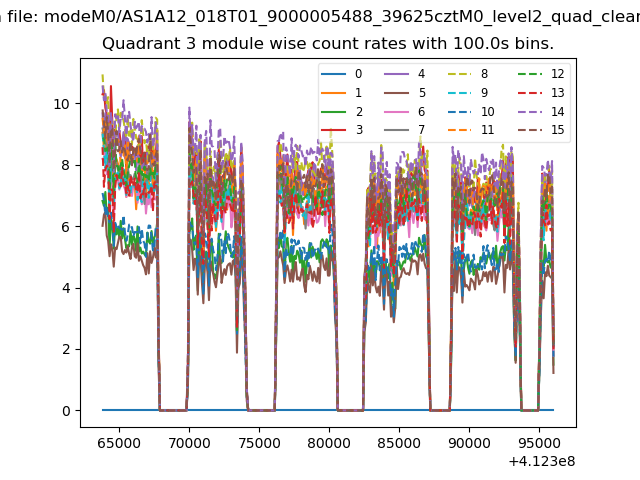
| Module-wise count rates for Quadrant C Data is divided into 100 sec bins |
 |
 |
| Module-wise count rates for Quadrant D Data is divided into 100 sec bins |
 |
 |
| Parameter | Plot |
|---|---|
| CZT HV Monitor | 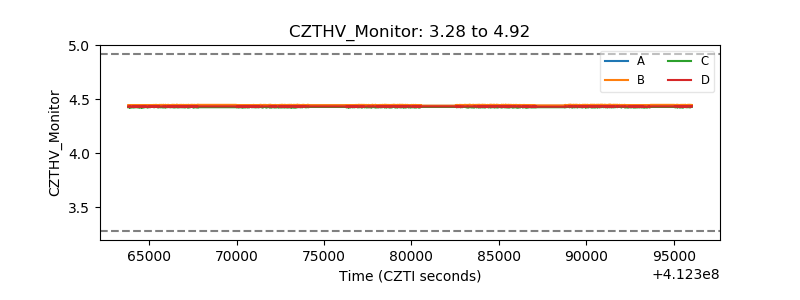 |
| D_VDD | 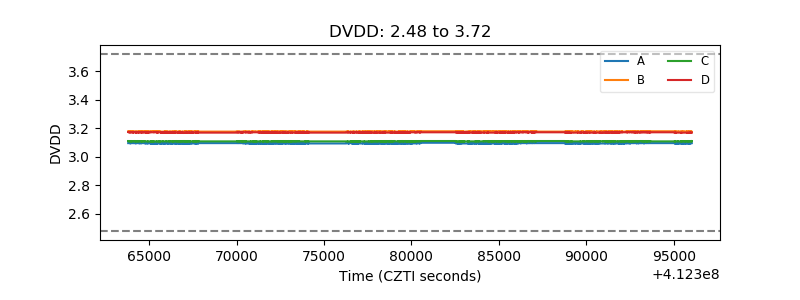 |
| Temperature 1 | 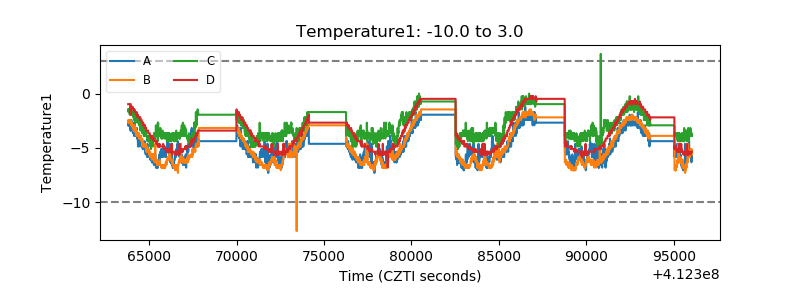 |
| Veto HV Monitor | 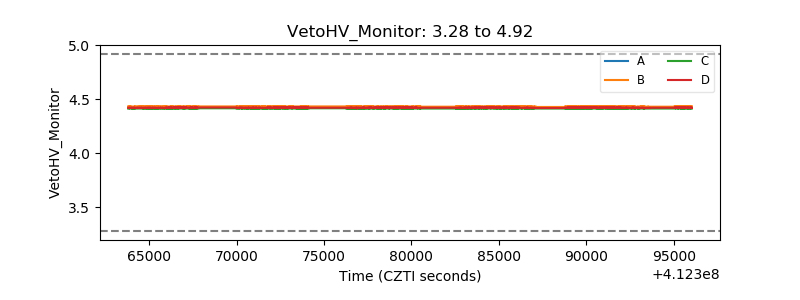 |
| Veto LLD | 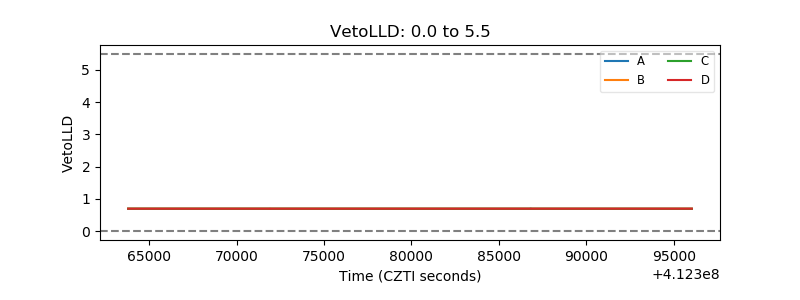 |
| Alpha Counter | 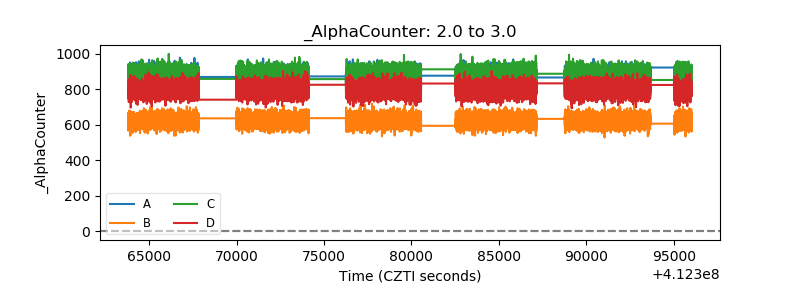 |
| _CPM_Rate | 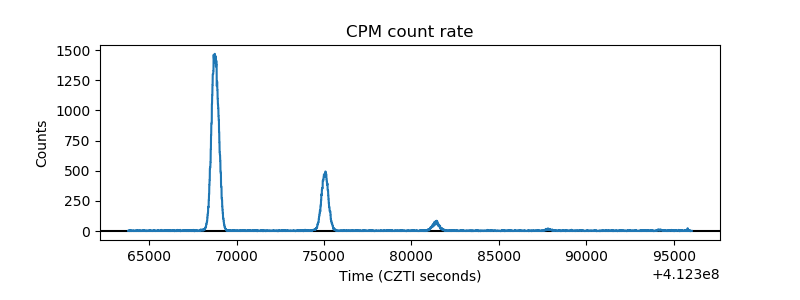 |
| CZT Counter | 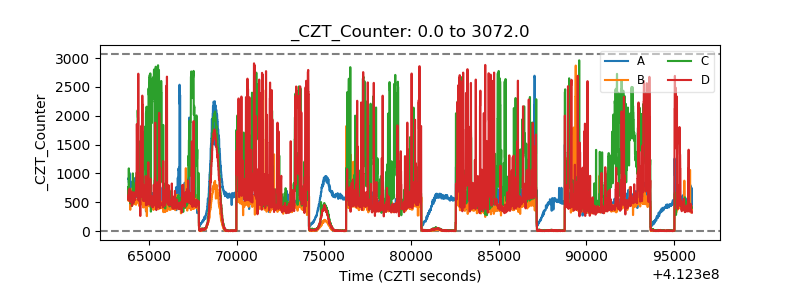 |
| +2.5 Volts monitor |  |
| +5 Volts monitor | 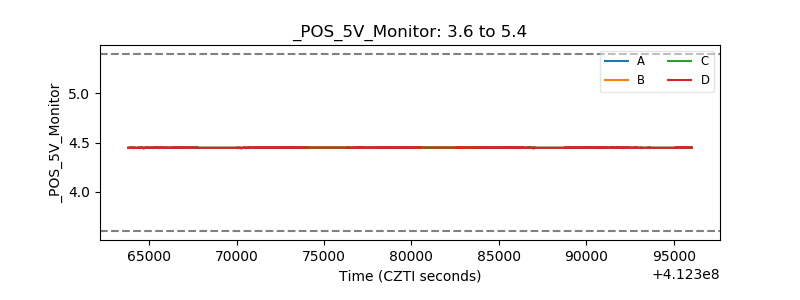 |
| _ROLL_ROT | 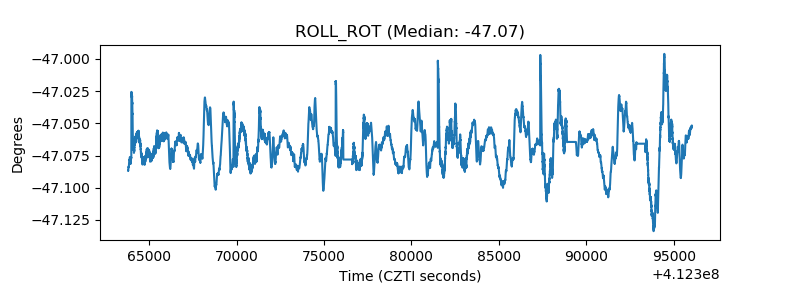 |
| _Roll_DEC | 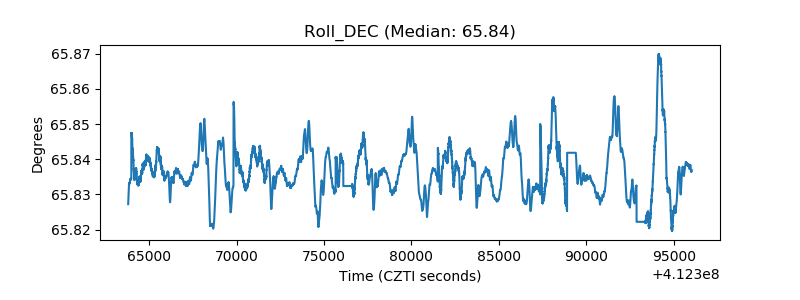 |
| _Roll_RA | 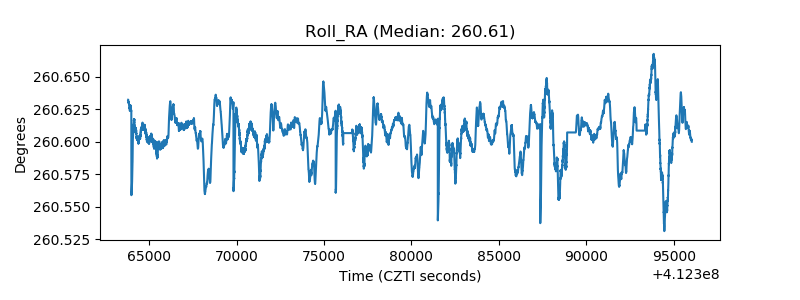 |
| Veto Counter | 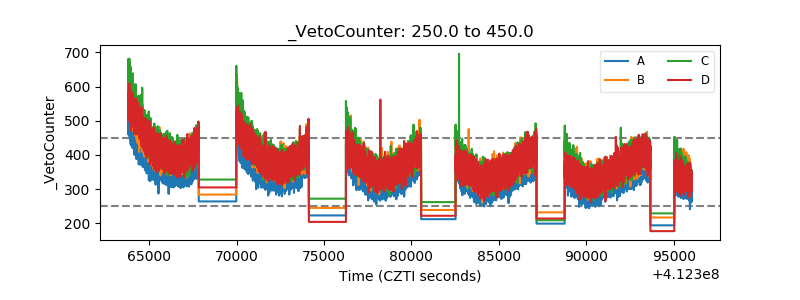 |