| Param | Original file | Final file |
|---|---|---|
| Filename | modeM0/AS1A12_018T01_9000005488_39626cztM0_level2.fits | modeM0/AS1A12_018T01_9000005488_39626cztM0_level2_quad_clean.evt |
| Size (bytes) | 438,048,000 | 100,728,000 |
| Size | 417.8 MB | 96.1 MB |
| Events in quadrant A | 3,304,608 | 686,439 |
| Events in quadrant B | 2,711,163 | 705,284 |
| Events in quadrant C | 4,640,796 | 636,252 |
| Events in quadrant D | 5,068,483 | 581,593 |
| Mode SS | |||
|---|---|---|---|
| Quadrant | BADHDUFLAG | Total packets | Discarded packets |
| A | 0 | 132 | 0 |
| B | 0 | 132 | 0 |
| C | 0 | 132 | 0 |
| D | 0 | 132 | 0 |
| Mode M0 | |||
|---|---|---|---|
| Quadrant | BADHDUFLAG | Total packets | Discarded packets |
| A | 0 | 13833 | 3 |
| B | 0 | 12721 | 2 |
| C | 0 | 18080 | 2 |
| D | 0 | 19641 | 2 |
| Mode M9 | |||
|---|---|---|---|
| Quadrant | BADHDUFLAG | Total packets | Discarded packets |
| A | 0 | 26 | 0 |
| B | 0 | 26 | 0 |
| C | 0 | 26 | 0 |
| D | 0 | 26 | 0 |
| Quadrant | Total seconds | Saturated seconds | Saturation percentage |
|---|---|---|---|
| A | 6301 | 11 | 0.174575% |
| B | 6301 | 5 | 0.079352% |
| C | 6301 | 415 | 6.586256% |
| D | 6301 | 512 | 8.125694% |
Noise dominated data is calculated using 1-second bins in cleaned event files. If a bin has >2000 counts, and if more than 50% of those come from <1% of pixels, then it is considered to be noise-dominated and hence unusable.
| Quadrant | # 1 sec bins | Bins with >0 counts | Bins with >2000 counts | High rate bins dominated by noise | Noise dominated (total time) | Noise dominated (detector-on time) | Marked lightcurve |
|---|---|---|---|---|---|---|---|
| A | 8955 | 6303 | 4 | 4 | 0.04% | 0.06% | 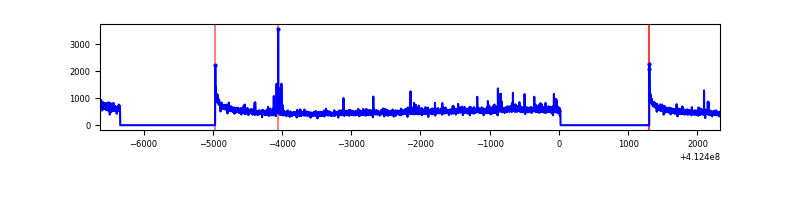 |
| B | 8955 | 6303 | 1 | 1 | 0.01% | 0.02% | 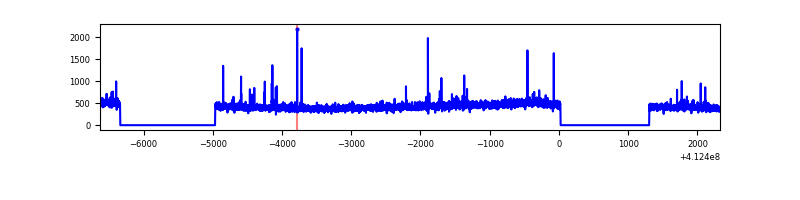 |
| C | 8955 | 6303 | 363 | 363 | 4.05% | 5.76% | 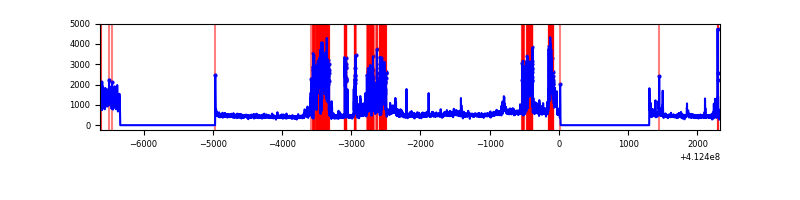 |
| D | 8955 | 6303 | 445 | 445 | 4.97% | 7.06% | 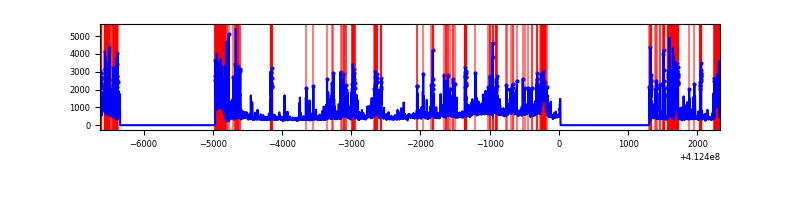 |
Top three noisy pixels from each quadrant. If the there are fewer than three noisy pixels in the level2.evt file, extra rows are filled as -1
| Pixel properties | Quadrant properties | ||||||
|---|---|---|---|---|---|---|---|
| Quadrant | DetID | PixID | Counts | Sigma | Mean | Median | Sigma |
| A | 10 | 83 | 498950 | 3597.61 | 676 | 661 | 138.5 |
| A | 15 | 222 | 159771 | 1148.76 | 676 | 661 | 138.5 |
| A | 9 | 143 | 28469 | 200.77 | 676 | 661 | 138.5 |
| B | 5 | 255 | 51869 | 395.57 | 674 | 656 | 129.5 |
| B | 12 | 111 | 16530 | 122.61 | 674 | 656 | 129.5 |
| B | 11 | 111 | 15355 | 113.53 | 674 | 656 | 129.5 |
| C | 9 | 187 | 1732684 | 11519.02 | 646 | 650 | 150.4 |
| C | 15 | 214 | 258042 | 1711.8 | 646 | 650 | 150.4 |
| C | 15 | 208 | 109732 | 725.46 | 646 | 650 | 150.4 |
| D | 13 | 249 | 1282496 | 8194.61 | 638 | 617 | 156.4 |
| D | 2 | 249 | 372361 | 2376.43 | 638 | 617 | 156.4 |
| D | 12 | 227 | 281470 | 1795.4 | 638 | 617 | 156.4 |
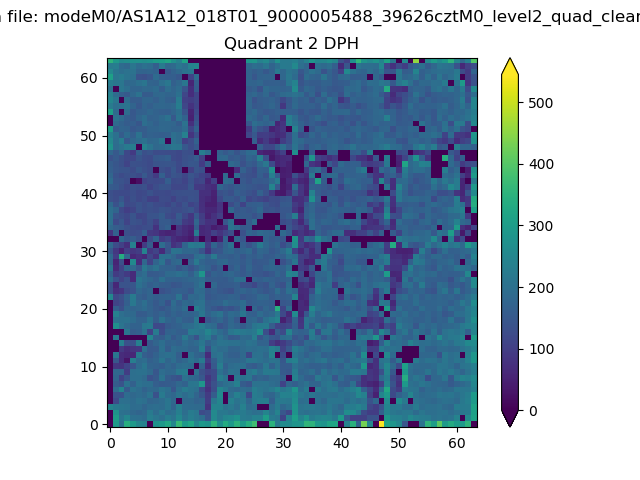
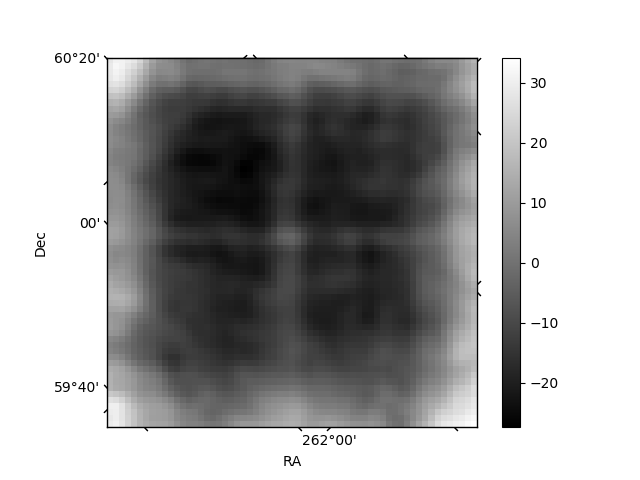
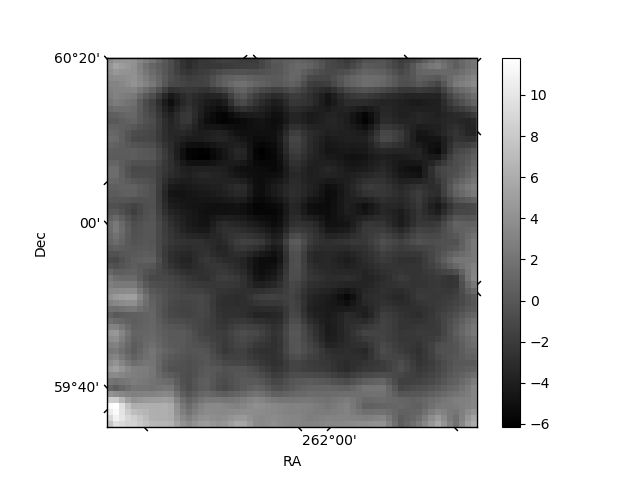
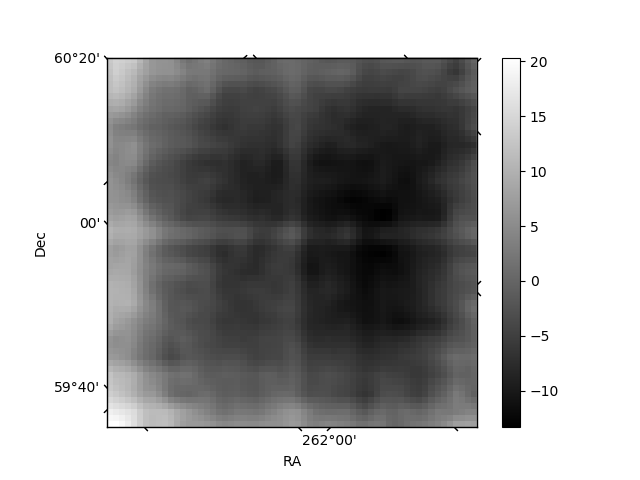
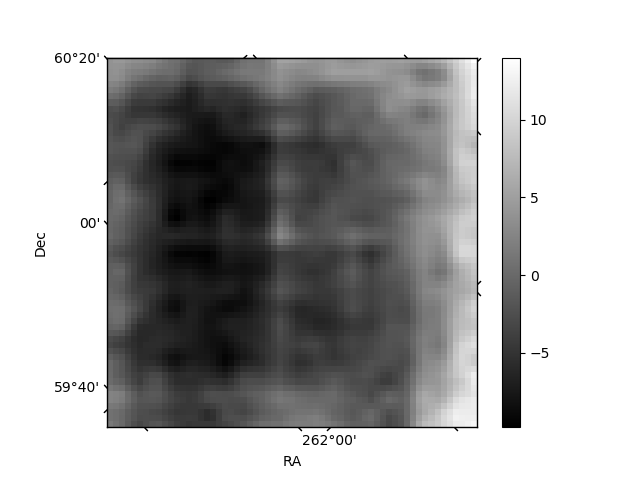
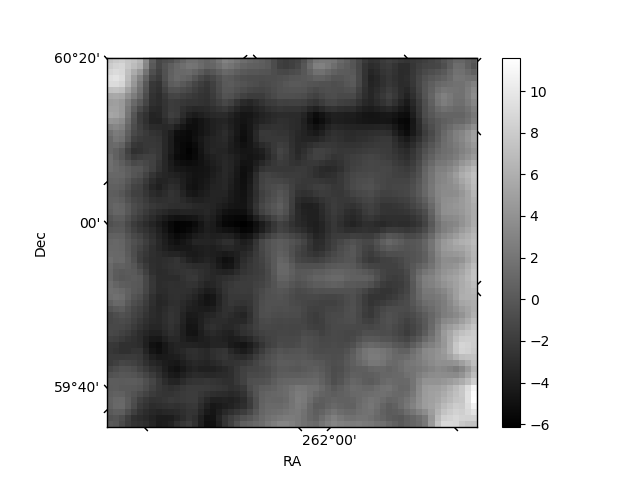
Histogram calculated using DETX and DETY for each event in the final _common_clean file
| Quadrant A | 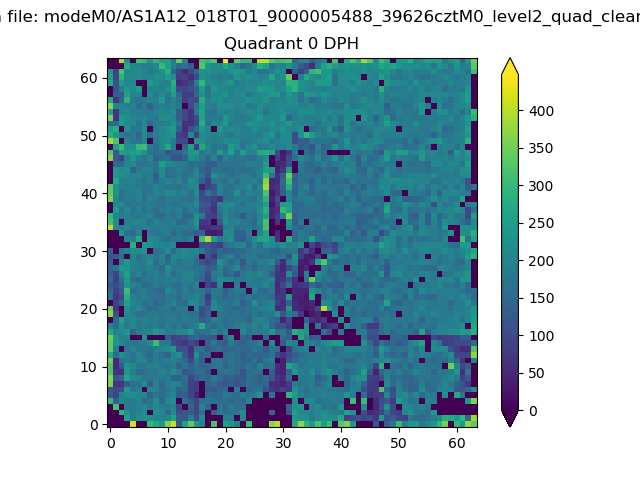 |
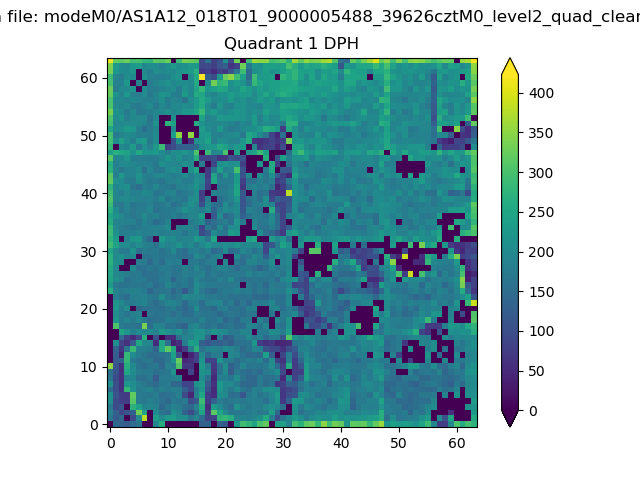 |
Quadrant B |
|---|---|---|---|
| Quadrant D | 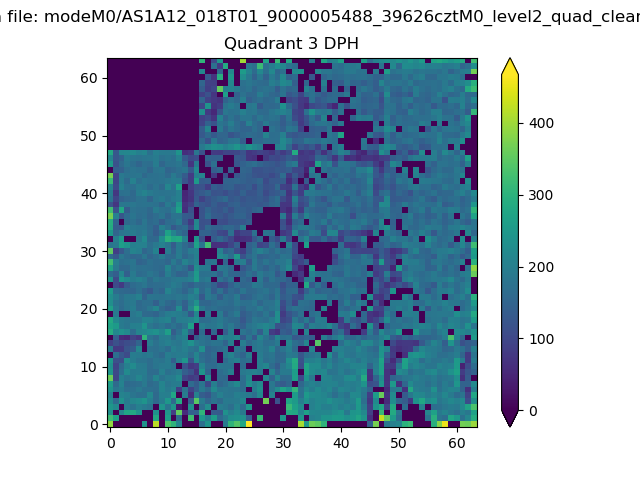 |
 |
Quadrant C |
| Plot type | Count rate plots | Images |
|---|---|---|
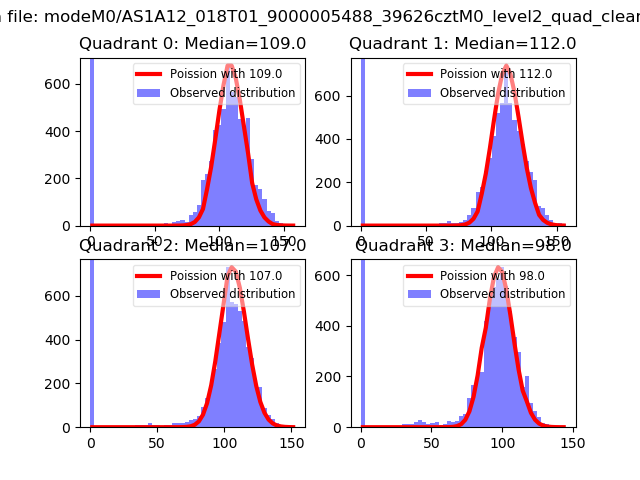
| Comparison with Poisson distribution Blue bars denote a histogram of data divided into 1 sec bins. Red curve is a Poisson curve with rate = median count rate of data. |
 |
 |
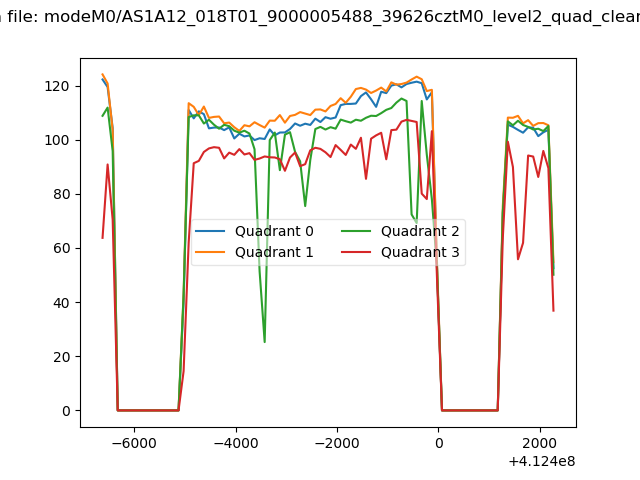
| Quadrant-wise count rates Data is divided into 100 sec bins |
 |
|
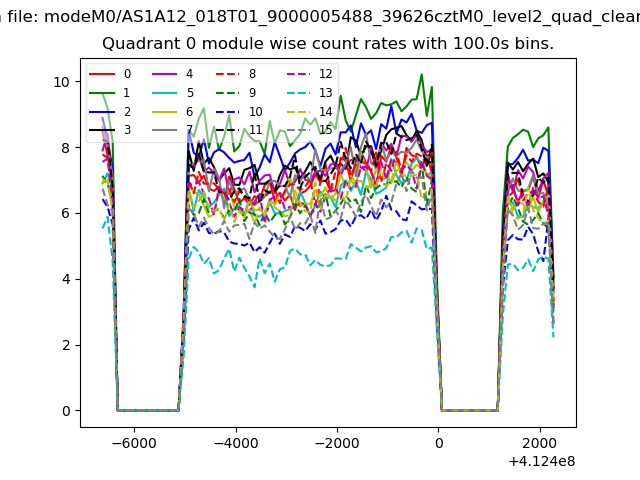
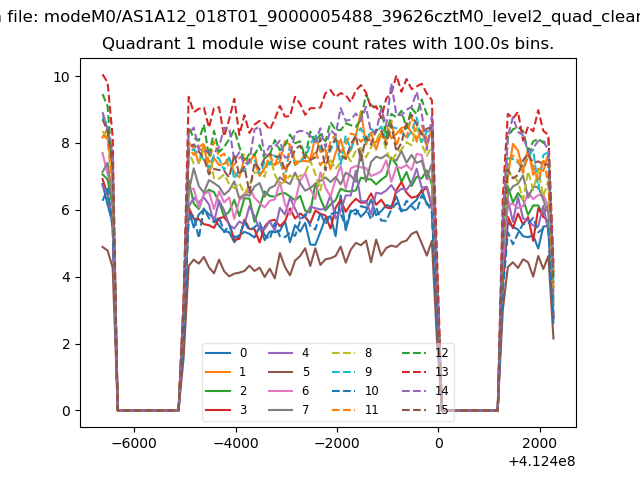
| Module-wise count rates for Quadrant A Data is divided into 100 sec bins |
 |
 |
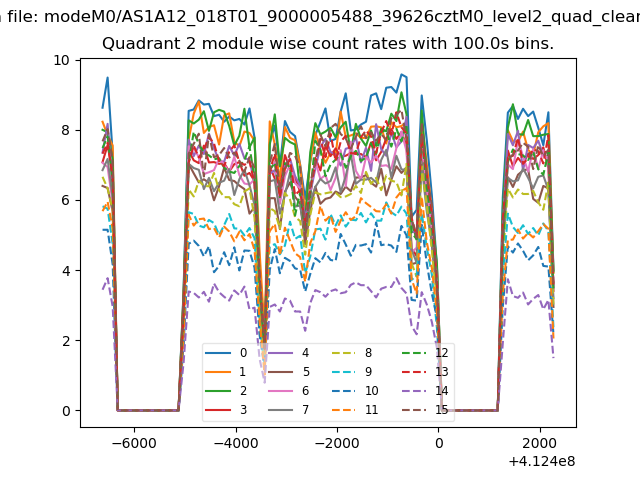
| Module-wise count rates for Quadrant B Data is divided into 100 sec bins |
 |
 |
| Module-wise count rates for Quadrant C Data is divided into 100 sec bins |
 |
 |
| Module-wise count rates for Quadrant D Data is divided into 100 sec bins |
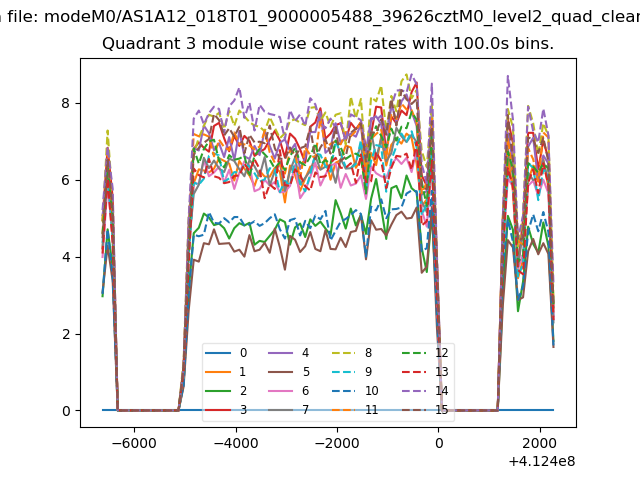 |
 |
| Parameter | Plot |
|---|---|
| CZT HV Monitor | 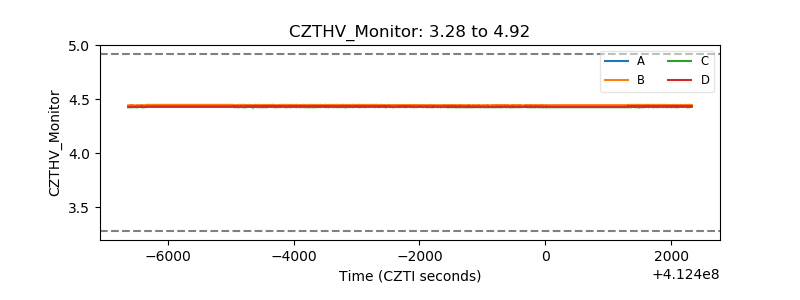 |
| D_VDD | 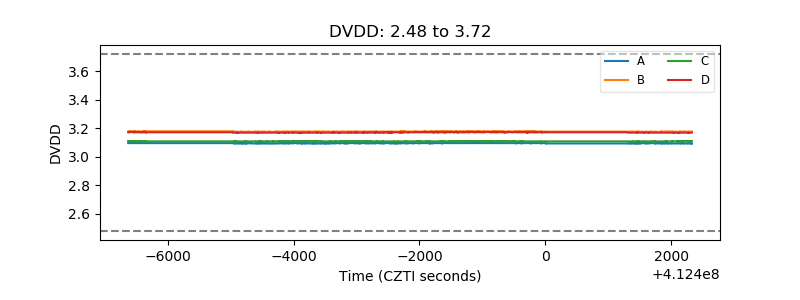 |
| Temperature 1 | 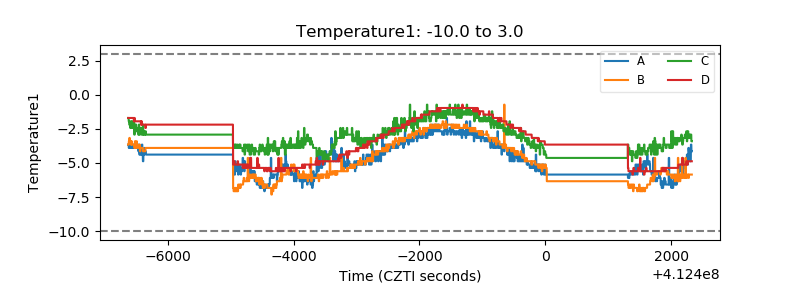 |
| Veto HV Monitor | 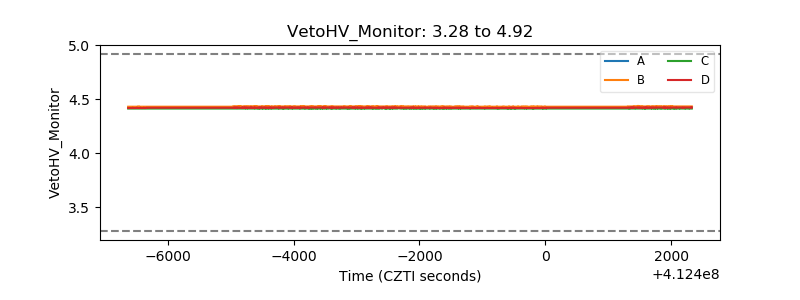 |
| Veto LLD | 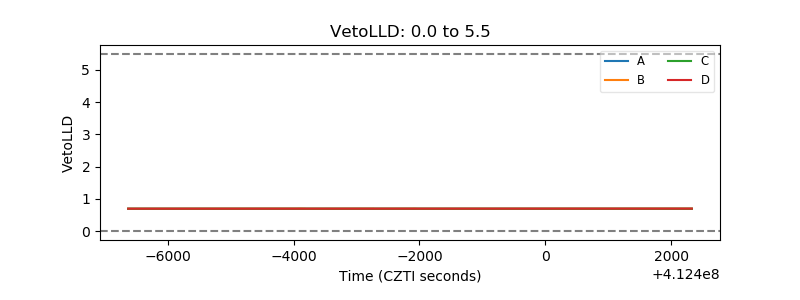 |
| Alpha Counter | 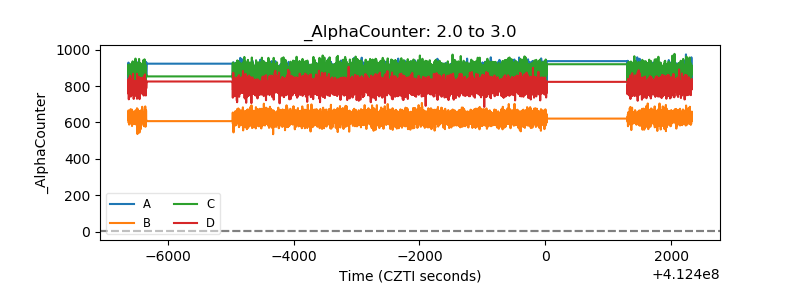 |
| _CPM_Rate | 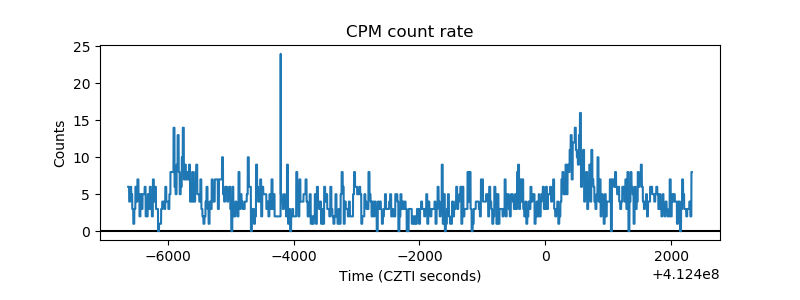 |
| CZT Counter | 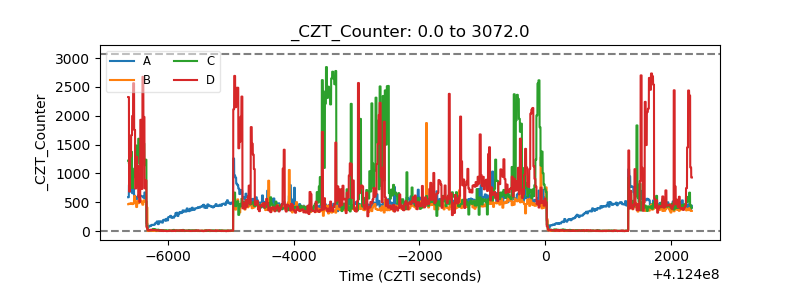 |
| +2.5 Volts monitor | 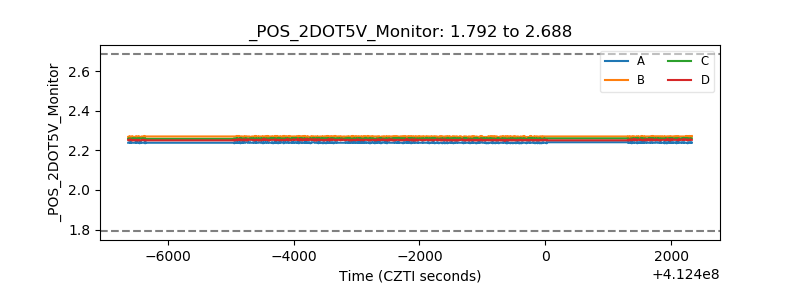 |
| +5 Volts monitor | 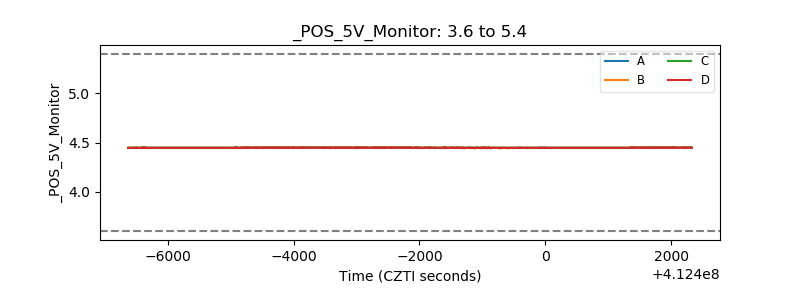 |
| _ROLL_ROT | 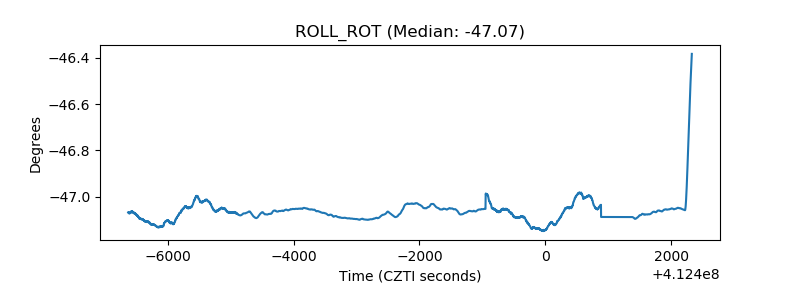 |
| _Roll_DEC | 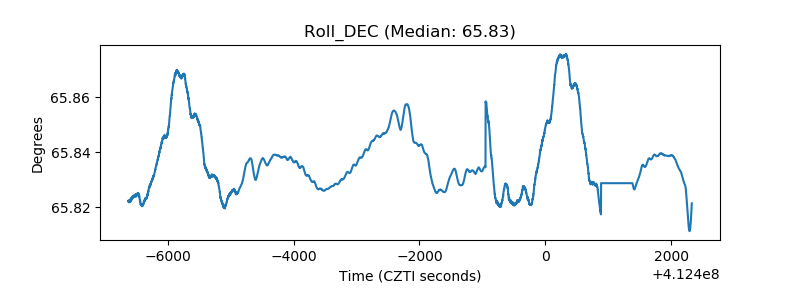 |
| _Roll_RA | 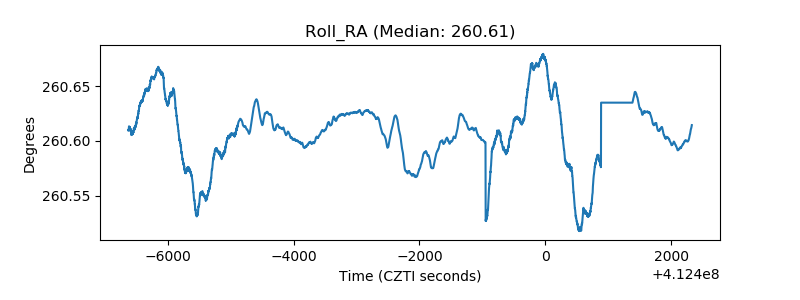 |
| Veto Counter | 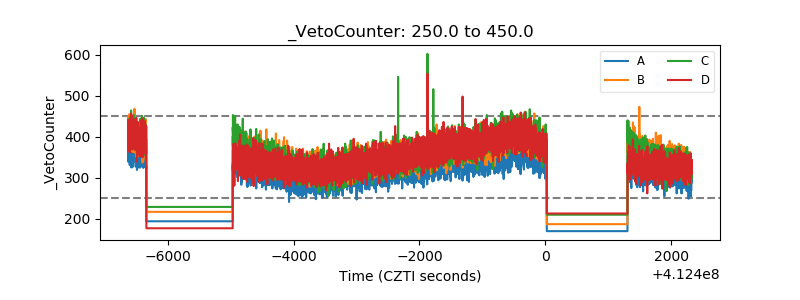 |