| Param | Original file | Final file |
|---|---|---|
| Filename | modeM0/AS1A12_018T01_9000005488_39628cztM0_level2.fits | modeM0/AS1A12_018T01_9000005488_39628cztM0_level2_quad_clean.evt |
| Size (bytes) | 505,952,640 | 98,688,960 |
| Size | 482.5 MB | 94.1 MB |
| Events in quadrant A | 3,349,332 | 690,489 |
| Events in quadrant B | 2,735,157 | 708,656 |
| Events in quadrant C | 6,250,650 | 633,631 |
| Events in quadrant D | 5,897,589 | 509,687 |
| Mode SS | |||
|---|---|---|---|
| Quadrant | BADHDUFLAG | Total packets | Discarded packets |
| A | 0 | 130 | 0 |
| B | 0 | 130 | 0 |
| C | 0 | 130 | 0 |
| D | 0 | 130 | 0 |
| Mode M0 | |||
|---|---|---|---|
| Quadrant | BADHDUFLAG | Total packets | Discarded packets |
| A | 0 | 13857 | 3 |
| B | 0 | 12948 | 1 |
| C | 0 | 23040 | 1 |
| D | 0 | 22200 | 1 |
| Mode M9 | |||
|---|---|---|---|
| Quadrant | BADHDUFLAG | Total packets | Discarded packets |
| A | 0 | 13 | 0 |
| B | 0 | 13 | 0 |
| C | 0 | 13 | 0 |
| D | 0 | 13 | 0 |
| Quadrant | Total seconds | Saturated seconds | Saturation percentage |
|---|---|---|---|
| A | 6383 | 14 | 0.219333% |
| B | 6384 | 6 | 0.093985% |
| C | 6384 | 575 | 9.006892% |
| D | 6384 | 1224 | 19.172932% |
Noise dominated data is calculated using 1-second bins in cleaned event files. If a bin has >2000 counts, and if more than 50% of those come from <1% of pixels, then it is considered to be noise-dominated and hence unusable.
| Quadrant | # 1 sec bins | Bins with >0 counts | Bins with >2000 counts | High rate bins dominated by noise | Noise dominated (total time) | Noise dominated (detector-on time) | Marked lightcurve |
|---|---|---|---|---|---|---|---|
| A | 7696 | 6385 | 6 | 6 | 0.08% | 0.09% | 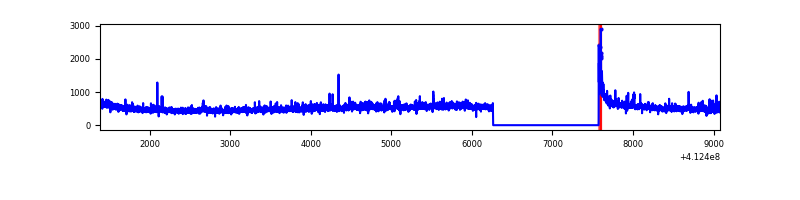 |
| B | 7696 | 6385 | 3 | 3 | 0.04% | 0.05% | 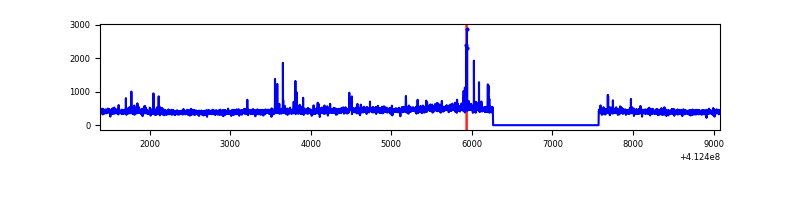 |
| C | 7696 | 6385 | 558 | 558 | 7.25% | 8.74% | 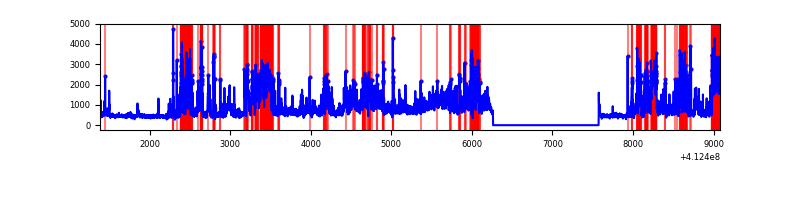 |
| D | 7696 | 6385 | 989 | 989 | 12.85% | 15.49% | 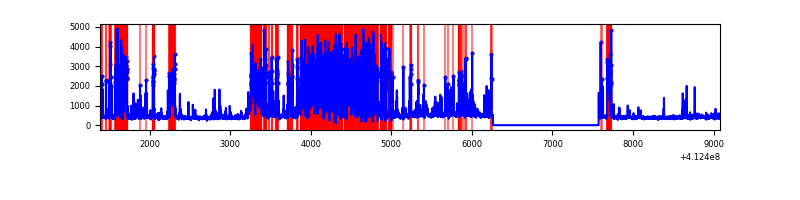 |
Top three noisy pixels from each quadrant. If the there are fewer than three noisy pixels in the level2.evt file, extra rows are filled as -1
| Pixel properties | Quadrant properties | ||||||
|---|---|---|---|---|---|---|---|
| Quadrant | DetID | PixID | Counts | Sigma | Mean | Median | Sigma |
| A | 10 | 83 | 461643 | 3337.6 | 680 | 665 | 138.1 |
| A | 15 | 222 | 227552 | 1642.72 | 680 | 665 | 138.1 |
| A | 15 | 223 | 20417 | 143.01 | 680 | 665 | 138.1 |
| B | 5 | 255 | 62108 | 472.07 | 675 | 657 | 130.2 |
| B | 5 | 172 | 17688 | 130.83 | 675 | 657 | 130.2 |
| B | 12 | 111 | 16538 | 122.0 | 675 | 657 | 130.2 |
| C | 9 | 187 | 2286712 | 15330.93 | 643 | 644 | 149.1 |
| C | 15 | 208 | 1182539 | 7926.08 | 643 | 644 | 149.1 |
| C | 15 | 214 | 259658 | 1737.01 | 643 | 644 | 149.1 |
| D | 13 | 249 | 1640161 | 11239.43 | 593 | 574 | 145.9 |
| D | 13 | 174 | 1589739 | 10893.79 | 593 | 574 | 145.9 |
| D | 13 | 171 | 127386 | 869.3 | 593 | 574 | 145.9 |
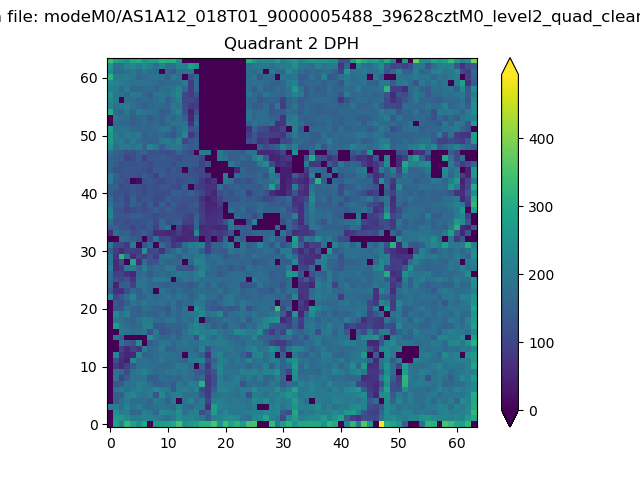
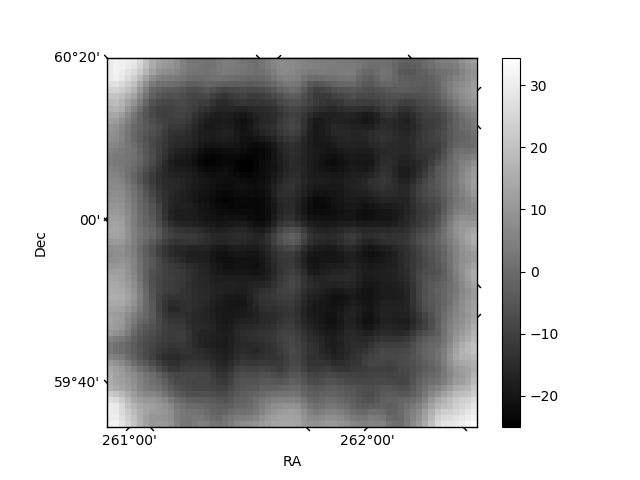
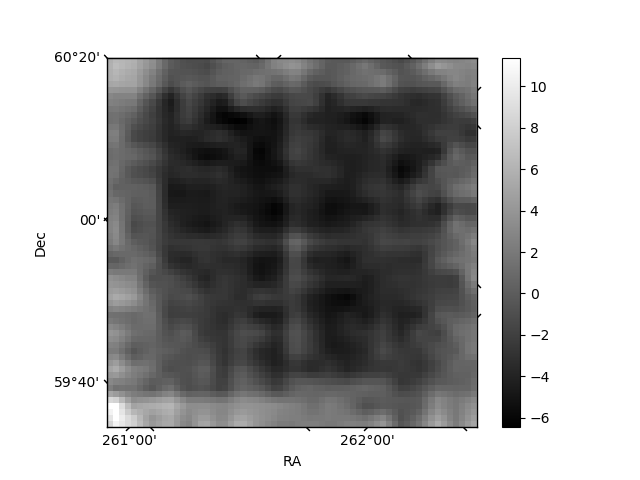
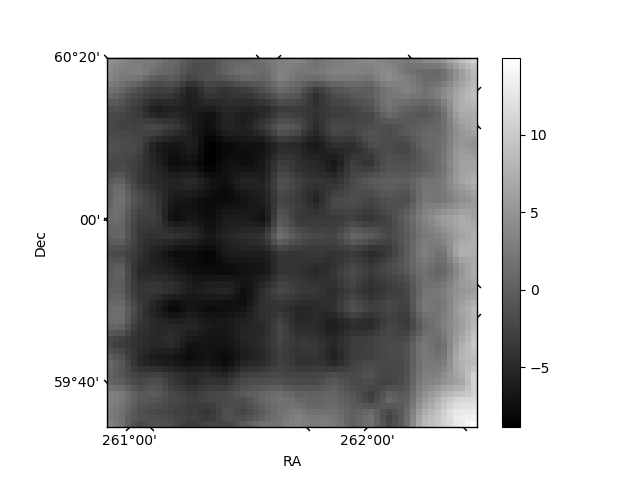
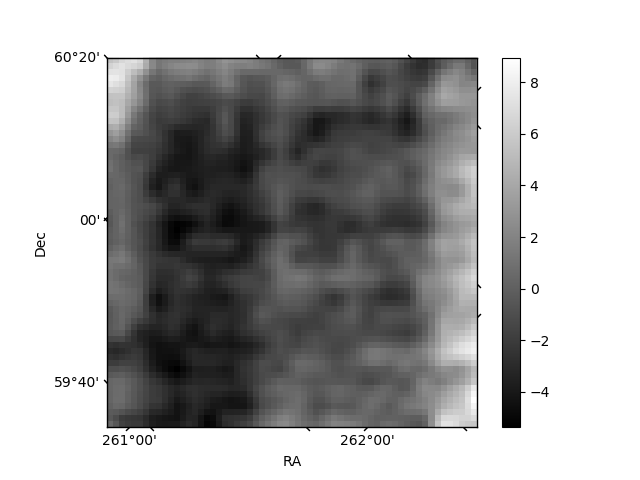
Histogram calculated using DETX and DETY for each event in the final _common_clean file
| Quadrant A | 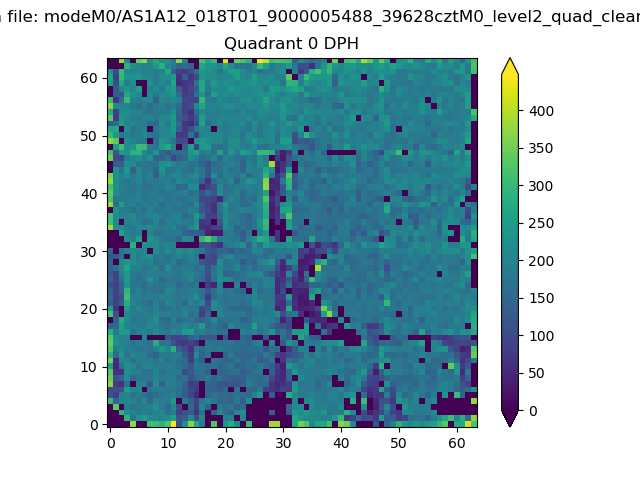 |
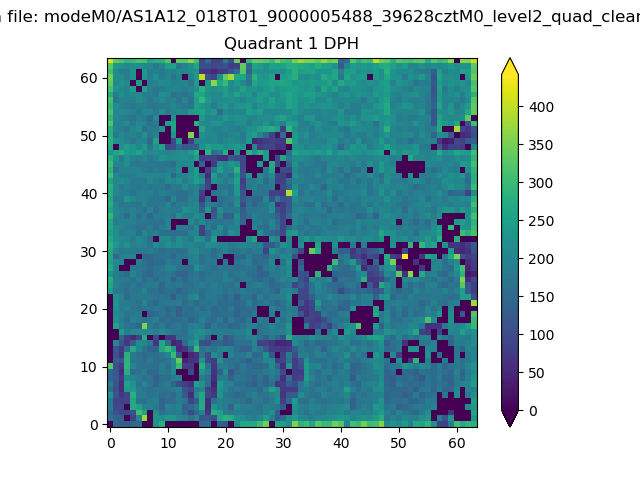 |
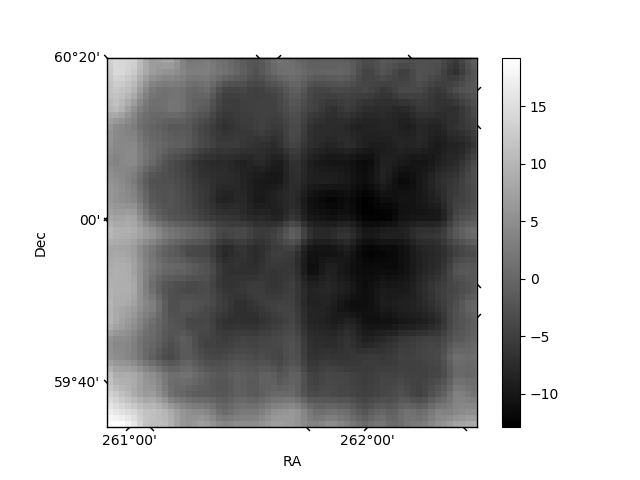
Quadrant B |
|---|---|---|---|
| Quadrant D | 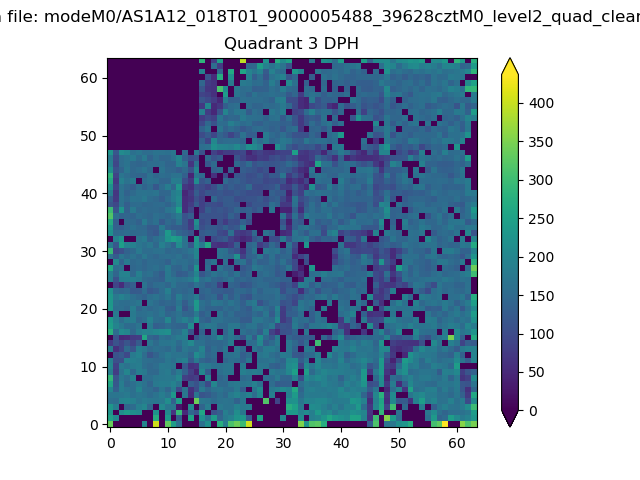 |
 |
Quadrant C |
| Plot type | Count rate plots | Images |
|---|---|---|
| Comparison with Poisson distribution Blue bars denote a histogram of data divided into 1 sec bins. Red curve is a Poisson curve with rate = median count rate of data. |
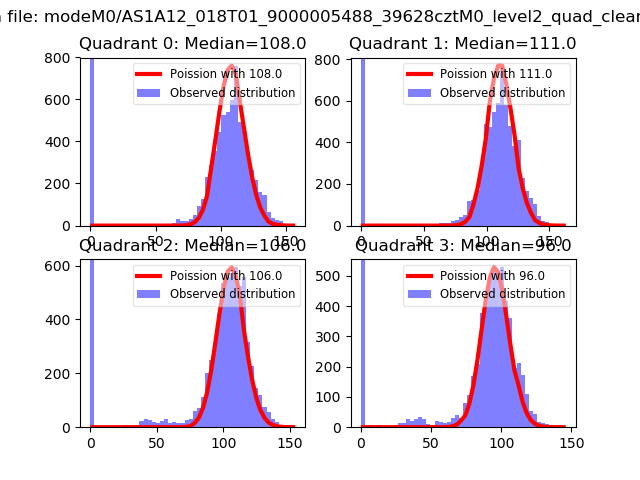 |
 |
| Quadrant-wise count rates Data is divided into 100 sec bins |
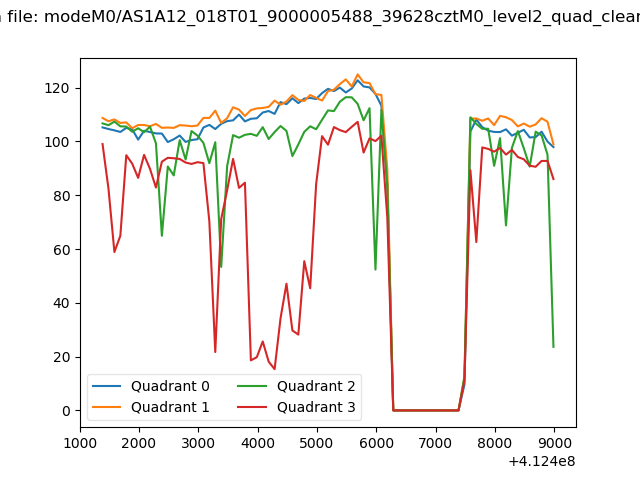 |
|
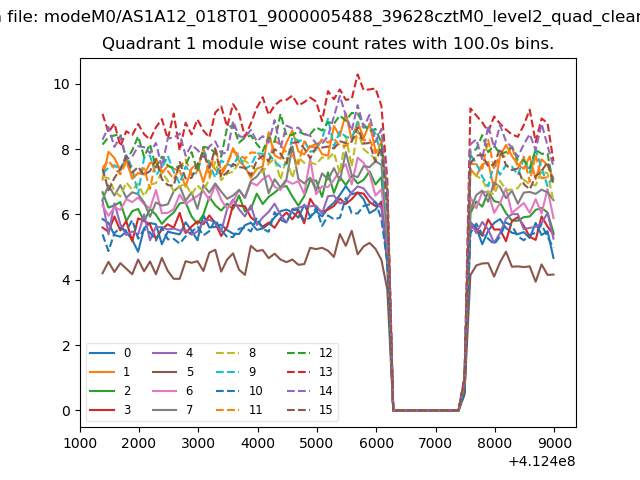
| Module-wise count rates for Quadrant A Data is divided into 100 sec bins |
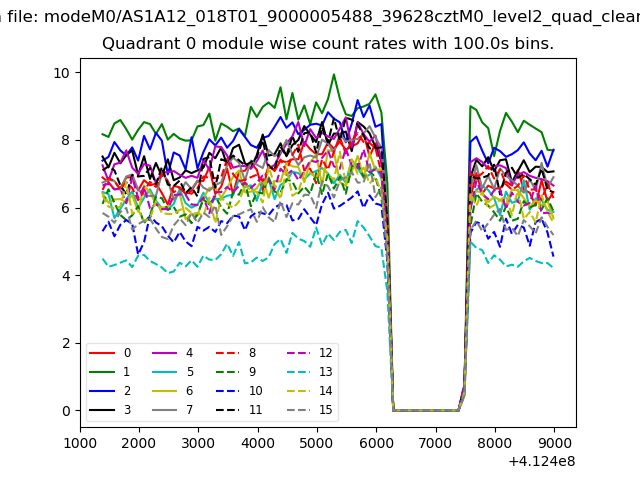 |
 |
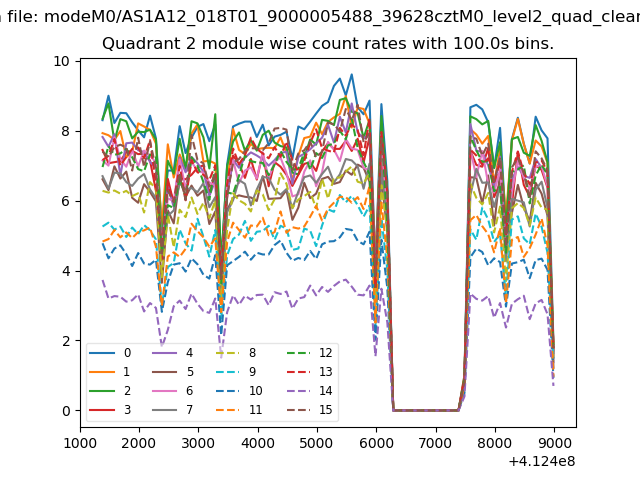
| Module-wise count rates for Quadrant B Data is divided into 100 sec bins |
 |
 |
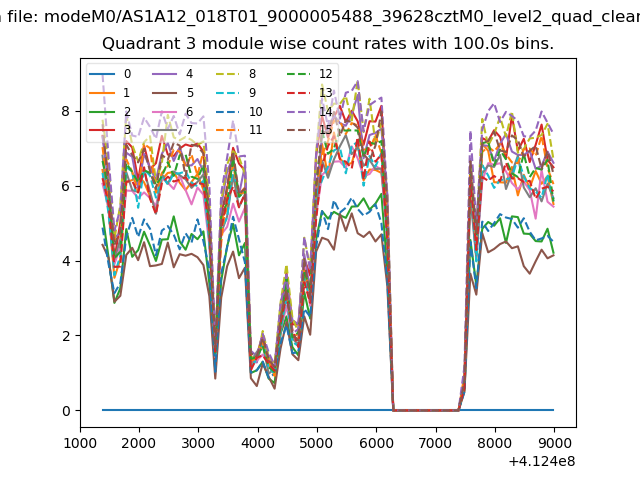
| Module-wise count rates for Quadrant C Data is divided into 100 sec bins |
 |
 |
| Module-wise count rates for Quadrant D Data is divided into 100 sec bins |
 |
 |
| Parameter | Plot |
|---|---|
| CZT HV Monitor | 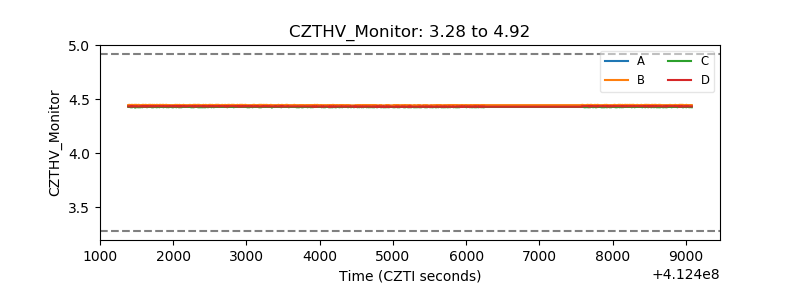 |
| D_VDD | 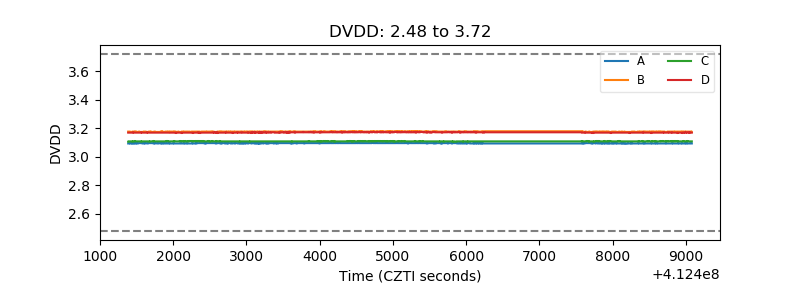 |
| Temperature 1 | 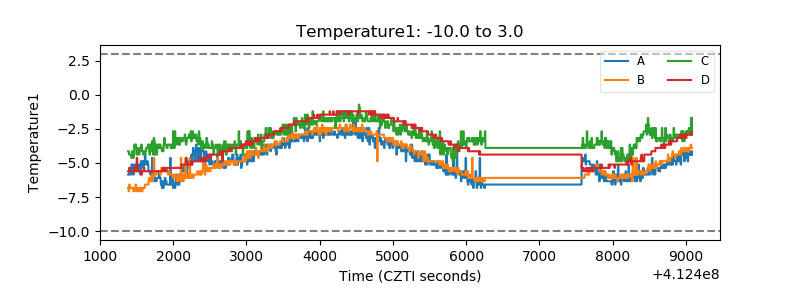 |
| Veto HV Monitor | 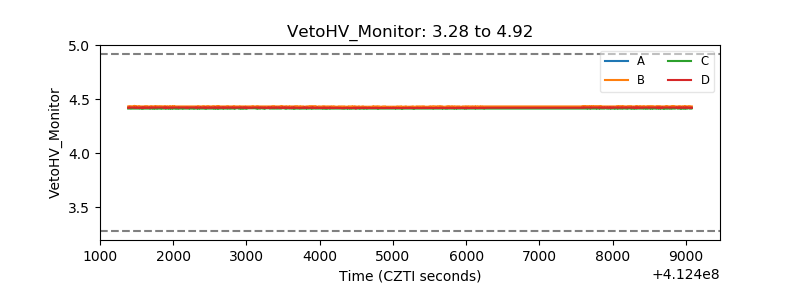 |
| Veto LLD | 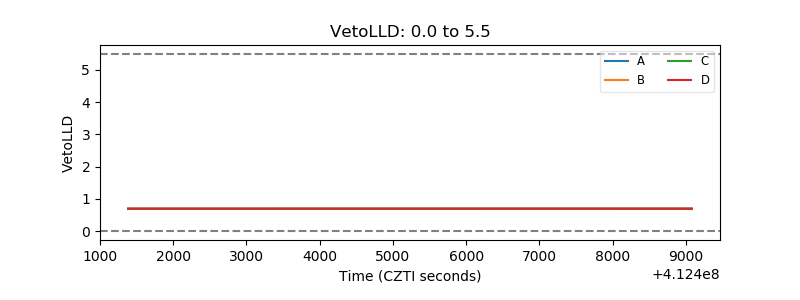 |
| Alpha Counter | 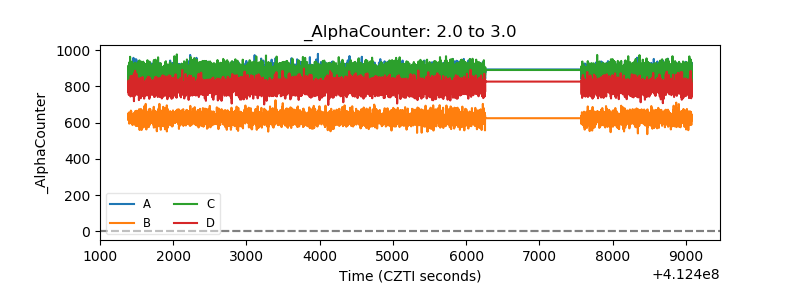 |
| _CPM_Rate | 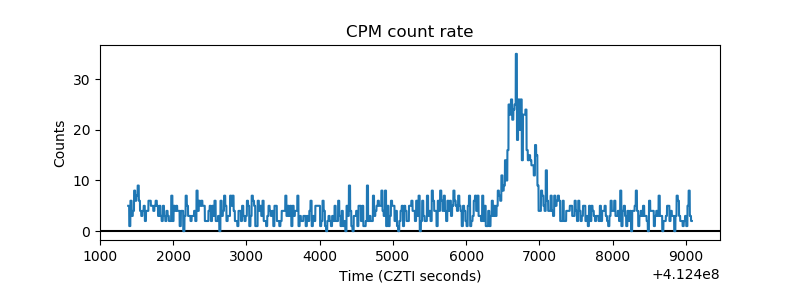 |
| CZT Counter | 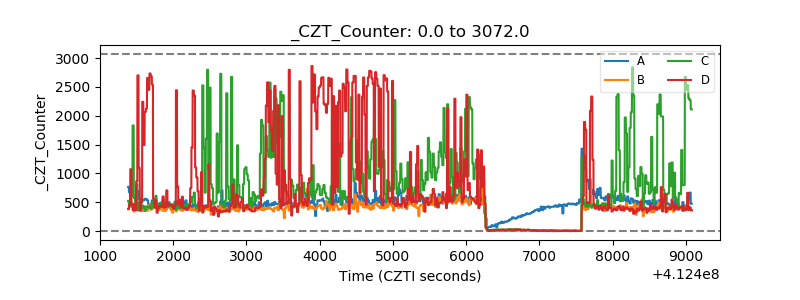 |
| +2.5 Volts monitor | 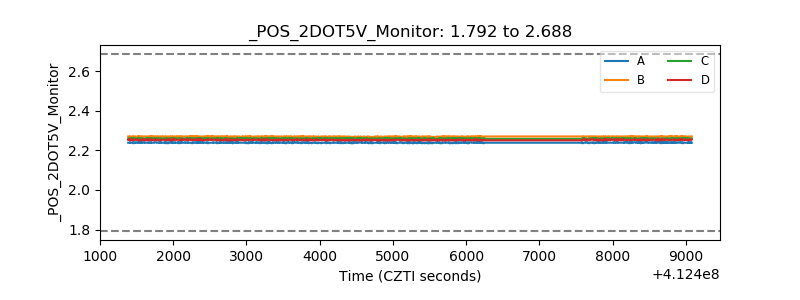 |
| +5 Volts monitor | 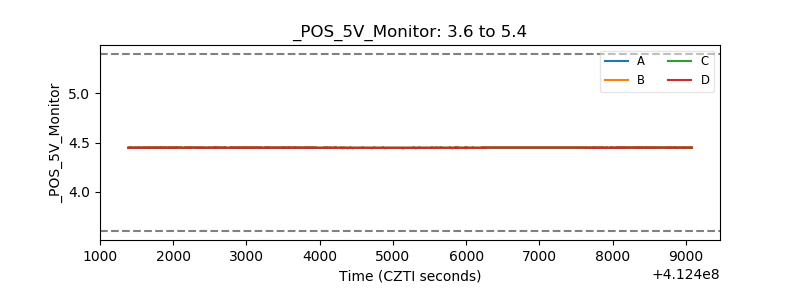 |
| _ROLL_ROT | 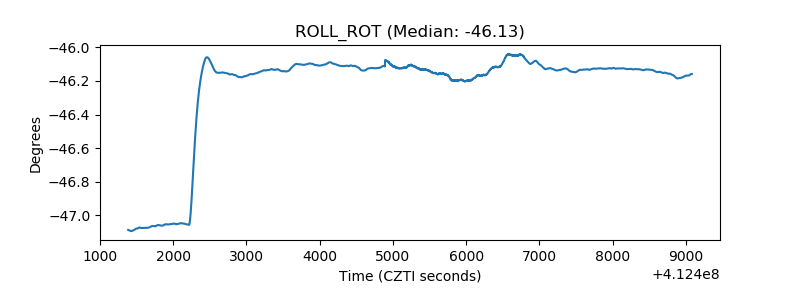 |
| _Roll_DEC | 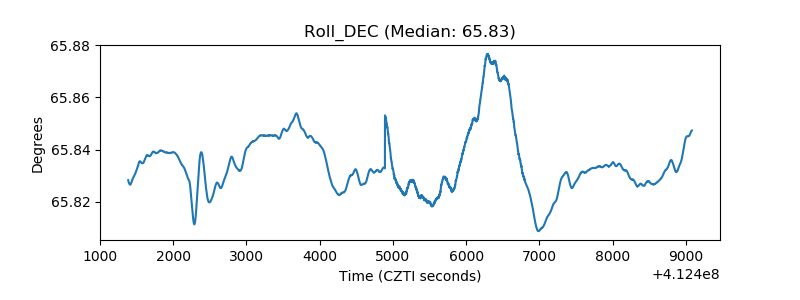 |
| _Roll_RA | 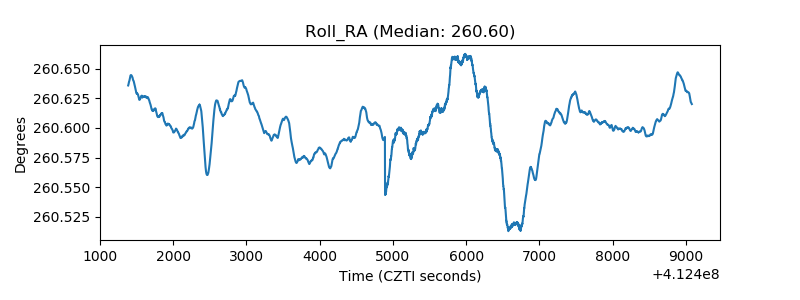 |
| Veto Counter | 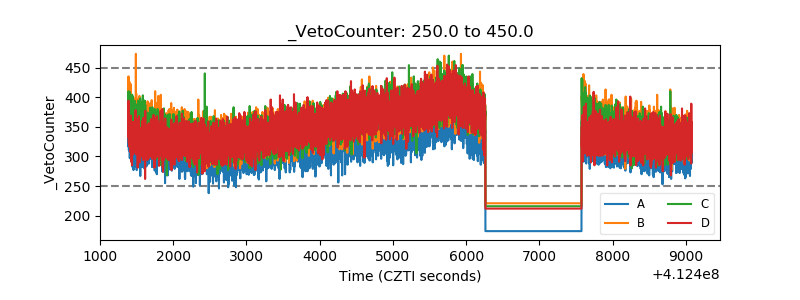 |