| Param | Original file | Final file |
|---|---|---|
| Filename | modeM0/AS1A12_018T01_9000005488_39629cztM0_level2.fits | modeM0/AS1A12_018T01_9000005488_39629cztM0_level2_quad_clean.evt |
| Size (bytes) | 804,366,720 | 146,344,320 |
| Size | 767.1 MB | 139.6 MB |
| Events in quadrant A | 4,982,753 | 1,051,638 |
| Events in quadrant B | 4,811,547 | 1,064,687 |
| Events in quadrant C | 11,600,154 | 799,248 |
| Events in quadrant D | 7,639,917 | 852,937 |
| Mode SS | |||
|---|---|---|---|
| Quadrant | BADHDUFLAG | Total packets | Discarded packets |
| A | 0 | 192 | 0 |
| B | 0 | 192 | 0 |
| C | 0 | 192 | 0 |
| D | 0 | 192 | 0 |
| Mode M0 | |||
|---|---|---|---|
| Quadrant | BADHDUFLAG | Total packets | Discarded packets |
| A | 0 | 20407 | 3 |
| B | 0 | 21212 | 2 |
| C | 0 | 40852 | 2 |
| D | 0 | 29259 | 2 |
| Mode M9 | |||
|---|---|---|---|
| Quadrant | BADHDUFLAG | Total packets | Discarded packets |
| A | 0 | 30 | 0 |
| B | 0 | 30 | 0 |
| C | 0 | 30 | 0 |
| D | 0 | 30 | 0 |
| Quadrant | Total seconds | Saturated seconds | Saturation percentage |
|---|---|---|---|
| A | 9558 | 15 | 0.156937% |
| B | 9558 | 186 | 1.946014% |
| C | 9558 | 2283 | 23.885750% |
| D | 9558 | 973 | 10.179954% |
Noise dominated data is calculated using 1-second bins in cleaned event files. If a bin has >2000 counts, and if more than 50% of those come from <1% of pixels, then it is considered to be noise-dominated and hence unusable.
| Quadrant | # 1 sec bins | Bins with >0 counts | Bins with >2000 counts | High rate bins dominated by noise | Noise dominated (total time) | Noise dominated (detector-on time) | Marked lightcurve |
|---|---|---|---|---|---|---|---|
| A | 12485 | 9560 | 7 | 7 | 0.06% | 0.07% | 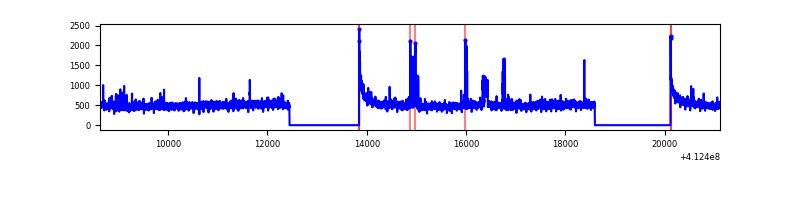 |
| B | 12485 | 9560 | 116 | 116 | 0.93% | 1.21% | 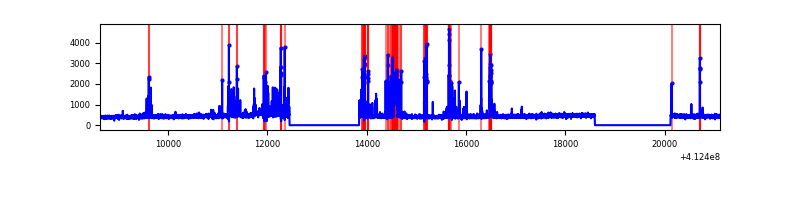 |
| C | 12485 | 9560 | 2047 | 2047 | 16.40% | 21.41% | 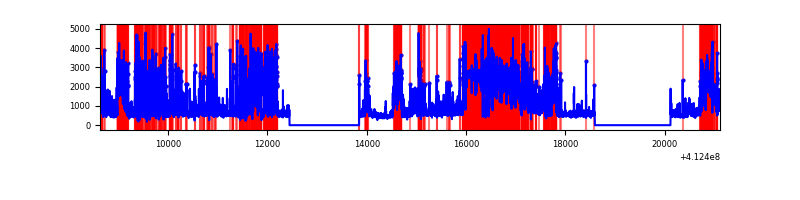 |
| D | 12485 | 9560 | 796 | 796 | 6.38% | 8.33% | 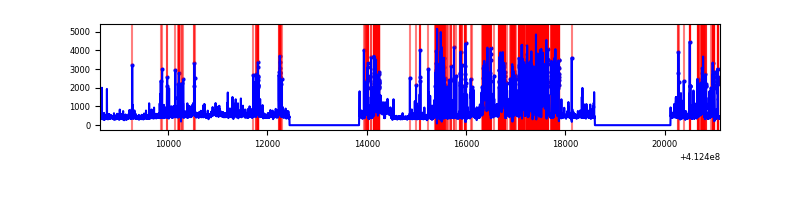 |
Top three noisy pixels from each quadrant. If the there are fewer than three noisy pixels in the level2.evt file, extra rows are filled as -1
| Pixel properties | Quadrant properties | ||||||
|---|---|---|---|---|---|---|---|
| Quadrant | DetID | PixID | Counts | Sigma | Mean | Median | Sigma |
| A | 10 | 83 | 649774 | 3094.11 | 1042 | 1022 | 209.7 |
| A | 15 | 222 | 219187 | 1040.5 | 1042 | 1022 | 209.7 |
| A | 6 | 10 | 70592 | 331.8 | 1042 | 1022 | 209.7 |
| B | 5 | 172 | 552221 | 2771.5 | 1026 | 995 | 198.9 |
| B | 5 | 255 | 221320 | 1107.77 | 1026 | 995 | 198.9 |
| B | 12 | 111 | 25010 | 120.74 | 1026 | 995 | 198.9 |
| C | 9 | 187 | 5668821 | 27340.34 | 899 | 903 | 207.3 |
| C | 15 | 208 | 1981744 | 9554.98 | 899 | 903 | 207.3 |
| C | 15 | 214 | 350867 | 1688.12 | 899 | 903 | 207.3 |
| D | 13 | 249 | 3137534 | 13276.73 | 967 | 939 | 236.2 |
| D | 1 | 52 | 374082 | 1579.46 | 967 | 939 | 236.2 |
| D | 2 | 249 | 165116 | 694.94 | 967 | 939 | 236.2 |
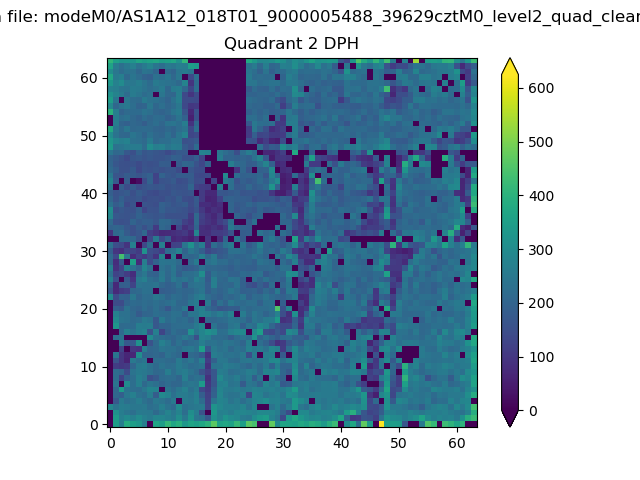
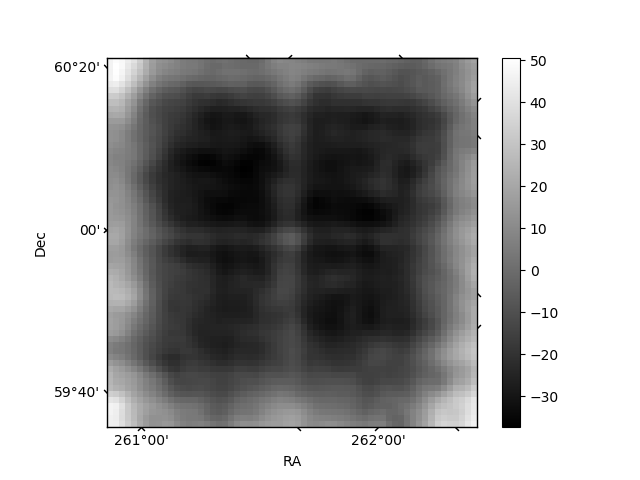
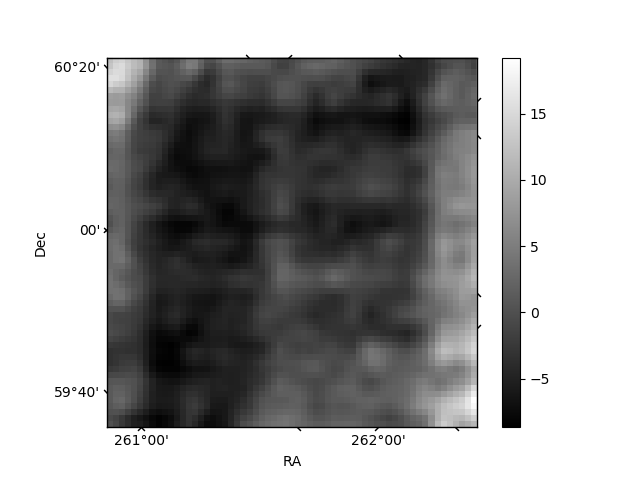
Histogram calculated using DETX and DETY for each event in the final _common_clean file
| Quadrant A | 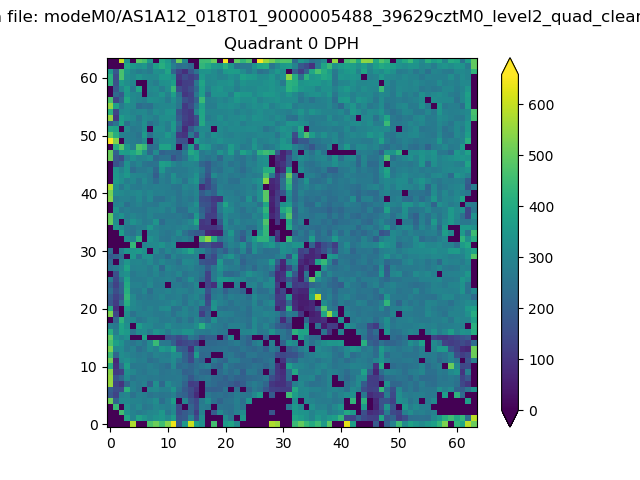 |
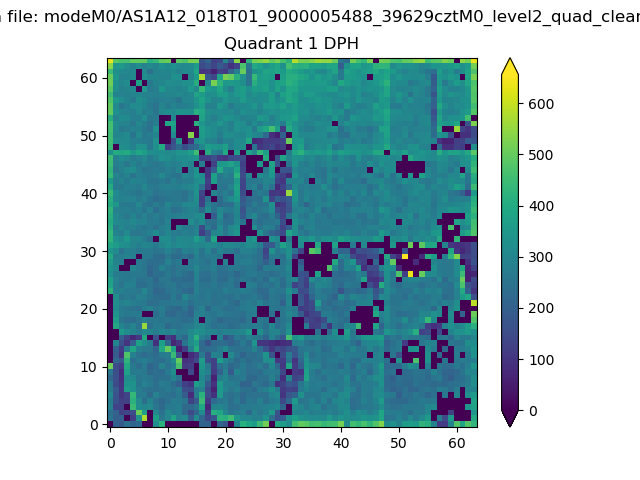 |
Quadrant B |
|---|---|---|---|
| Quadrant D | 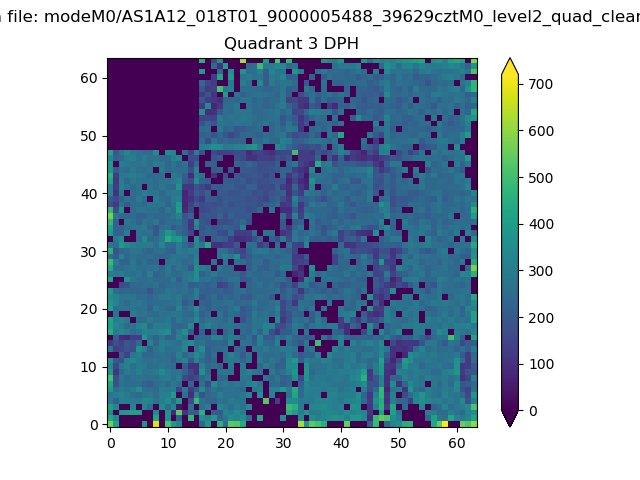 |
 |
Quadrant C |
| Plot type | Count rate plots | Images |
|---|---|---|
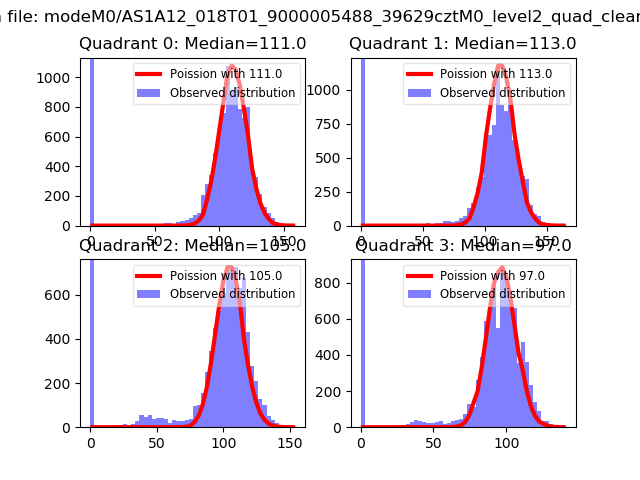
| Comparison with Poisson distribution Blue bars denote a histogram of data divided into 1 sec bins. Red curve is a Poisson curve with rate = median count rate of data. |
 |
 |
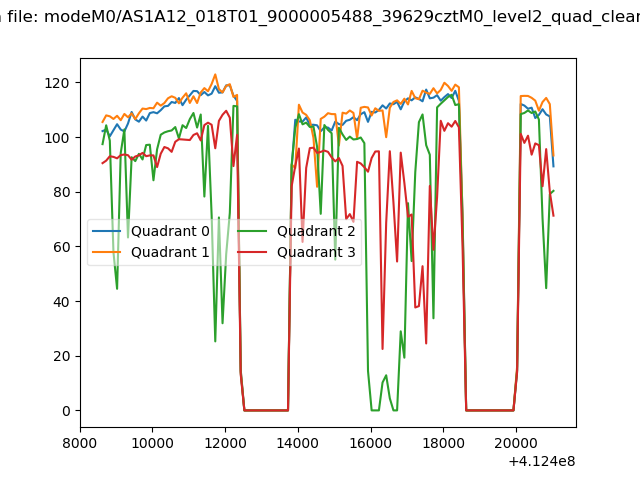
| Quadrant-wise count rates Data is divided into 100 sec bins |
 |
|
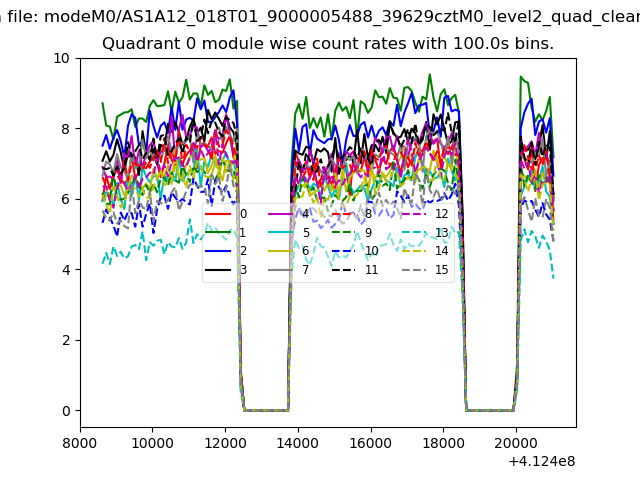
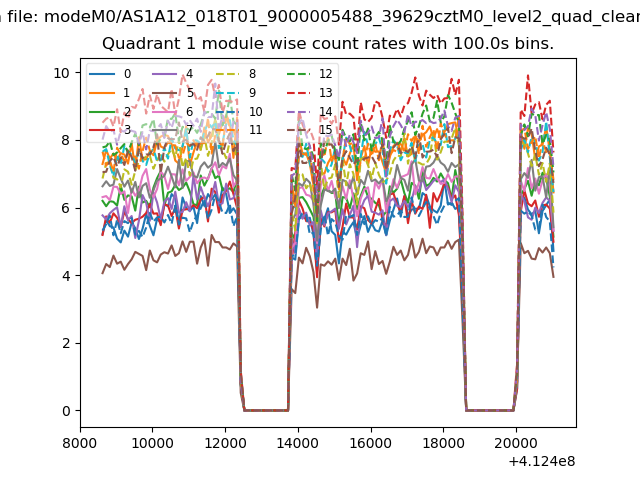
| Module-wise count rates for Quadrant A Data is divided into 100 sec bins |
 |
 |
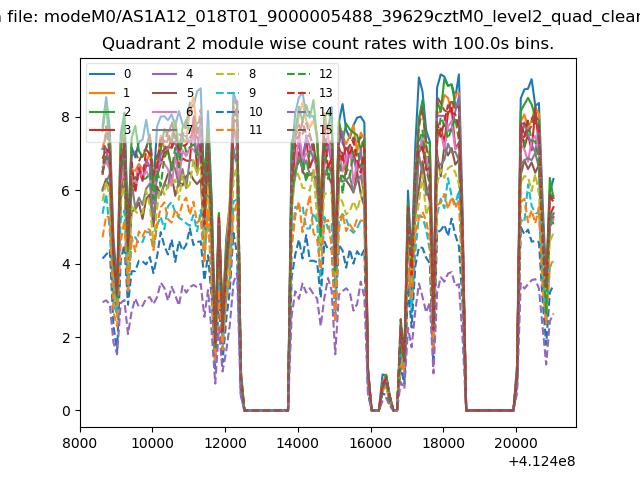
| Module-wise count rates for Quadrant B Data is divided into 100 sec bins |
 |
 |
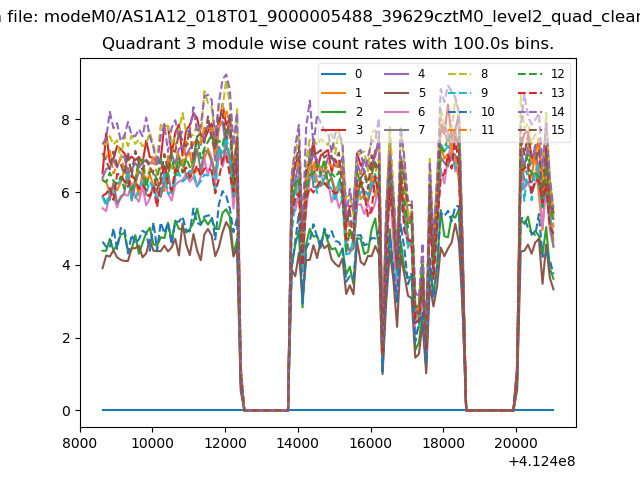
| Module-wise count rates for Quadrant C Data is divided into 100 sec bins |
 |
 |
| Module-wise count rates for Quadrant D Data is divided into 100 sec bins |
 |
 |
| Parameter | Plot |
|---|---|
| CZT HV Monitor | 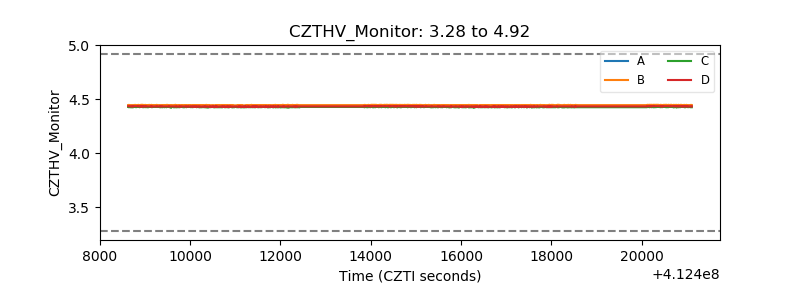 |
| D_VDD | 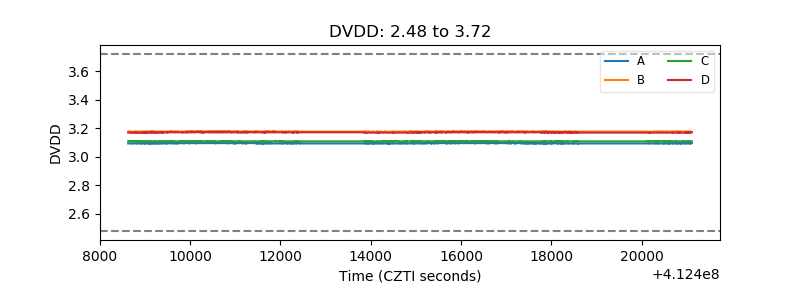 |
| Temperature 1 | 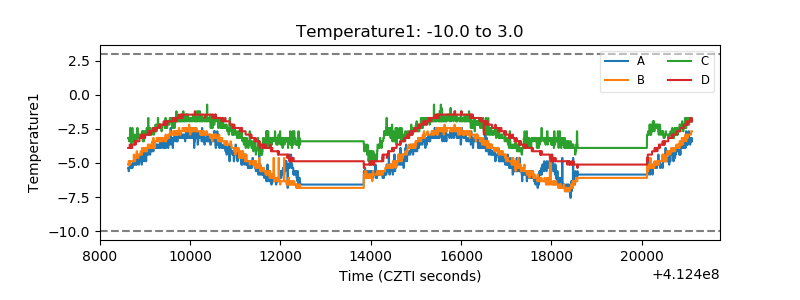 |
| Veto HV Monitor | 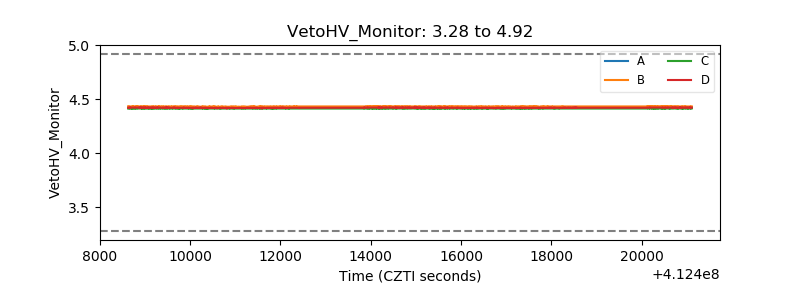 |
| Veto LLD |  |
| Alpha Counter | 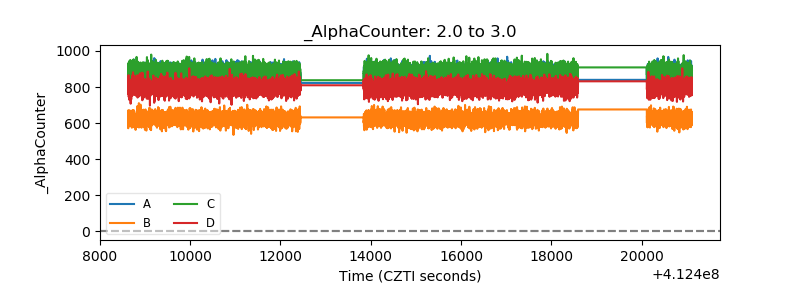 |
| _CPM_Rate | 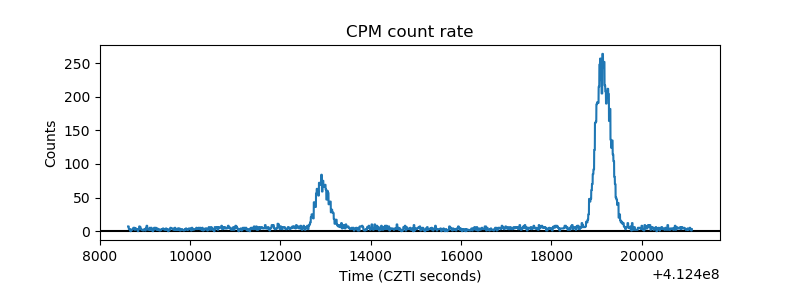 |
| CZT Counter | 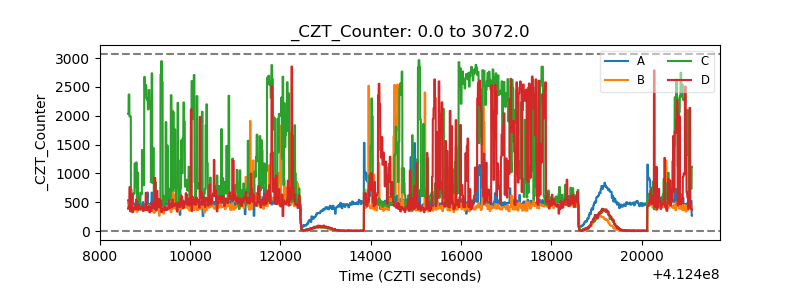 |
| +2.5 Volts monitor | 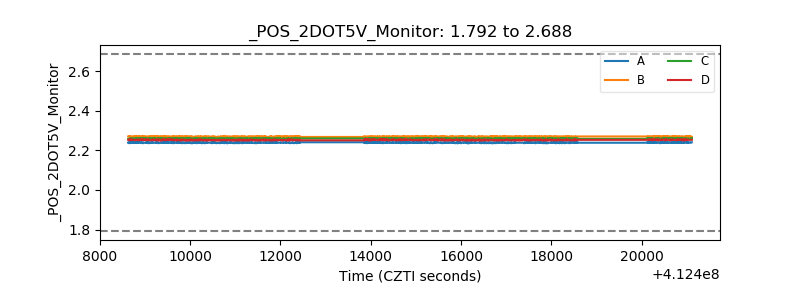 |
| +5 Volts monitor | 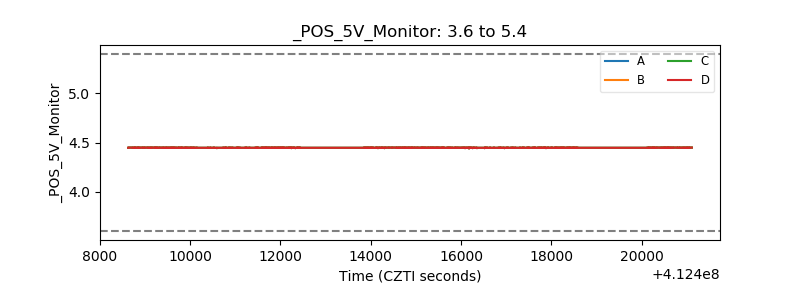 |
| _ROLL_ROT | 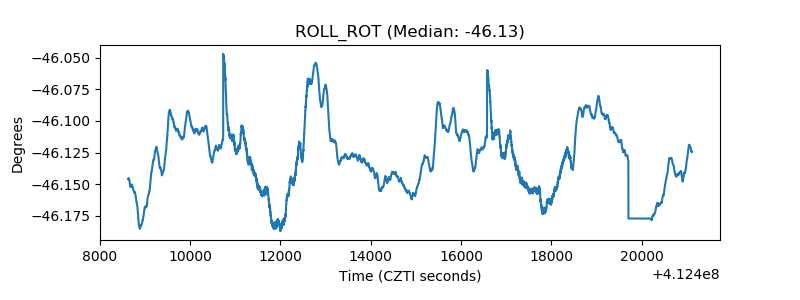 |
| _Roll_DEC | 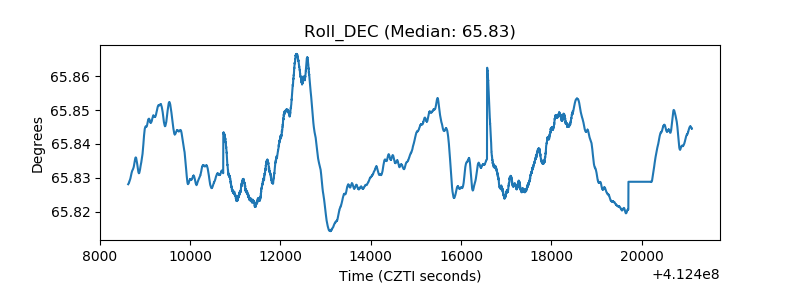 |
| _Roll_RA | 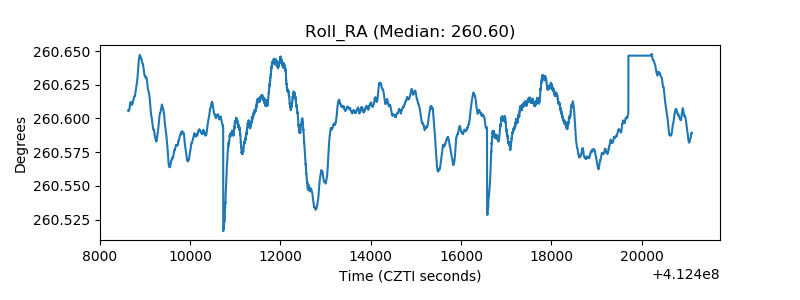 |
| Veto Counter | 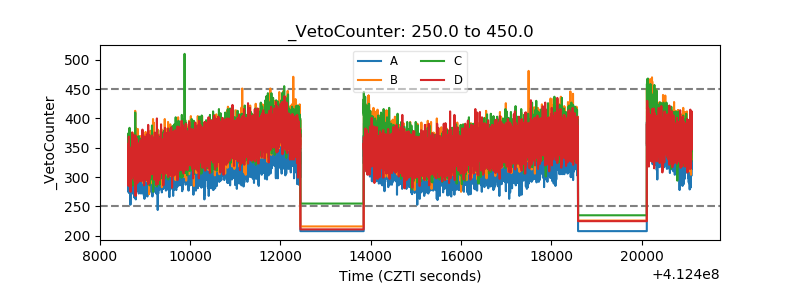 |