| Param | Original file | Final file |
|---|---|---|
| Filename | modeM0/AS1A12_018T01_9000005488_39630cztM0_level2.fits | modeM0/AS1A12_018T01_9000005488_39630cztM0_level2_quad_clean.evt |
| Size (bytes) | 440,421,120 | 85,564,800 |
| Size | 420.0 MB | 81.6 MB |
| Events in quadrant A | 2,856,885 | 606,223 |
| Events in quadrant B | 3,807,835 | 556,045 |
| Events in quadrant C | 5,726,025 | 524,292 |
| Events in quadrant D | 3,491,756 | 525,546 |
| Mode SS | |||
|---|---|---|---|
| Quadrant | BADHDUFLAG | Total packets | Discarded packets |
| A | 0 | 110 | 0 |
| B | 0 | 110 | 0 |
| C | 0 | 110 | 0 |
| D | 0 | 110 | 0 |
| Mode M0 | |||
|---|---|---|---|
| Quadrant | BADHDUFLAG | Total packets | Discarded packets |
| A | 0 | 11787 | 3 |
| B | 0 | 15061 | 2 |
| C | 0 | 20617 | 2 |
| D | 0 | 13958 | 2 |
| Mode M9 | |||
|---|---|---|---|
| Quadrant | BADHDUFLAG | Total packets | Discarded packets |
| A | 0 | 17 | 0 |
| B | 0 | 17 | 0 |
| C | 0 | 17 | 0 |
| D | 0 | 17 | 0 |
| Quadrant | Total seconds | Saturated seconds | Saturation percentage |
|---|---|---|---|
| A | 5407 | 23 | 0.425375% |
| B | 5407 | 592 | 10.948770% |
| C | 5407 | 697 | 12.890697% |
| D | 5407 | 212 | 3.920843% |
Noise dominated data is calculated using 1-second bins in cleaned event files. If a bin has >2000 counts, and if more than 50% of those come from <1% of pixels, then it is considered to be noise-dominated and hence unusable.
| Quadrant | # 1 sec bins | Bins with >0 counts | Bins with >2000 counts | High rate bins dominated by noise | Noise dominated (total time) | Noise dominated (detector-on time) | Marked lightcurve |
|---|---|---|---|---|---|---|---|
| A | 7080 | 5408 | 9 | 9 | 0.13% | 0.17% | 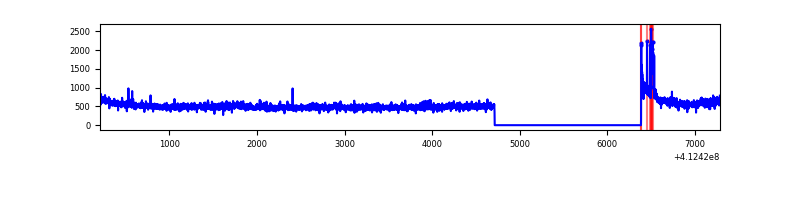 |
| B | 7080 | 5408 | 515 | 515 | 7.27% | 9.52% | 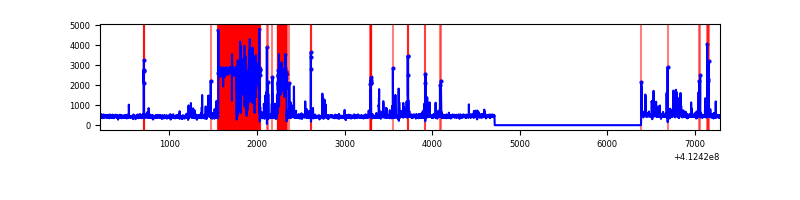 |
| C | 7080 | 5408 | 671 | 671 | 9.48% | 12.41% | 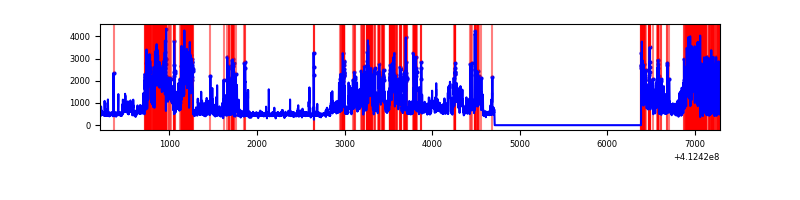 |
| D | 7080 | 5408 | 180 | 180 | 2.54% | 3.33% | 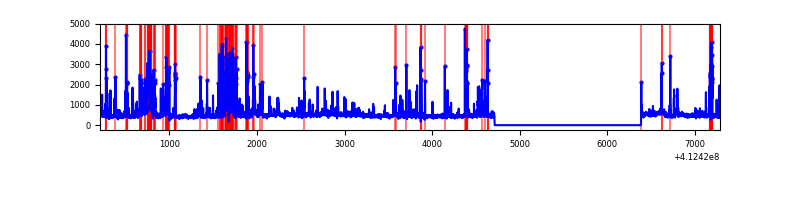 |
Top three noisy pixels from each quadrant. If the there are fewer than three noisy pixels in the level2.evt file, extra rows are filled as -1
| Pixel properties | Quadrant properties | ||||||
|---|---|---|---|---|---|---|---|
| Quadrant | DetID | PixID | Counts | Sigma | Mean | Median | Sigma |
| A | 10 | 83 | 402233 | 3320.42 | 592 | 579 | 121.0 |
| A | 15 | 222 | 142981 | 1177.22 | 592 | 579 | 121.0 |
| A | 6 | 10 | 11740 | 92.26 | 592 | 579 | 121.0 |
| B | 5 | 172 | 1505475 | 14307.35 | 548 | 532 | 105.2 |
| B | 5 | 255 | 132255 | 1252.28 | 548 | 532 | 105.2 |
| B | 12 | 111 | 13077 | 119.26 | 548 | 532 | 105.2 |
| C | 9 | 187 | 1942298 | 15128.58 | 551 | 555 | 128.3 |
| C | 15 | 208 | 1402432 | 10922.36 | 551 | 555 | 128.3 |
| C | 15 | 214 | 217704 | 1691.86 | 551 | 555 | 128.3 |
| D | 13 | 249 | 818352 | 5891.39 | 567 | 551 | 138.8 |
| D | 1 | 52 | 175032 | 1256.95 | 567 | 551 | 138.8 |
| D | 2 | 250 | 89142 | 638.2 | 567 | 551 | 138.8 |
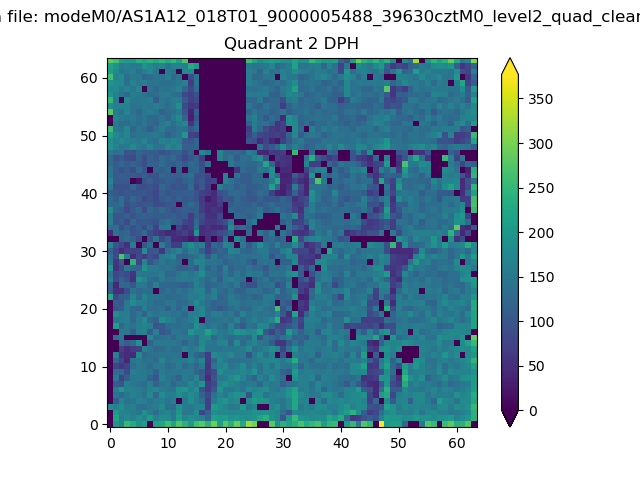
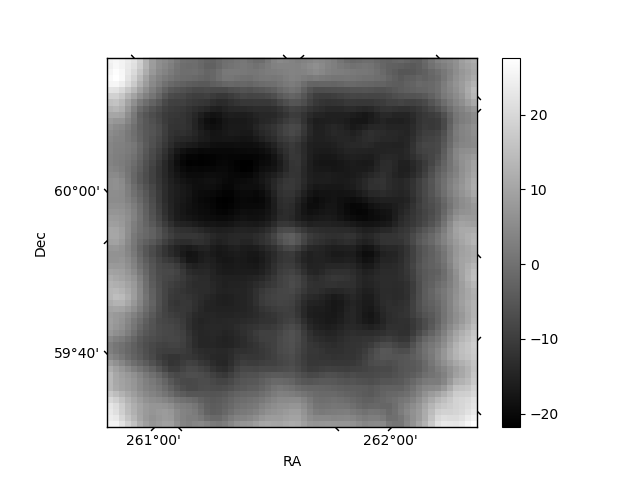
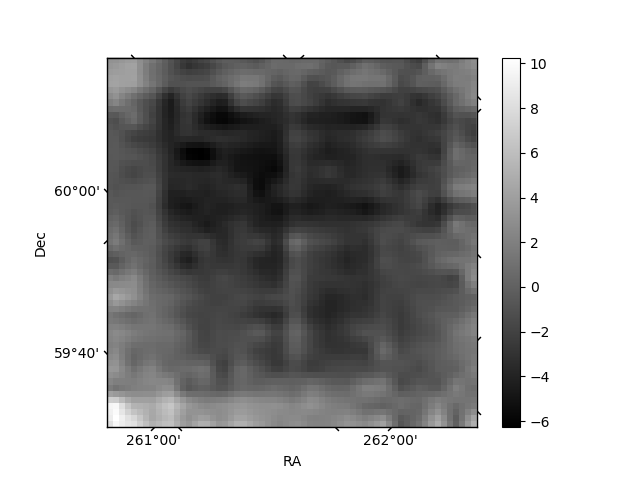
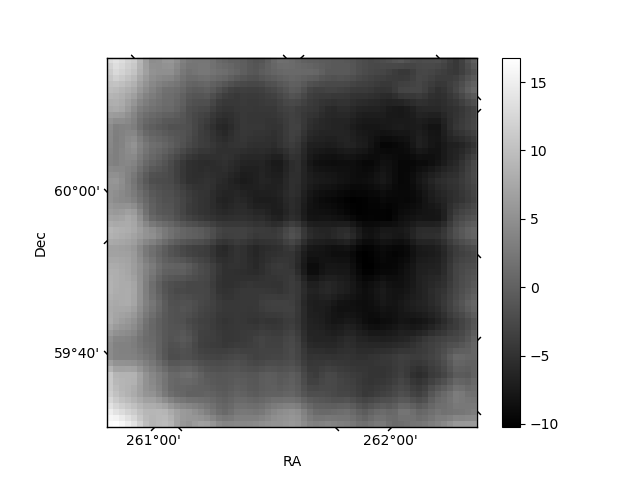
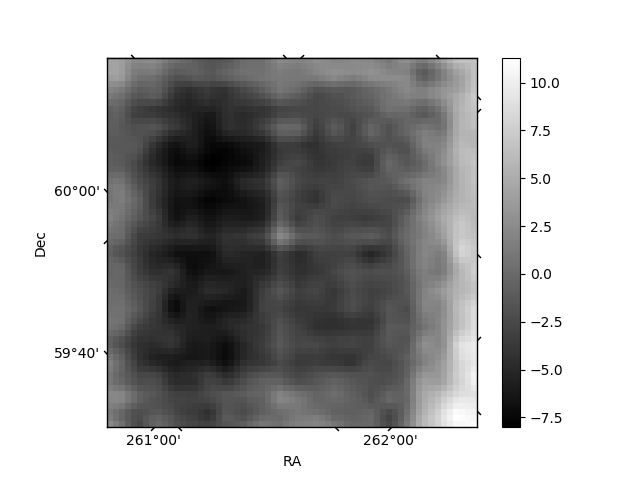
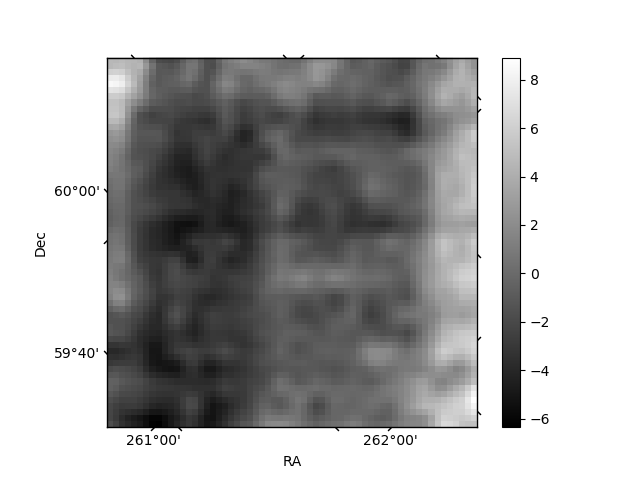
Histogram calculated using DETX and DETY for each event in the final _common_clean file
| Quadrant A | 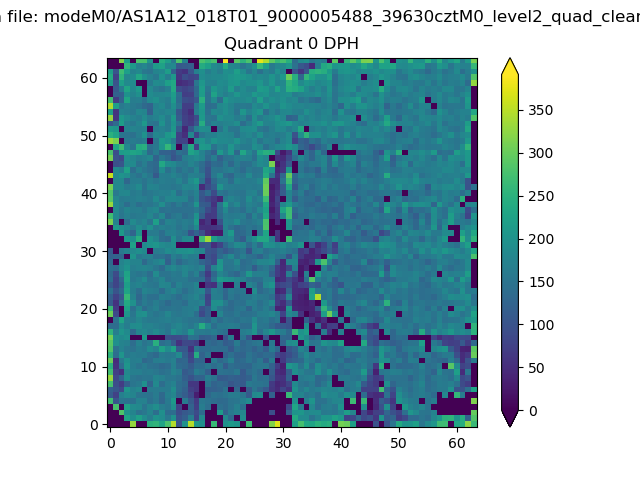 |
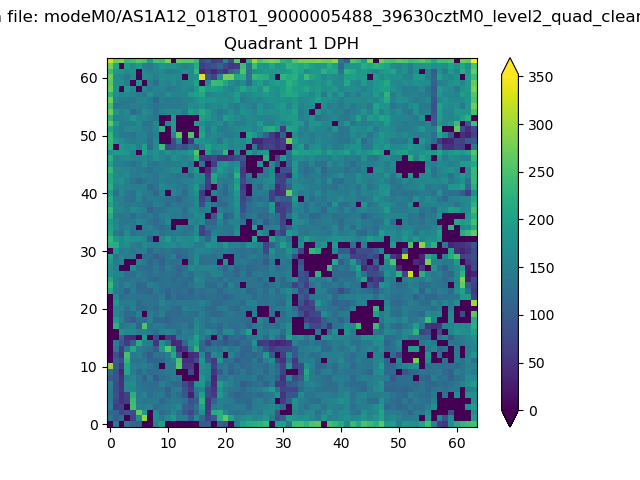 |
Quadrant B |
|---|---|---|---|
| Quadrant D | 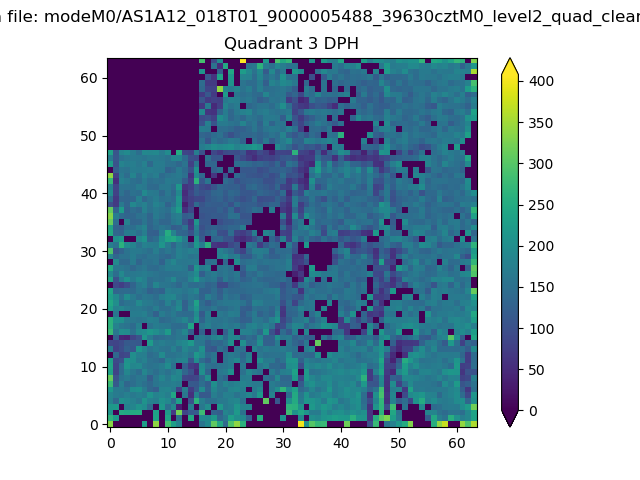 |
 |
Quadrant C |
| Plot type | Count rate plots | Images |
|---|---|---|
| Comparison with Poisson distribution Blue bars denote a histogram of data divided into 1 sec bins. Red curve is a Poisson curve with rate = median count rate of data. |
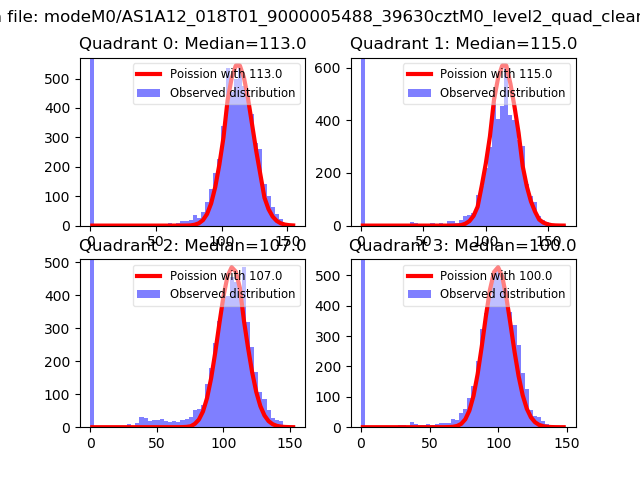 |
 |
| Quadrant-wise count rates Data is divided into 100 sec bins |
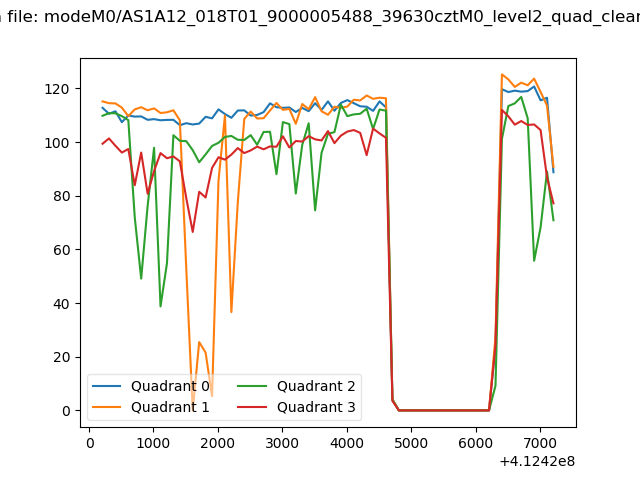 |
|
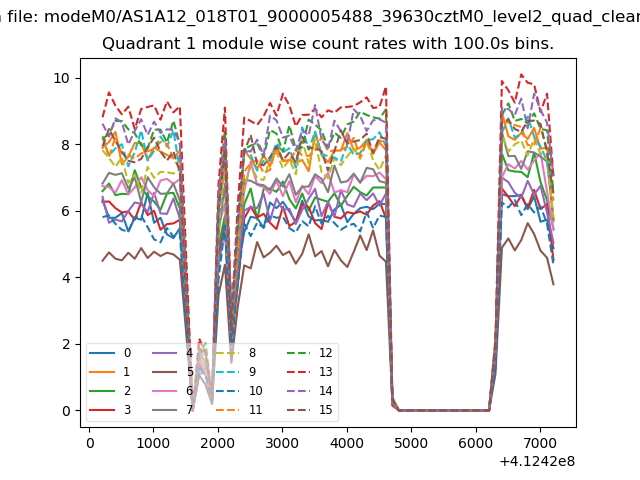
| Module-wise count rates for Quadrant A Data is divided into 100 sec bins |
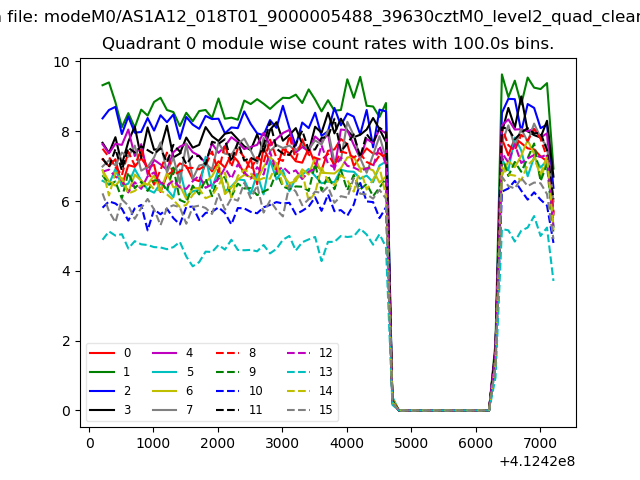 |
 |
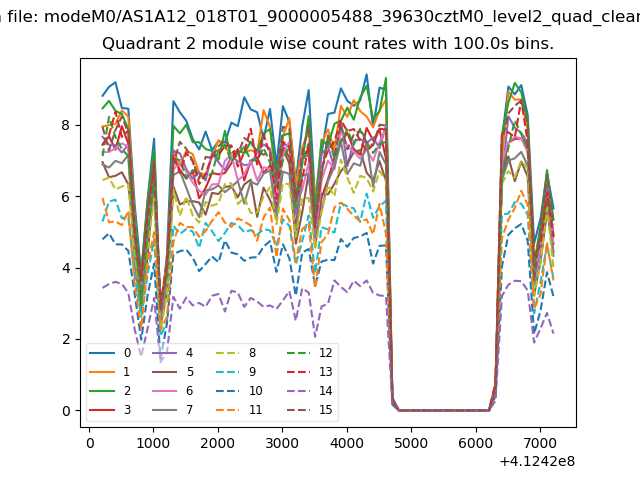
| Module-wise count rates for Quadrant B Data is divided into 100 sec bins |
 |
 |
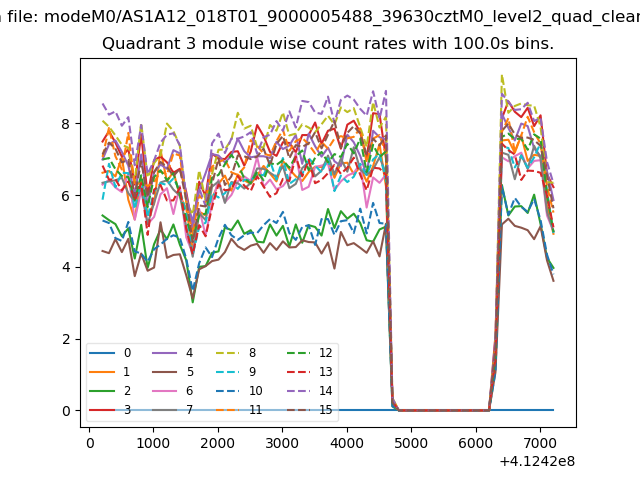
| Module-wise count rates for Quadrant C Data is divided into 100 sec bins |
 |
 |
| Module-wise count rates for Quadrant D Data is divided into 100 sec bins |
 |
 |
| Parameter | Plot |
|---|---|
| CZT HV Monitor | 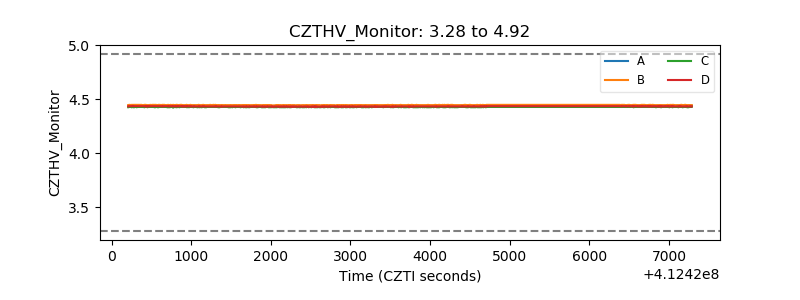 |
| D_VDD | 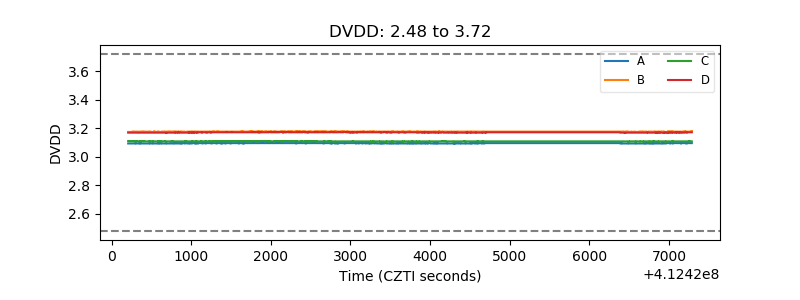 |
| Temperature 1 | 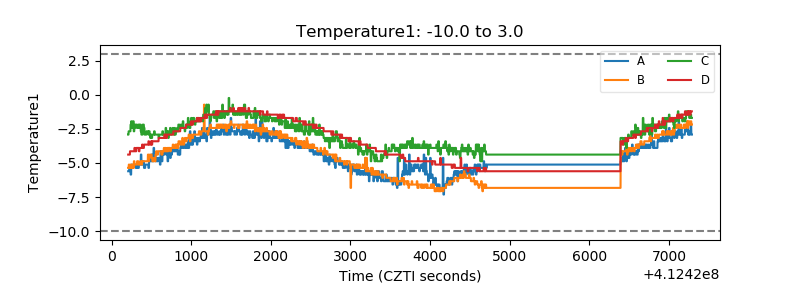 |
| Veto HV Monitor | 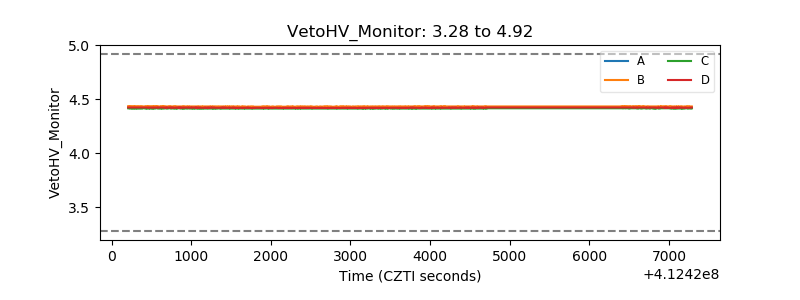 |
| Veto LLD | 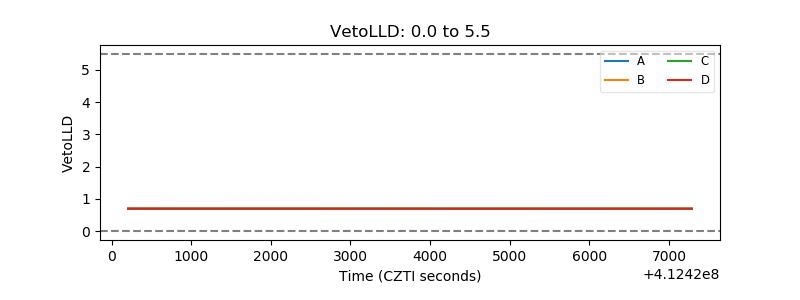 |
| Alpha Counter | 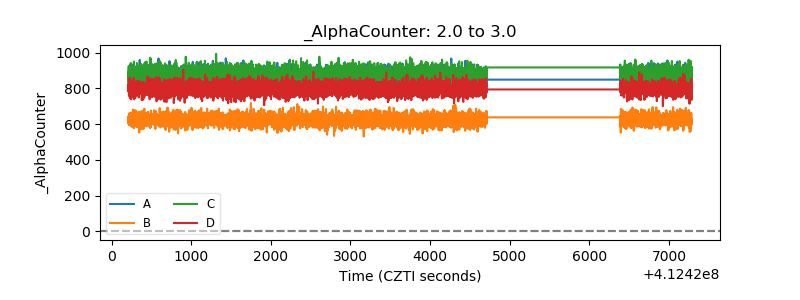 |
| _CPM_Rate | 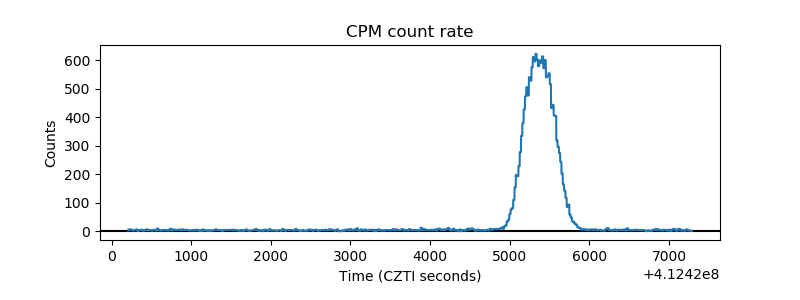 |
| CZT Counter | 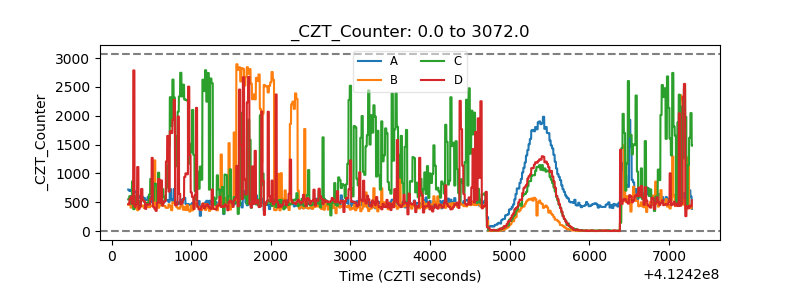 |
| +2.5 Volts monitor | 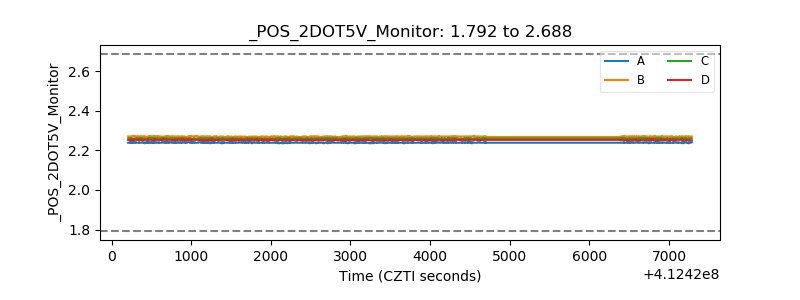 |
| +5 Volts monitor | 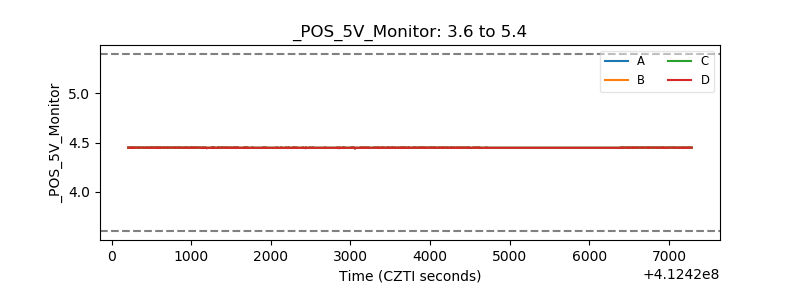 |
| _ROLL_ROT | 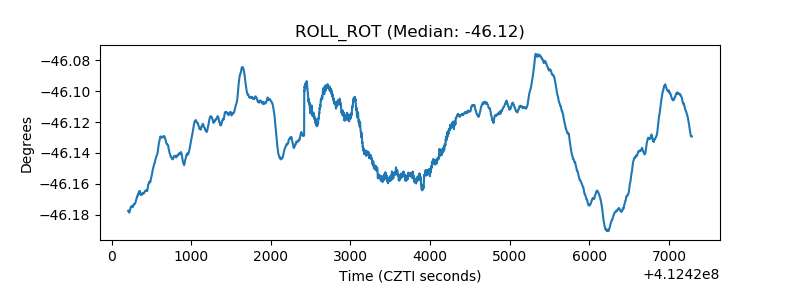 |
| _Roll_DEC | 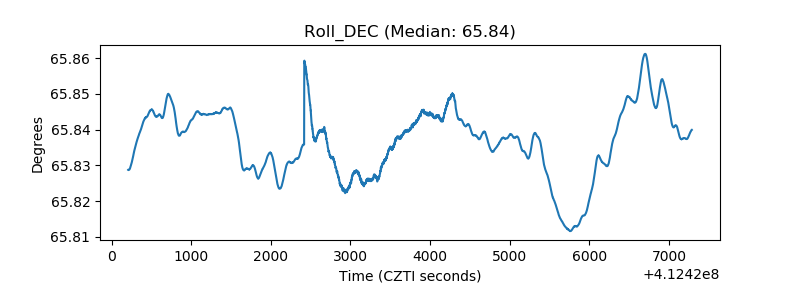 |
| _Roll_RA | 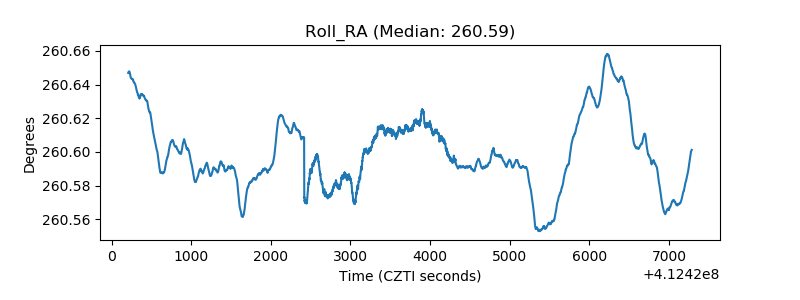 |
| Veto Counter | 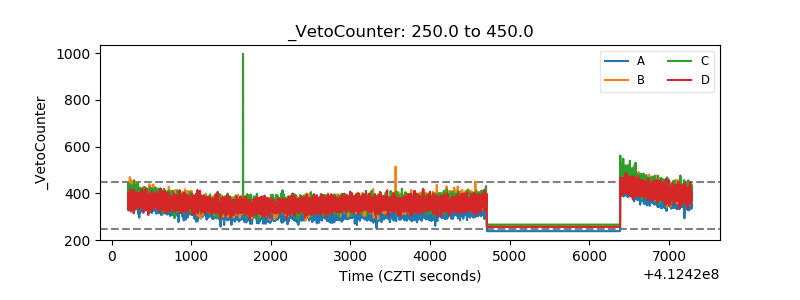 |