| Param | Original file | Final file |
|---|---|---|
| Filename | modeM0/AS1A12_018T01_9000005488_39632cztM0_level2.fits | modeM0/AS1A12_018T01_9000005488_39632cztM0_level2_quad_clean.evt |
| Size (bytes) | 456,085,440 | 90,308,160 |
| Size | 435.0 MB | 86.1 MB |
| Events in quadrant A | 4,098,024 | 626,360 |
| Events in quadrant B | 2,571,365 | 641,695 |
| Events in quadrant C | 5,720,828 | 555,060 |
| Events in quadrant D | 4,075,414 | 534,688 |
| Mode SS | |||
|---|---|---|---|
| Quadrant | BADHDUFLAG | Total packets | Discarded packets |
| A | 0 | 110 | 0 |
| B | 0 | 110 | 0 |
| C | 0 | 110 | 0 |
| D | 0 | 110 | 0 |
| Mode M0 | |||
|---|---|---|---|
| Quadrant | BADHDUFLAG | Total packets | Discarded packets |
| A | 0 | 15660 | 3 |
| B | 0 | 11329 | 2 |
| C | 0 | 20594 | 2 |
| D | 0 | 15727 | 2 |
| Mode M9 | |||
|---|---|---|---|
| Quadrant | BADHDUFLAG | Total packets | Discarded packets |
| A | 0 | 20 | 0 |
| B | 0 | 20 | 0 |
| C | 0 | 20 | 0 |
| D | 0 | 21 | 0 |
| Quadrant | Total seconds | Saturated seconds | Saturation percentage |
|---|---|---|---|
| A | 5375 | 114 | 2.120930% |
| B | 5375 | 27 | 0.502326% |
| C | 5375 | 650 | 12.093023% |
| D | 5375 | 385 | 7.162791% |
Noise dominated data is calculated using 1-second bins in cleaned event files. If a bin has >2000 counts, and if more than 50% of those come from <1% of pixels, then it is considered to be noise-dominated and hence unusable.
| Quadrant | # 1 sec bins | Bins with >0 counts | Bins with >2000 counts | High rate bins dominated by noise | Noise dominated (total time) | Noise dominated (detector-on time) | Marked lightcurve |
|---|---|---|---|---|---|---|---|
| A | 7170 | 5376 | 64 | 64 | 0.89% | 1.19% | 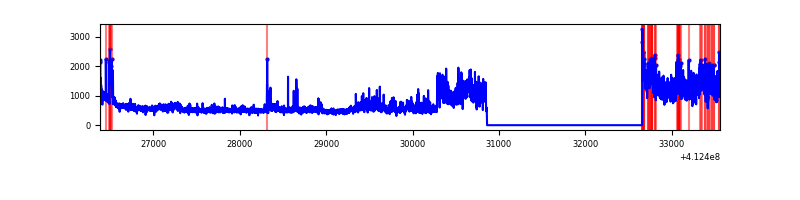 |
| B | 7170 | 5376 | 11 | 11 | 0.15% | 0.20% | 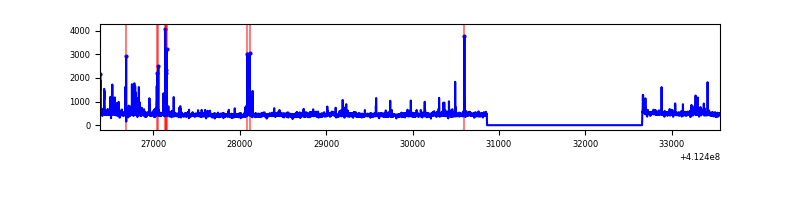 |
| C | 7170 | 5376 | 593 | 593 | 8.27% | 11.03% | 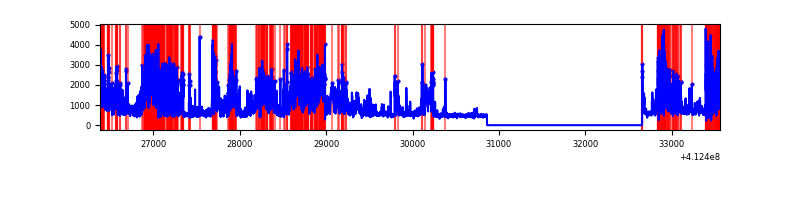 |
| D | 7170 | 5375 | 321 | 321 | 4.48% | 5.97% | 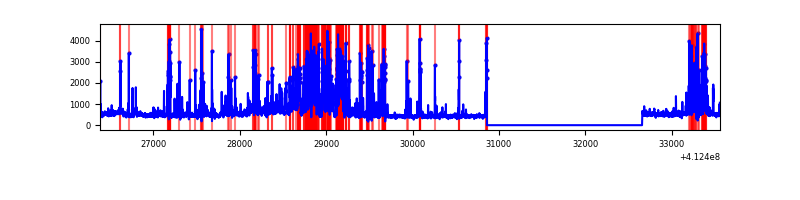 |
Top three noisy pixels from each quadrant. If the there are fewer than three noisy pixels in the level2.evt file, extra rows are filled as -1
| Pixel properties | Quadrant properties | ||||||
|---|---|---|---|---|---|---|---|
| Quadrant | DetID | PixID | Counts | Sigma | Mean | Median | Sigma |
| A | 15 | 222 | 1304049 | 10766.88 | 599 | 586 | 121.1 |
| A | 10 | 83 | 444249 | 3664.75 | 599 | 586 | 121.1 |
| A | 15 | 174 | 28131 | 227.52 | 599 | 586 | 121.1 |
| B | 5 | 255 | 140388 | 1225.19 | 594 | 577 | 114.1 |
| B | 5 | 172 | 78890 | 686.27 | 594 | 577 | 114.1 |
| B | 0 | 230 | 22087 | 188.5 | 594 | 577 | 114.1 |
| C | 15 | 208 | 1672413 | 12790.21 | 563 | 567 | 130.7 |
| C | 9 | 187 | 1613779 | 12341.64 | 563 | 567 | 130.7 |
| C | 15 | 214 | 218691 | 1668.72 | 563 | 567 | 130.7 |
| D | 13 | 249 | 1491869 | 10704.74 | 572 | 557 | 139.3 |
| D | 1 | 52 | 170497 | 1219.84 | 572 | 557 | 139.3 |
| D | 12 | 233 | 113079 | 807.69 | 572 | 557 | 139.3 |
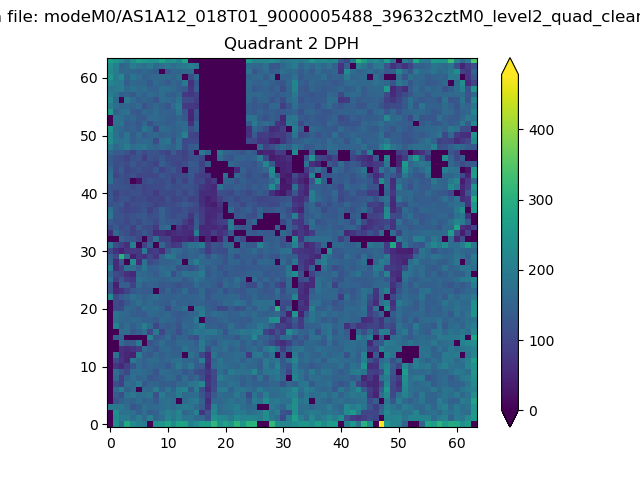
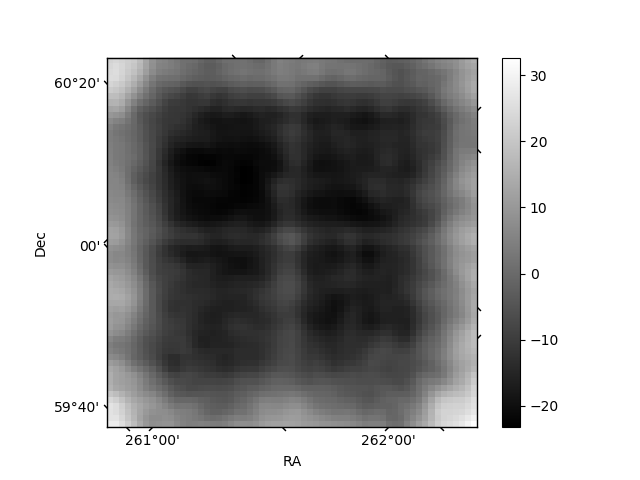
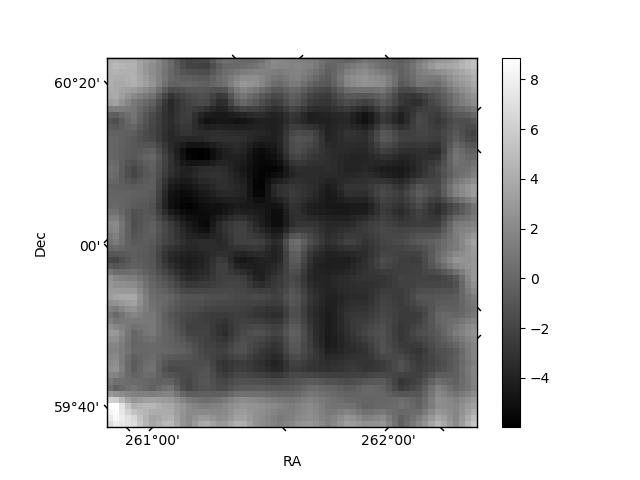
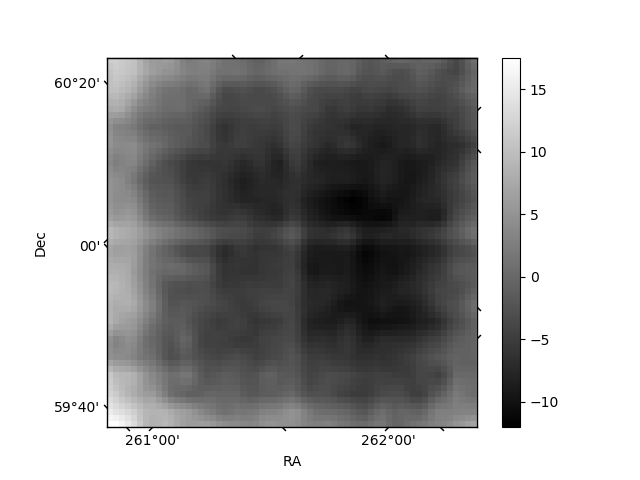
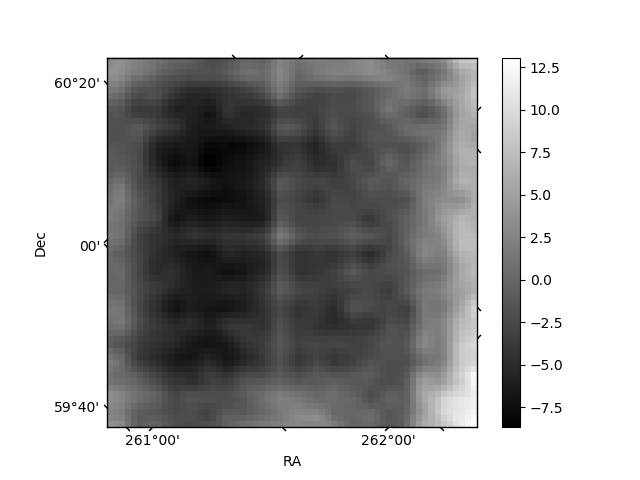
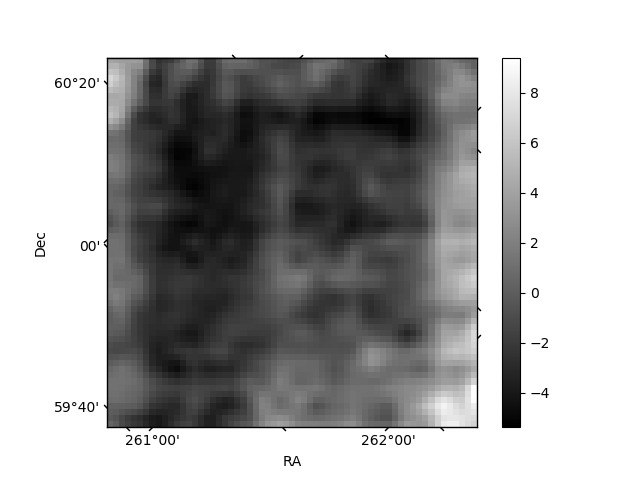
Histogram calculated using DETX and DETY for each event in the final _common_clean file
| Quadrant A | 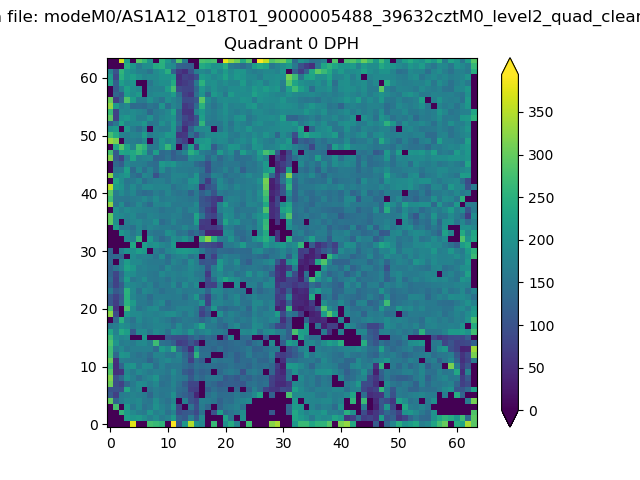 |
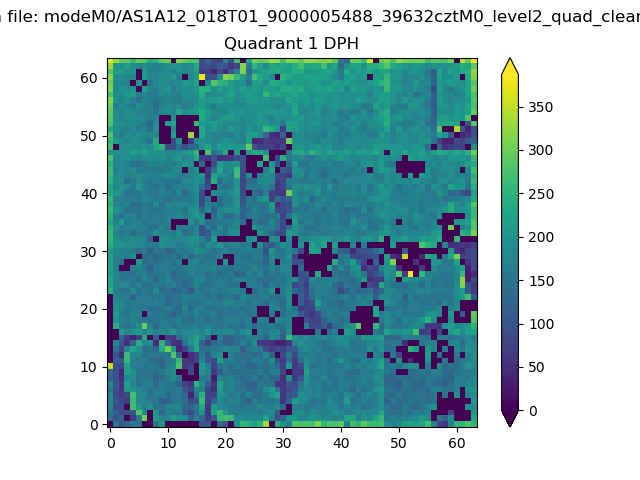 |
Quadrant B |
|---|---|---|---|
| Quadrant D | 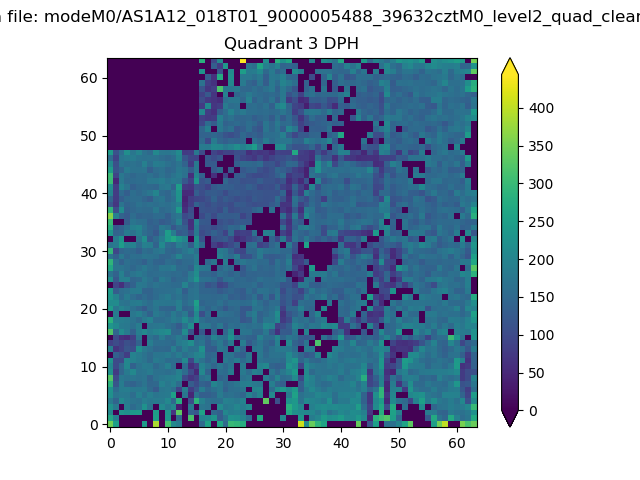 |
 |
Quadrant C |
| Plot type | Count rate plots | Images |
|---|---|---|
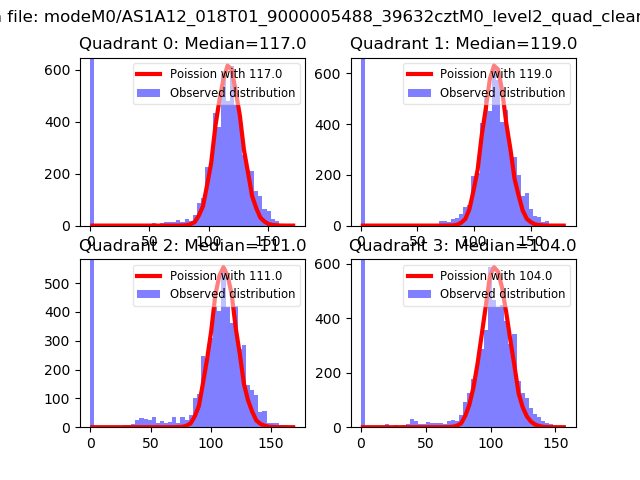
| Comparison with Poisson distribution Blue bars denote a histogram of data divided into 1 sec bins. Red curve is a Poisson curve with rate = median count rate of data. |
 |
 |
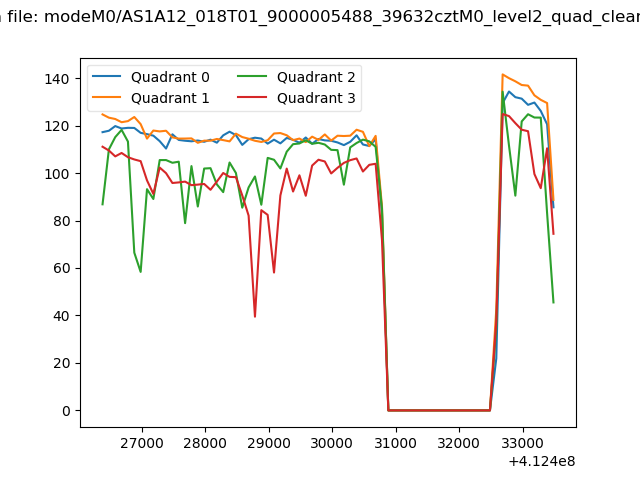
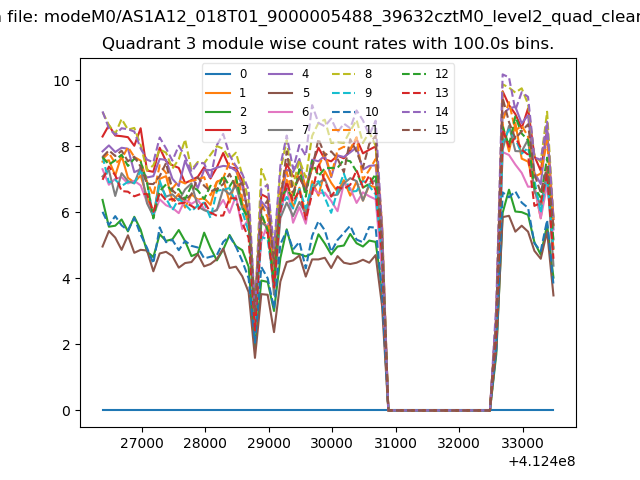
| Quadrant-wise count rates Data is divided into 100 sec bins |
 |
|
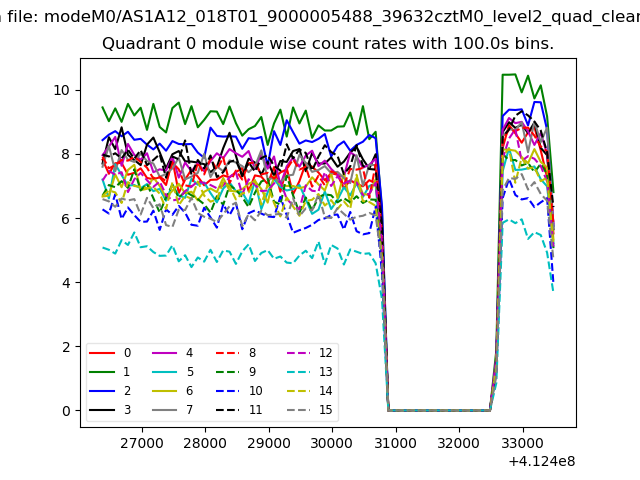
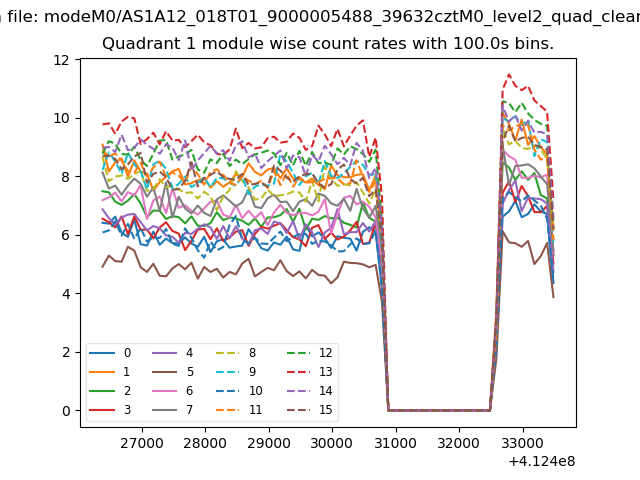
| Module-wise count rates for Quadrant A Data is divided into 100 sec bins |
 |
 |
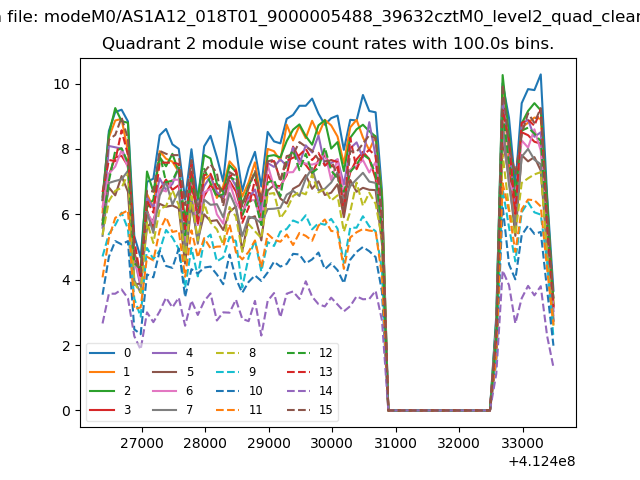
| Module-wise count rates for Quadrant B Data is divided into 100 sec bins |
 |
 |
| Module-wise count rates for Quadrant C Data is divided into 100 sec bins |
 |
 |
| Module-wise count rates for Quadrant D Data is divided into 100 sec bins |
 |
 |
| Parameter | Plot |
|---|---|
| CZT HV Monitor | 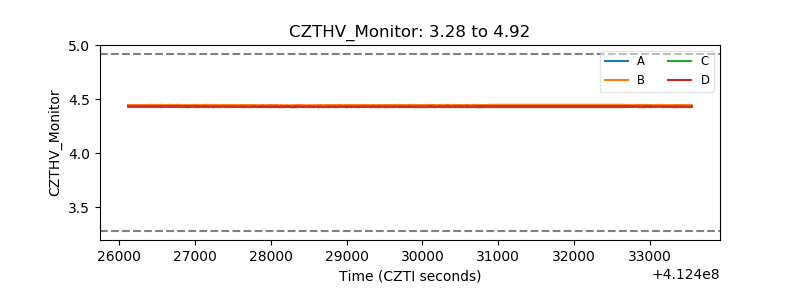 |
| D_VDD | 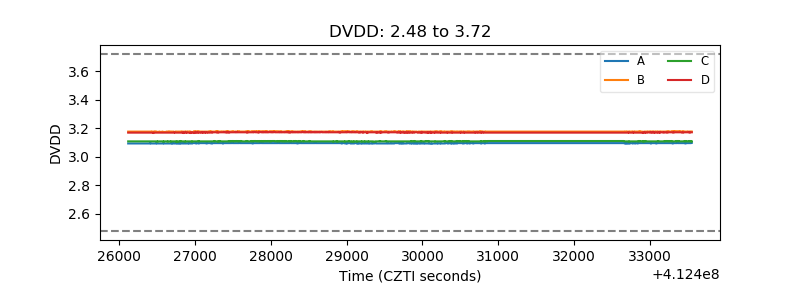 |
| Temperature 1 | 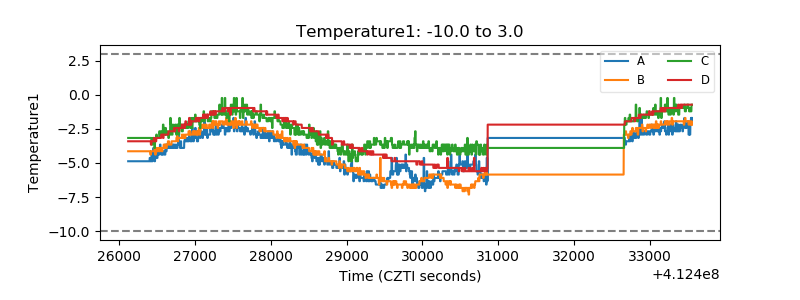 |
| Veto HV Monitor | 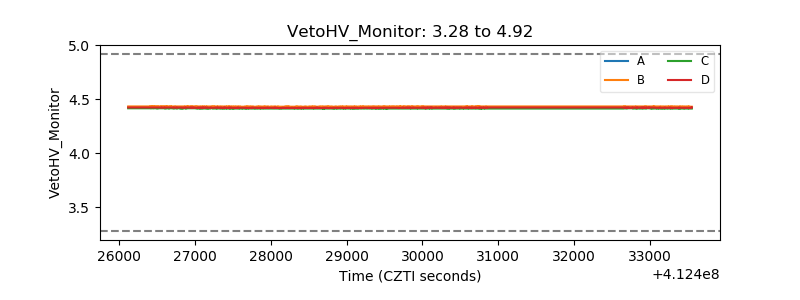 |
| Veto LLD | 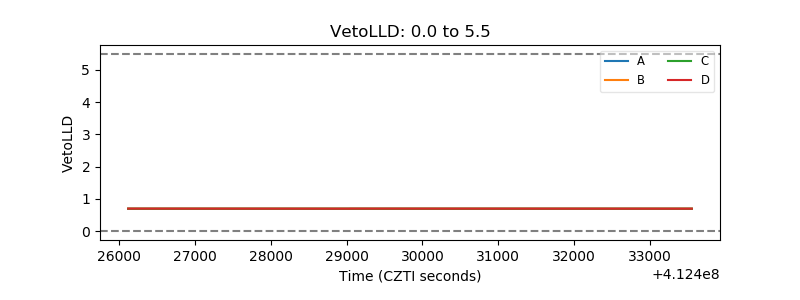 |
| Alpha Counter | 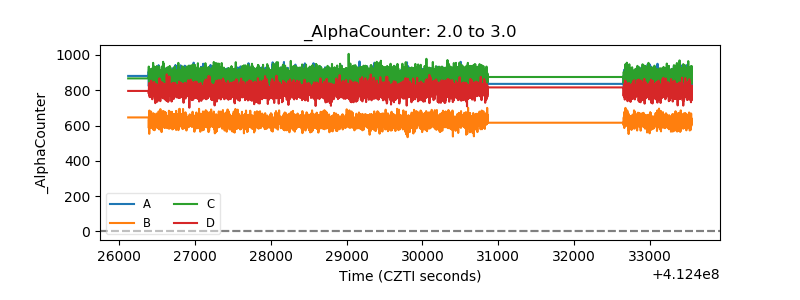 |
| _CPM_Rate | 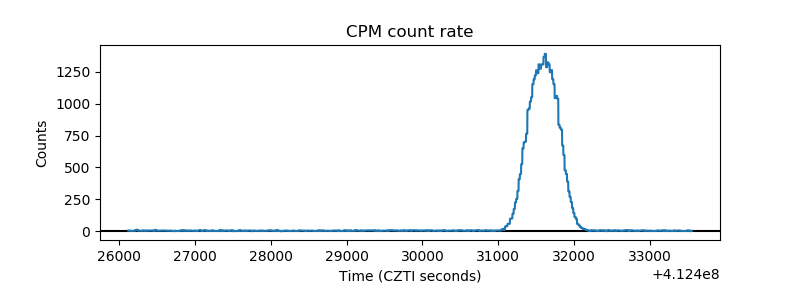 |
| CZT Counter | 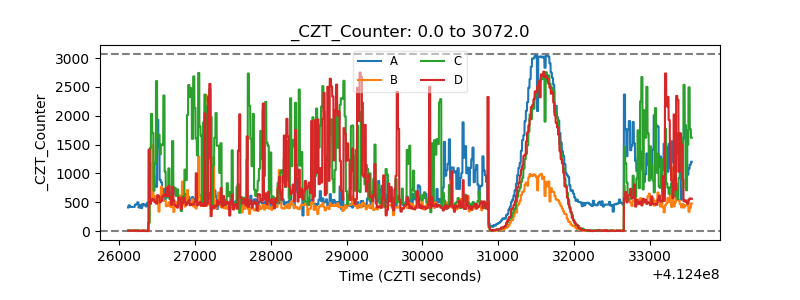 |
| +2.5 Volts monitor |  |
| +5 Volts monitor | 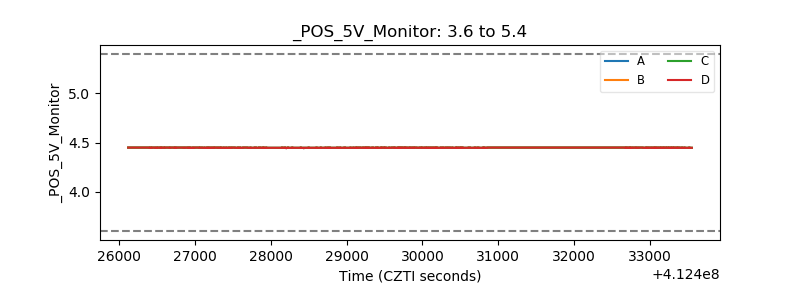 |
| _ROLL_ROT | 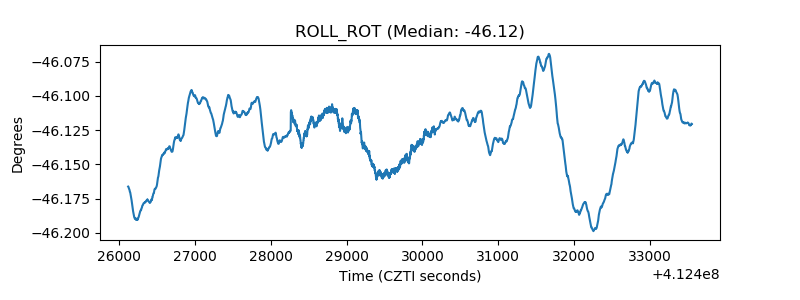 |
| _Roll_DEC | 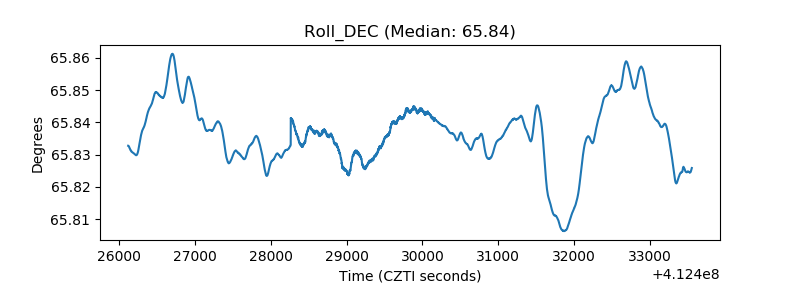 |
| _Roll_RA | 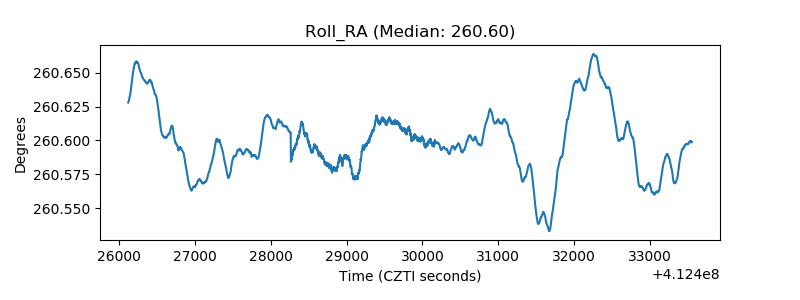 |
| Veto Counter | 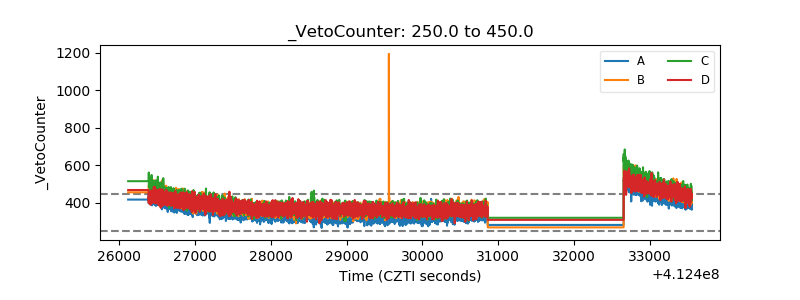 |