| Param | Original file | Final file |
|---|---|---|
| Filename | modeM0/AS1A12_018T01_9000005488_39633cztM0_level2.fits | modeM0/AS1A12_018T01_9000005488_39633cztM0_level2_quad_clean.evt |
| Size (bytes) | 512,259,840 | 94,184,640 |
| Size | 488.5 MB | 89.8 MB |
| Events in quadrant A | 6,690,600 | 650,887 |
| Events in quadrant B | 2,602,339 | 670,199 |
| Events in quadrant C | 5,675,768 | 575,875 |
| Events in quadrant D | 3,582,362 | 583,135 |
| Mode SS | |||
|---|---|---|---|
| Quadrant | BADHDUFLAG | Total packets | Discarded packets |
| A | 0 | 108 | 0 |
| B | 0 | 108 | 0 |
| C | 0 | 108 | 0 |
| D | 0 | 108 | 0 |
| Mode M0 | |||
|---|---|---|---|
| Quadrant | BADHDUFLAG | Total packets | Discarded packets |
| A | 0 | 23615 | 2 |
| B | 0 | 11287 | 1 |
| C | 0 | 20524 | 1 |
| D | 0 | 14237 | 1 |
| Mode M9 | |||
|---|---|---|---|
| Quadrant | BADHDUFLAG | Total packets | Discarded packets |
| A | 0 | 19 | 0 |
| B | 0 | 19 | 0 |
| C | 0 | 19 | 0 |
| D | 0 | 19 | 0 |
| Quadrant | Total seconds | Saturated seconds | Saturation percentage |
|---|---|---|---|
| A | 5311 | 299 | 5.629825% |
| B | 5311 | 49 | 0.922613% |
| C | 5311 | 697 | 13.123706% |
| D | 5311 | 166 | 3.125588% |
Noise dominated data is calculated using 1-second bins in cleaned event files. If a bin has >2000 counts, and if more than 50% of those come from <1% of pixels, then it is considered to be noise-dominated and hence unusable.
| Quadrant | # 1 sec bins | Bins with >0 counts | Bins with >2000 counts | High rate bins dominated by noise | Noise dominated (total time) | Noise dominated (detector-on time) | Marked lightcurve |
|---|---|---|---|---|---|---|---|
| A | 7224 | 5312 | 254 | 254 | 3.52% | 4.78% | 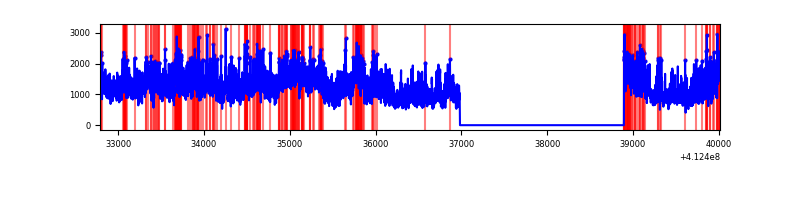 |
| B | 7224 | 5312 | 28 | 28 | 0.39% | 0.53% | 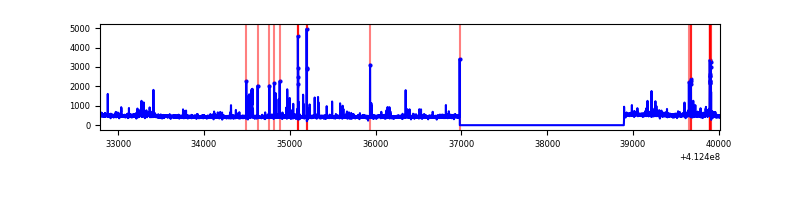 |
| C | 7224 | 5312 | 510 | 510 | 7.06% | 9.60% | 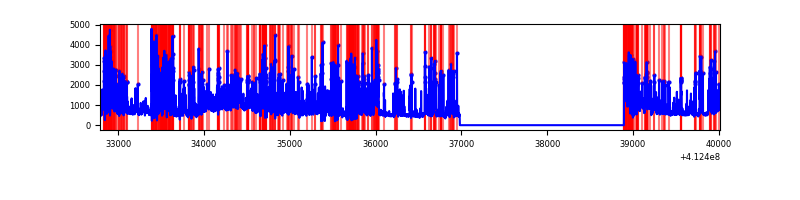 |
| D | 7224 | 5312 | 115 | 115 | 1.59% | 2.16% | 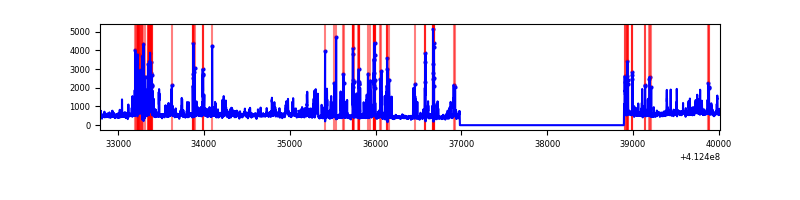 |
Top three noisy pixels from each quadrant. If the there are fewer than three noisy pixels in the level2.evt file, extra rows are filled as -1
| Pixel properties | Quadrant properties | ||||||
|---|---|---|---|---|---|---|---|
| Quadrant | DetID | PixID | Counts | Sigma | Mean | Median | Sigma |
| A | 15 | 222 | 3902982 | 31851.66 | 607 | 596 | 122.5 |
| A | 10 | 83 | 406971 | 3316.87 | 607 | 596 | 122.5 |
| A | 6 | 10 | 15922 | 125.09 | 607 | 596 | 122.5 |
| B | 5 | 172 | 131286 | 1130.29 | 604 | 585 | 115.6 |
| B | 5 | 255 | 61998 | 531.09 | 604 | 585 | 115.6 |
| B | 4 | 251 | 24521 | 207.0 | 604 | 585 | 115.6 |
| C | 15 | 208 | 2732059 | 21016.33 | 566 | 570 | 130.0 |
| C | 9 | 187 | 407055 | 3127.53 | 566 | 570 | 130.0 |
| C | 15 | 214 | 208309 | 1598.36 | 566 | 570 | 130.0 |
| D | 13 | 249 | 743271 | 5055.18 | 599 | 582 | 146.9 |
| D | 1 | 52 | 302054 | 2052.0 | 599 | 582 | 146.9 |
| D | 12 | 233 | 109603 | 742.06 | 599 | 582 | 146.9 |
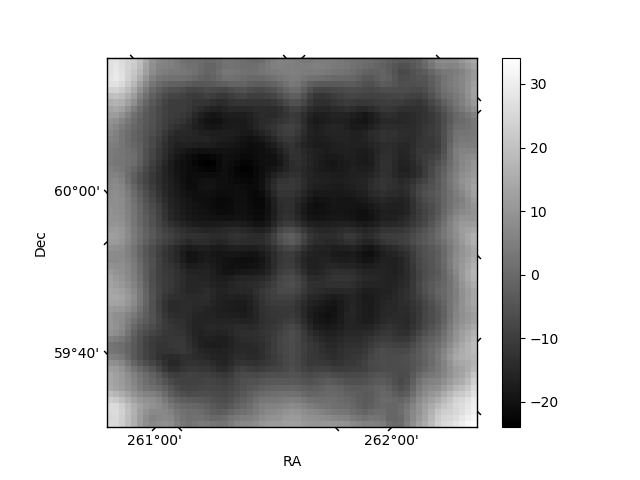
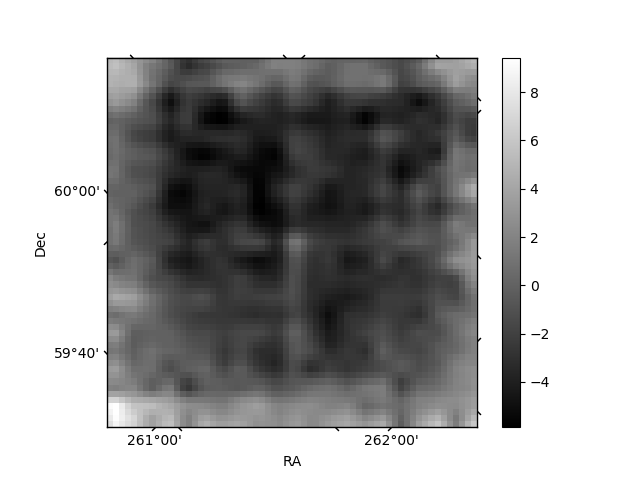
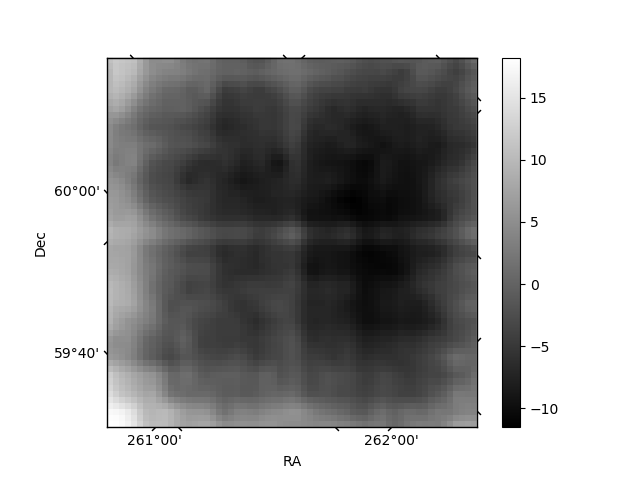
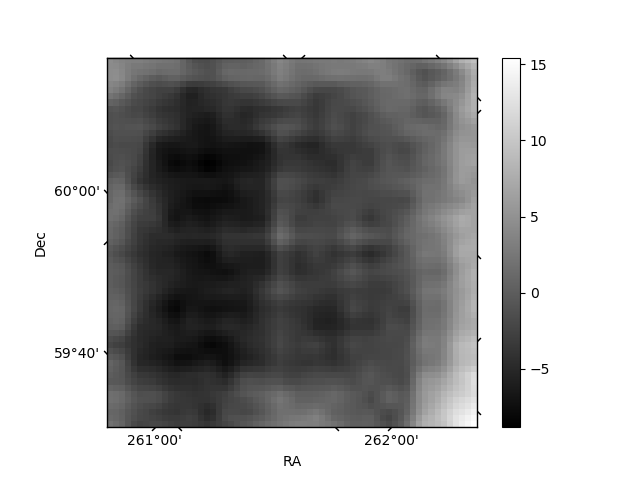
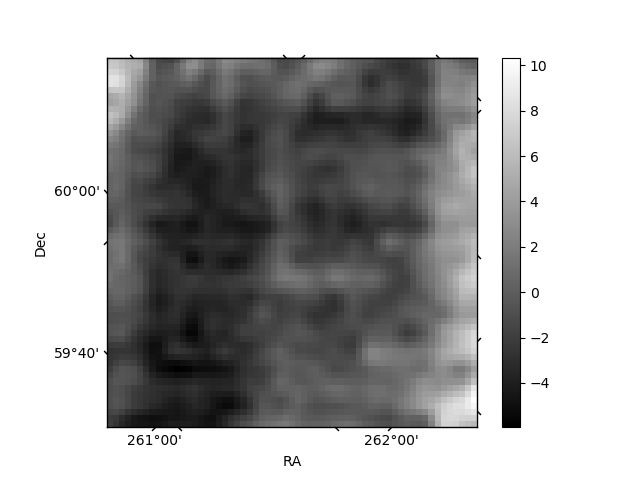
Histogram calculated using DETX and DETY for each event in the final _common_clean file
| Quadrant A | 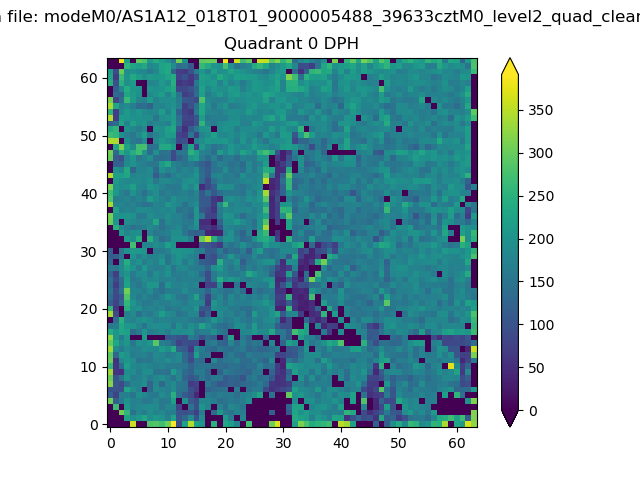 |
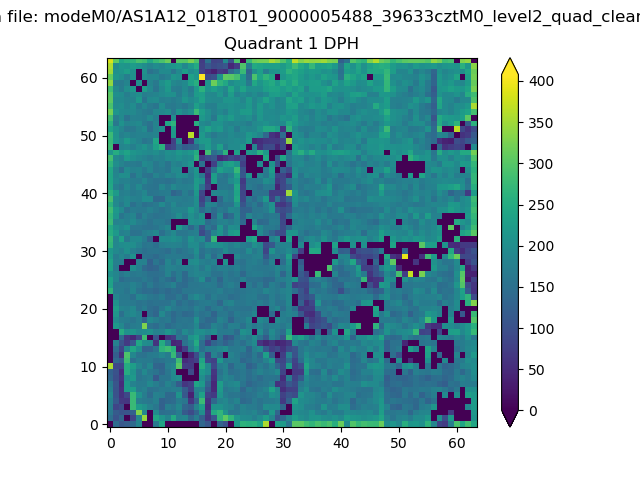 |
Quadrant B |
|---|---|---|---|
| Quadrant D | 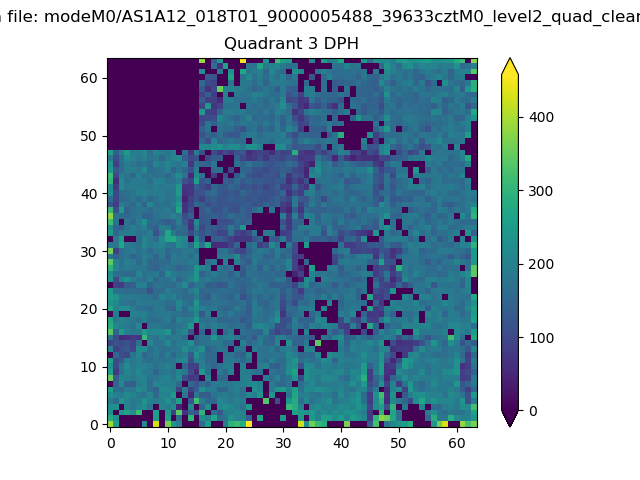 |
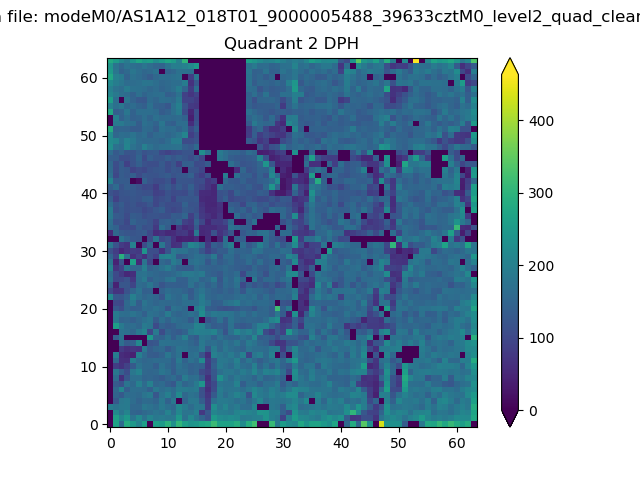 |
Quadrant C |
| Plot type | Count rate plots | Images |
|---|---|---|
| Comparison with Poisson distribution Blue bars denote a histogram of data divided into 1 sec bins. Red curve is a Poisson curve with rate = median count rate of data. |
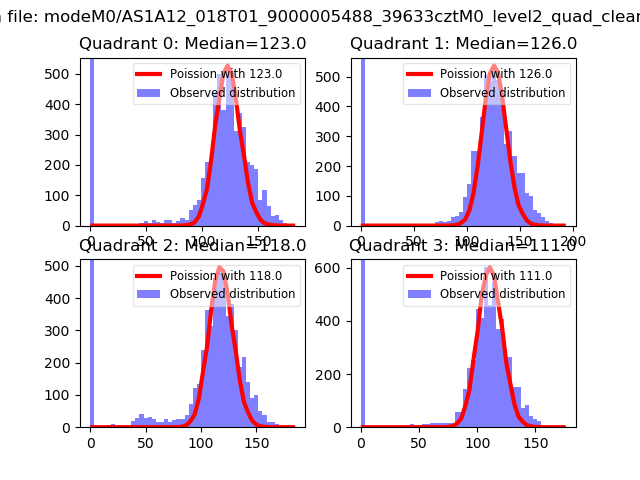 |
 |
| Quadrant-wise count rates Data is divided into 100 sec bins |
 |
|
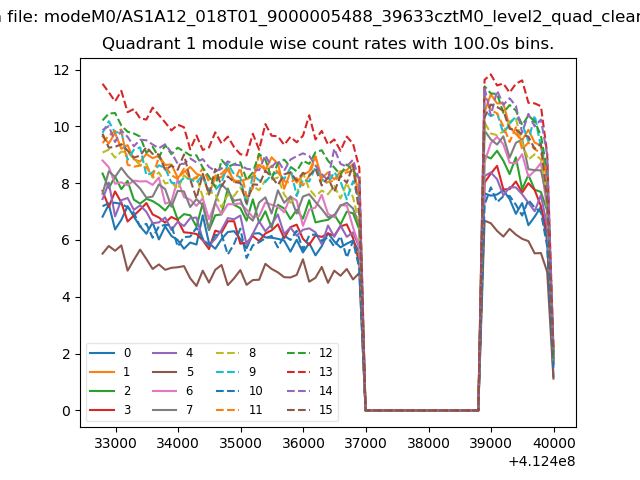
| Module-wise count rates for Quadrant A Data is divided into 100 sec bins |
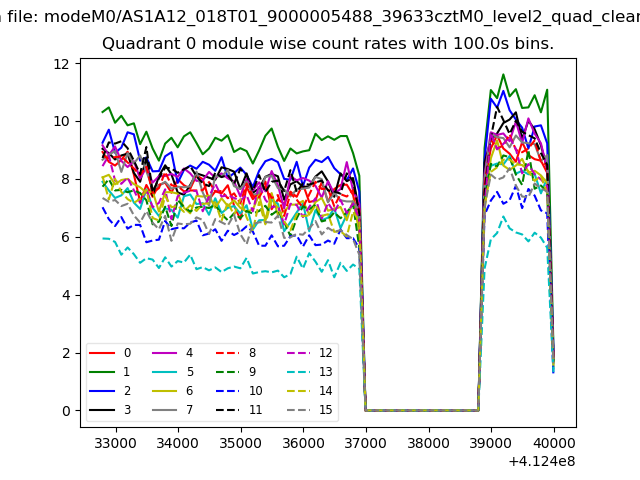 |
 |
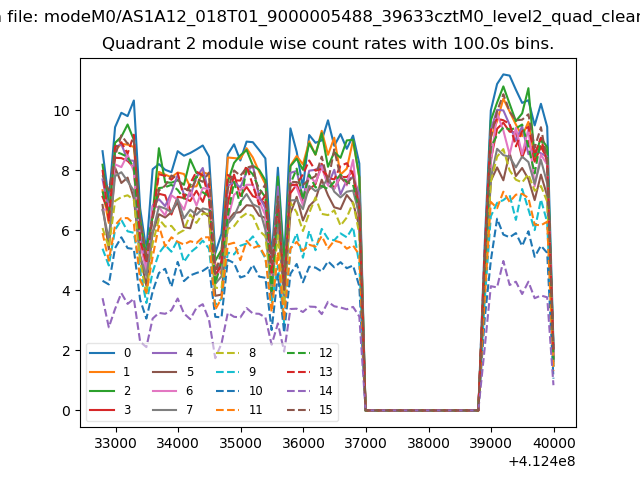
| Module-wise count rates for Quadrant B Data is divided into 100 sec bins |
 |
 |
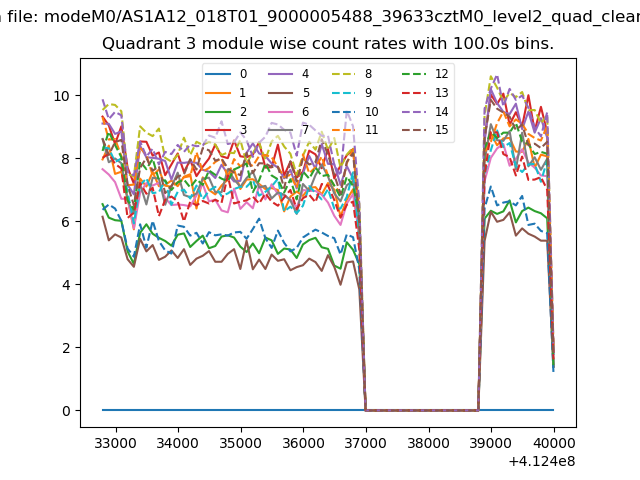
| Module-wise count rates for Quadrant C Data is divided into 100 sec bins |
 |
 |
| Module-wise count rates for Quadrant D Data is divided into 100 sec bins |
 |
 |
| Parameter | Plot |
|---|---|
| CZT HV Monitor | 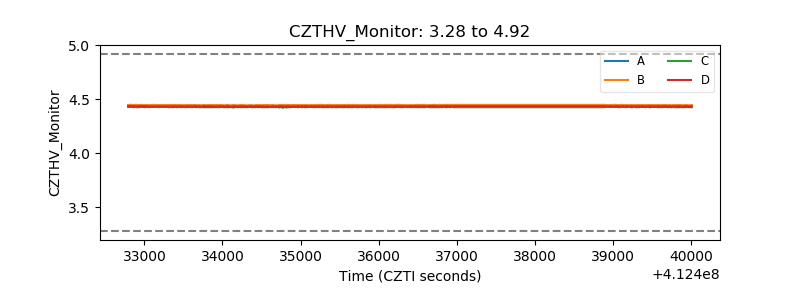 |
| D_VDD | 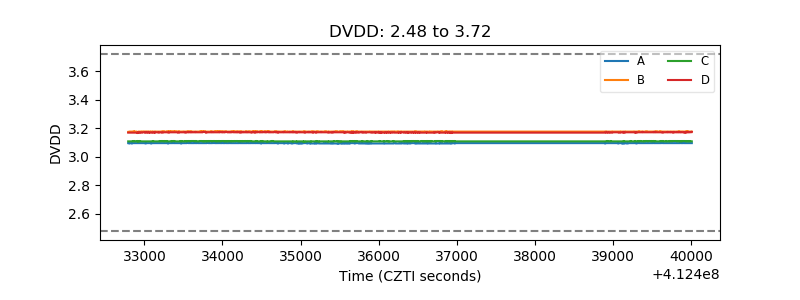 |
| Temperature 1 | 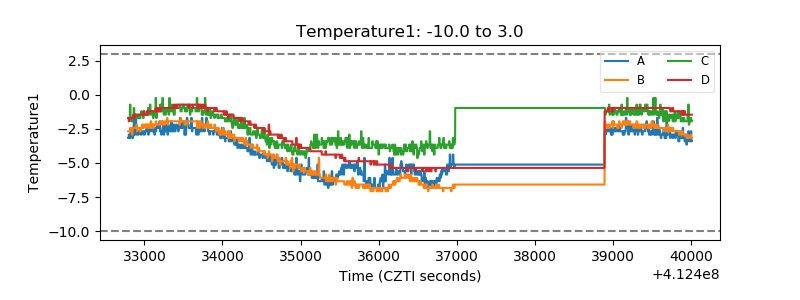 |
| Veto HV Monitor | 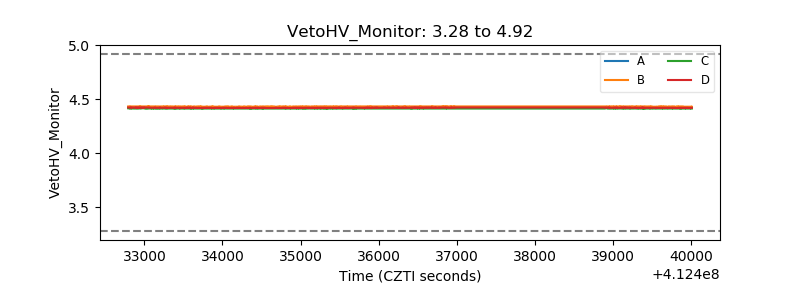 |
| Veto LLD | 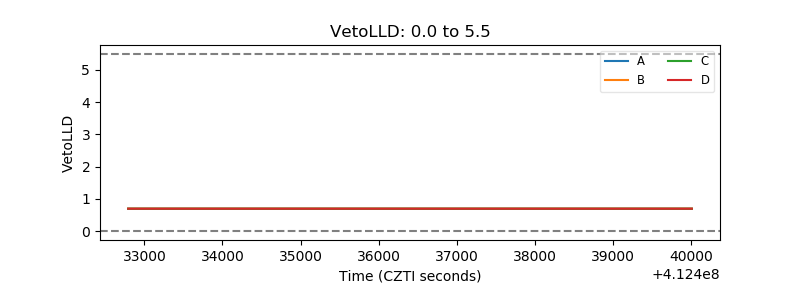 |
| Alpha Counter | 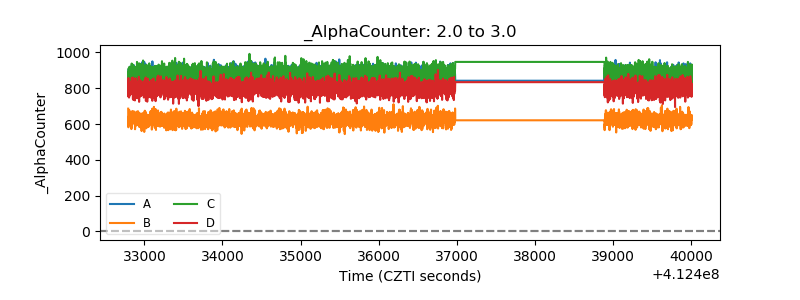 |
| _CPM_Rate | 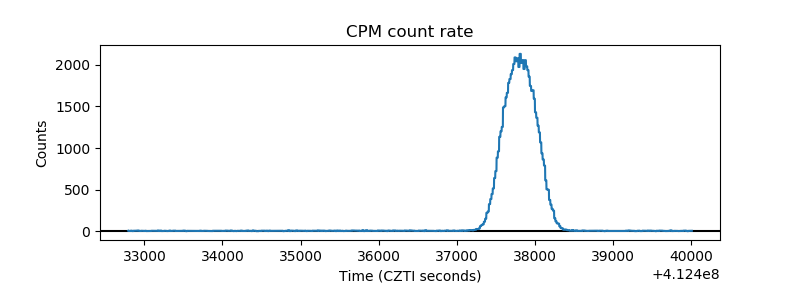 |
| CZT Counter | 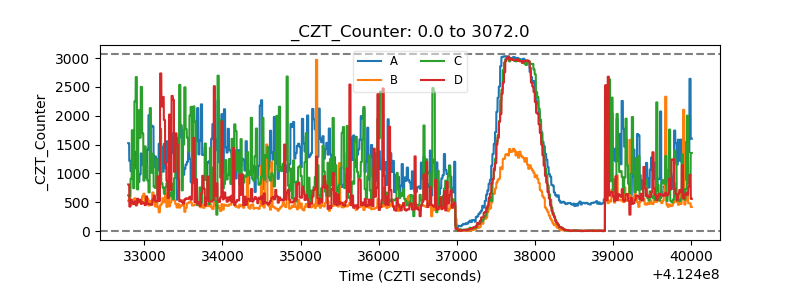 |
| +2.5 Volts monitor | 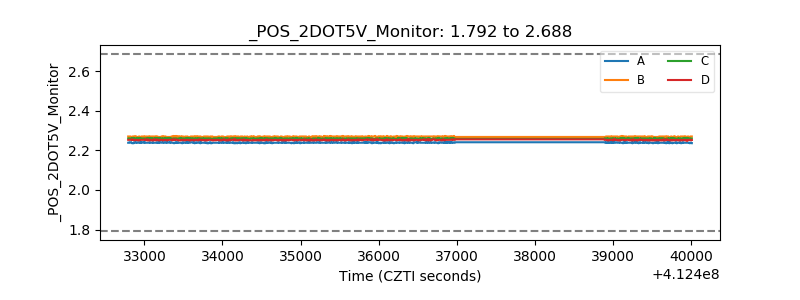 |
| +5 Volts monitor |  |
| _ROLL_ROT | 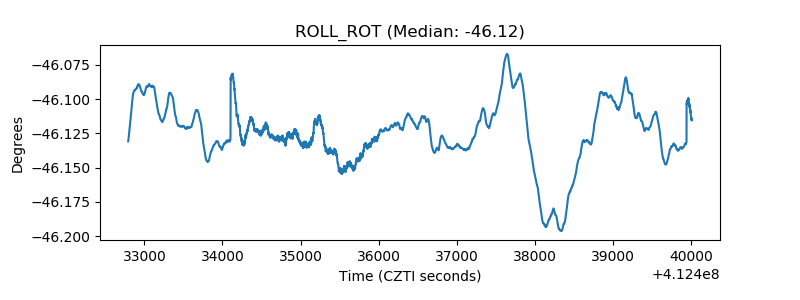 |
| _Roll_DEC | 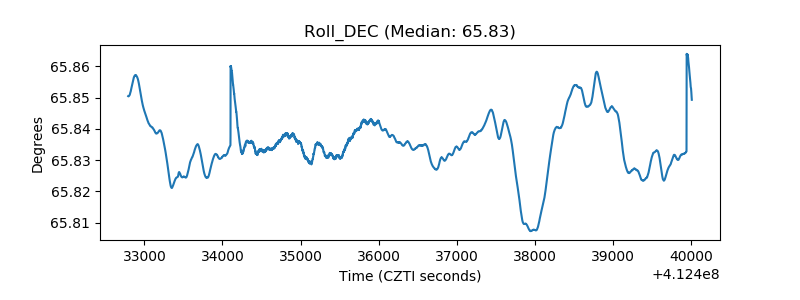 |
| _Roll_RA | 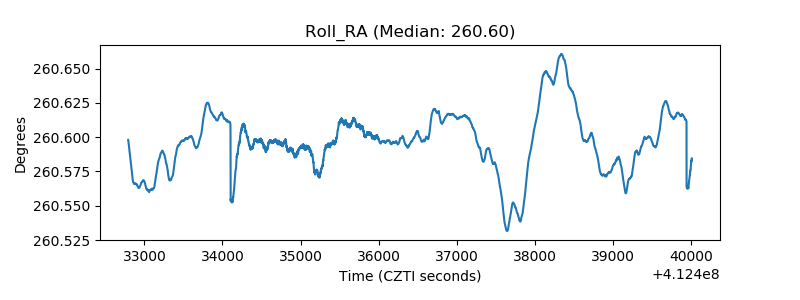 |
| Veto Counter | 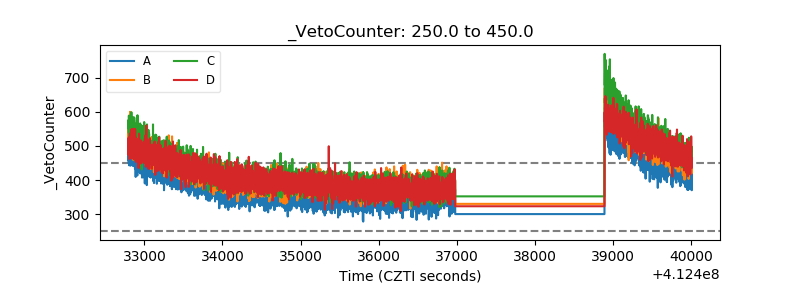 |