| Param | Original file | Final file |
|---|---|---|
| Filename | modeM0/AS1A12_018T01_9000005488_39634cztM0_level2.fits | modeM0/AS1A12_018T01_9000005488_39634cztM0_level2_quad_clean.evt |
| Size (bytes) | 464,676,480 | 87,955,200 |
| Size | 443.2 MB | 83.9 MB |
| Events in quadrant A | 6,251,751 | 557,943 |
| Events in quadrant B | 2,317,954 | 637,320 |
| Events in quadrant C | 4,909,109 | 569,749 |
| Events in quadrant D | 3,345,106 | 557,124 |
| Mode SS | |||
|---|---|---|---|
| Quadrant | BADHDUFLAG | Total packets | Discarded packets |
| A | 0 | 100 | 0 |
| B | 0 | 100 | 0 |
| C | 0 | 100 | 0 |
| D | 0 | 100 | 0 |
| Mode M0 | |||
|---|---|---|---|
| Quadrant | BADHDUFLAG | Total packets | Discarded packets |
| A | 0 | 22062 | 2 |
| B | 0 | 10060 | 1 |
| C | 0 | 17868 | 1 |
| D | 0 | 13481 | 1 |
| Mode M9 | |||
|---|---|---|---|
| Quadrant | BADHDUFLAG | Total packets | Discarded packets |
| A | 0 | 20 | 0 |
| B | 0 | 20 | 0 |
| C | 0 | 20 | 0 |
| D | 0 | 20 | 0 |
| Quadrant | Total seconds | Saturated seconds | Saturation percentage |
|---|---|---|---|
| A | 4861 | 661 | 13.598025% |
| B | 4861 | 26 | 0.534869% |
| C | 4861 | 500 | 10.285949% |
| D | 4861 | 156 | 3.209216% |
Noise dominated data is calculated using 1-second bins in cleaned event files. If a bin has >2000 counts, and if more than 50% of those come from <1% of pixels, then it is considered to be noise-dominated and hence unusable.
| Quadrant | # 1 sec bins | Bins with >0 counts | Bins with >2000 counts | High rate bins dominated by noise | Noise dominated (total time) | Noise dominated (detector-on time) | Marked lightcurve |
|---|---|---|---|---|---|---|---|
| A | 6863 | 4862 | 630 | 630 | 9.18% | 12.96% | 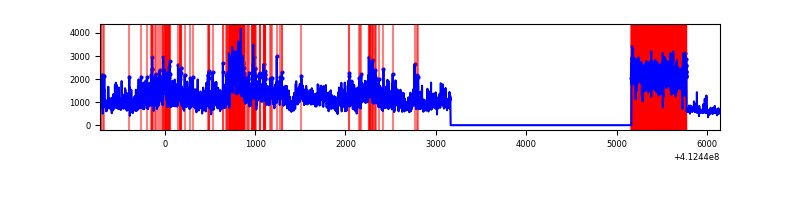 |
| B | 6863 | 4862 | 18 | 18 | 0.26% | 0.37% | 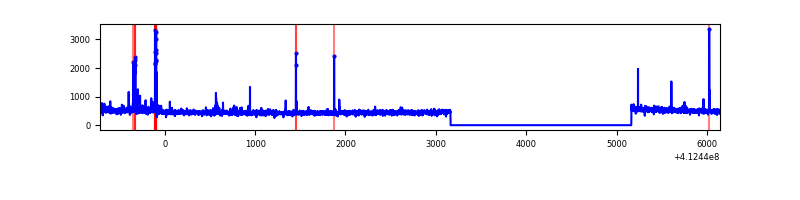 |
| C | 6863 | 4862 | 466 | 466 | 6.79% | 9.58% | 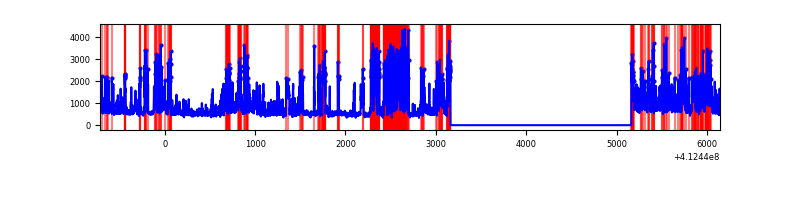 |
| D | 6863 | 4862 | 122 | 122 | 1.78% | 2.51% | 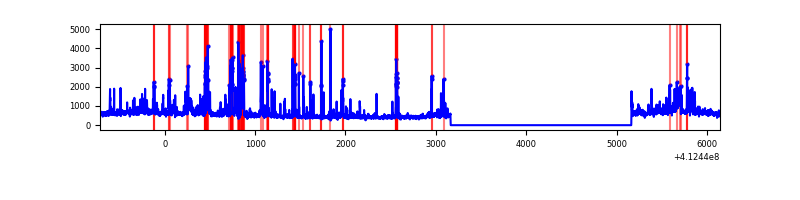 |
Top three noisy pixels from each quadrant. If the there are fewer than three noisy pixels in the level2.evt file, extra rows are filled as -1
| Pixel properties | Quadrant properties | ||||||
|---|---|---|---|---|---|---|---|
| Quadrant | DetID | PixID | Counts | Sigma | Mean | Median | Sigma |
| A | 15 | 222 | 3788627 | 34418.06 | 547 | 536 | 110.1 |
| A | 10 | 83 | 333295 | 3023.4 | 547 | 536 | 110.1 |
| A | 9 | 143 | 7918 | 67.07 | 547 | 536 | 110.1 |
| B | 5 | 172 | 55184 | 506.99 | 564 | 549 | 107.8 |
| B | 5 | 255 | 32859 | 299.82 | 564 | 549 | 107.8 |
| B | 12 | 111 | 12603 | 111.86 | 564 | 549 | 107.8 |
| C | 15 | 208 | 2339942 | 18601.14 | 546 | 551 | 125.8 |
| C | 15 | 214 | 194154 | 1539.39 | 546 | 551 | 125.8 |
| C | 9 | 187 | 194027 | 1538.38 | 546 | 551 | 125.8 |
| D | 13 | 249 | 735680 | 5385.0 | 558 | 543 | 136.5 |
| D | 1 | 52 | 327048 | 2391.7 | 558 | 543 | 136.5 |
| D | 12 | 233 | 51606 | 374.05 | 558 | 543 | 136.5 |
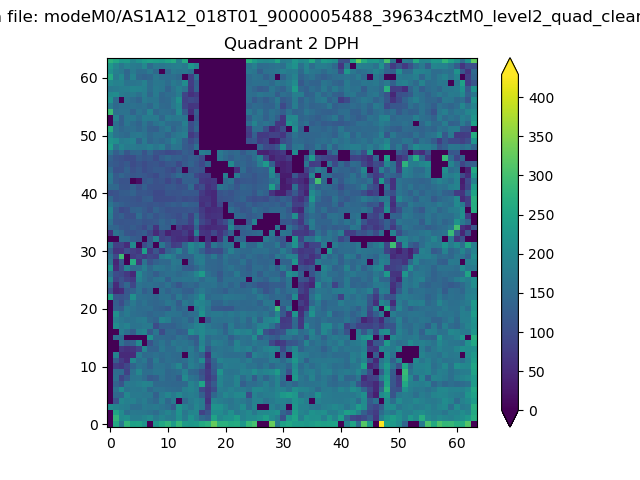
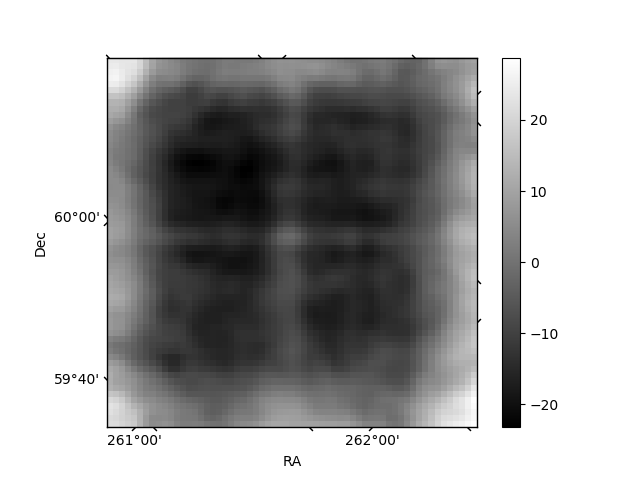
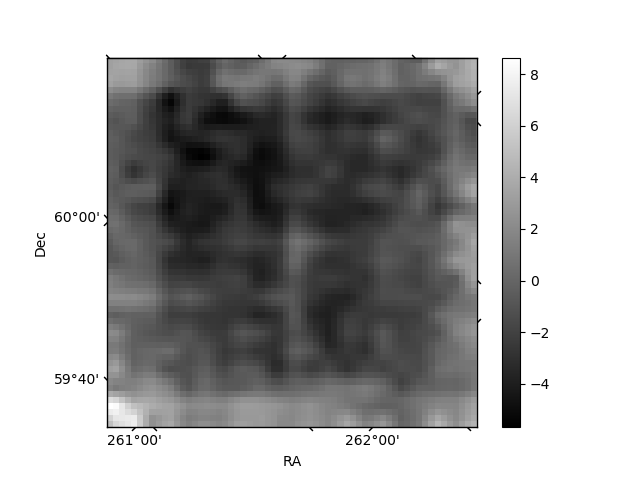
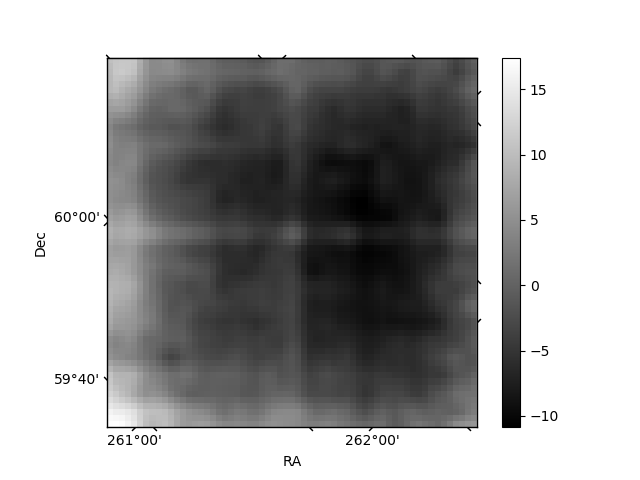
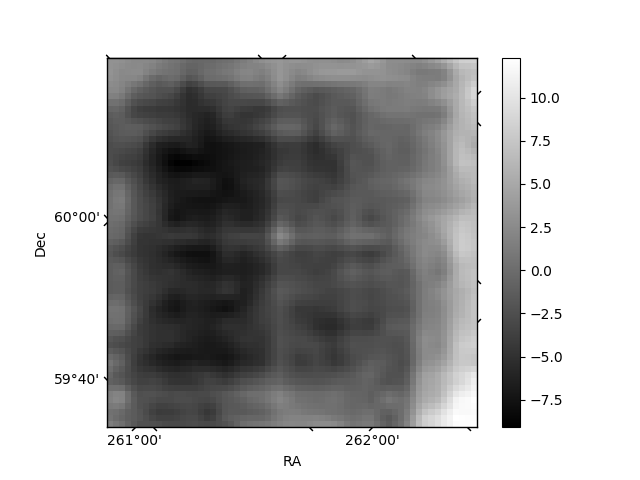
Histogram calculated using DETX and DETY for each event in the final _common_clean file
| Quadrant A | 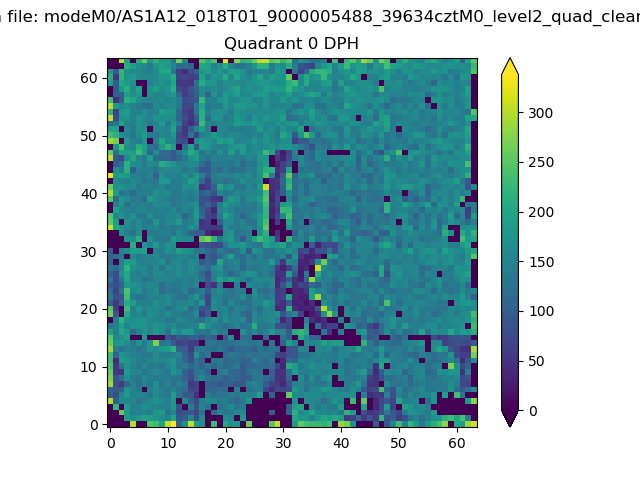 |
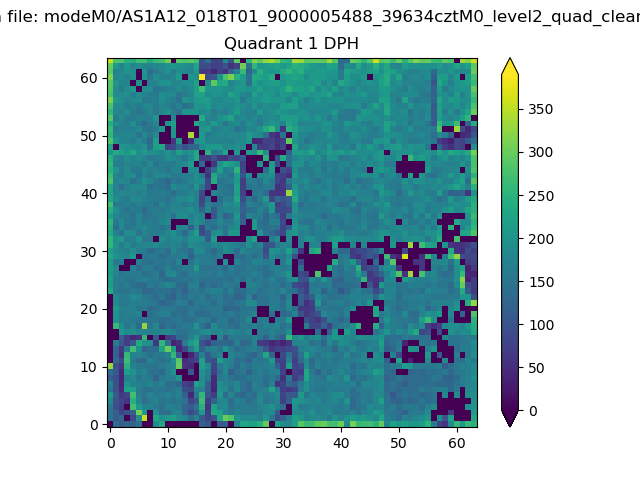 |
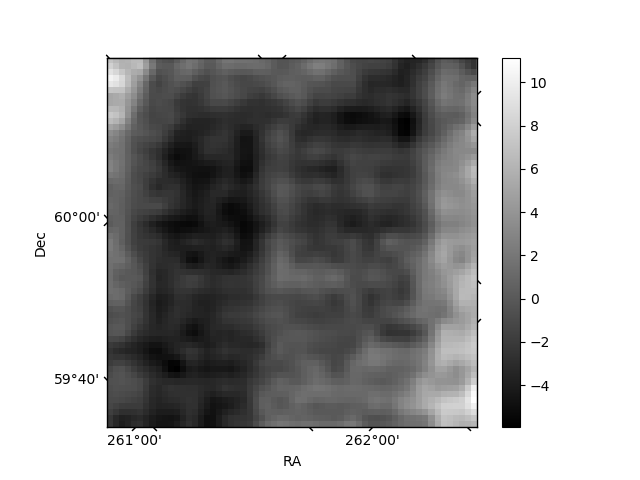
Quadrant B |
|---|---|---|---|
| Quadrant D | 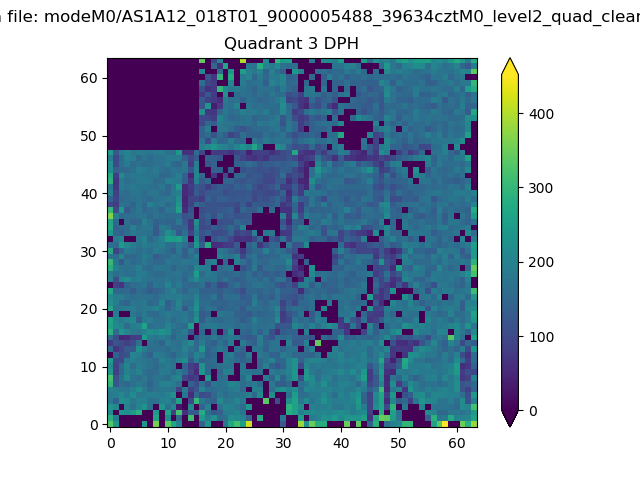 |
 |
Quadrant C |
| Plot type | Count rate plots | Images |
|---|---|---|
| Comparison with Poisson distribution Blue bars denote a histogram of data divided into 1 sec bins. Red curve is a Poisson curve with rate = median count rate of data. |
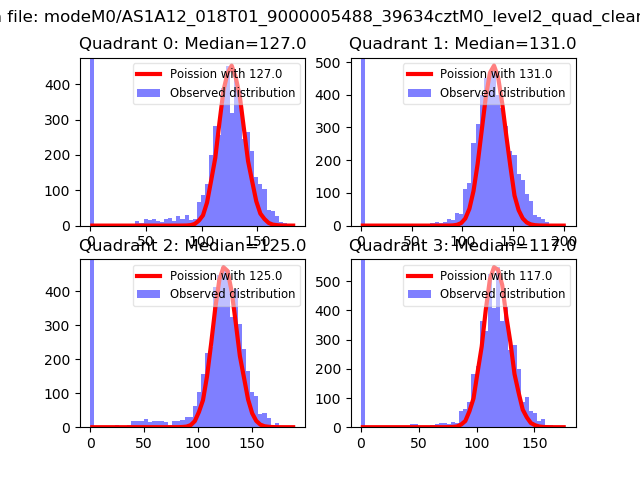 |
 |
| Quadrant-wise count rates Data is divided into 100 sec bins |
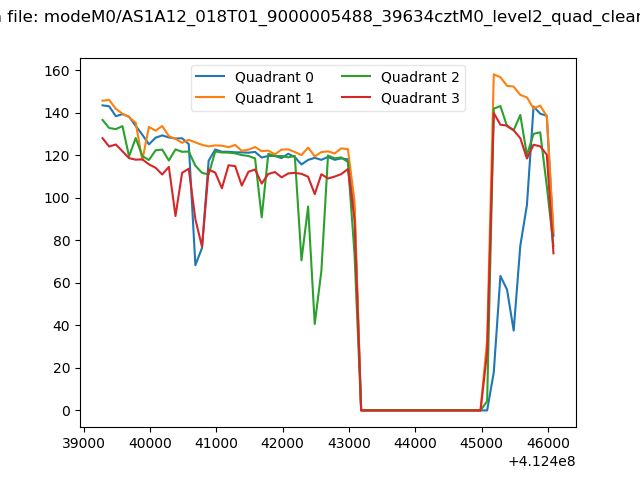 |
|
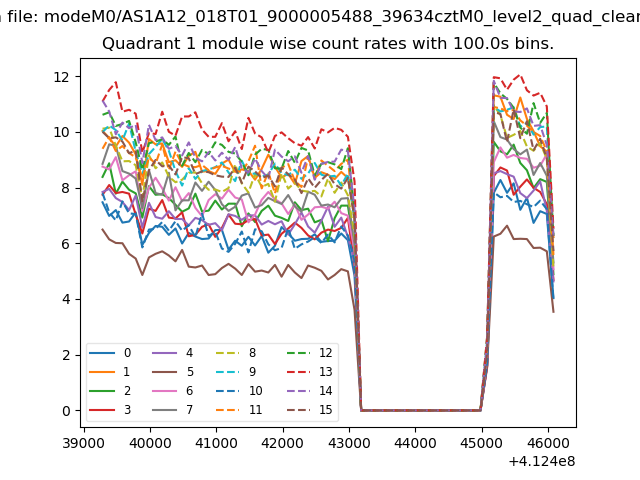
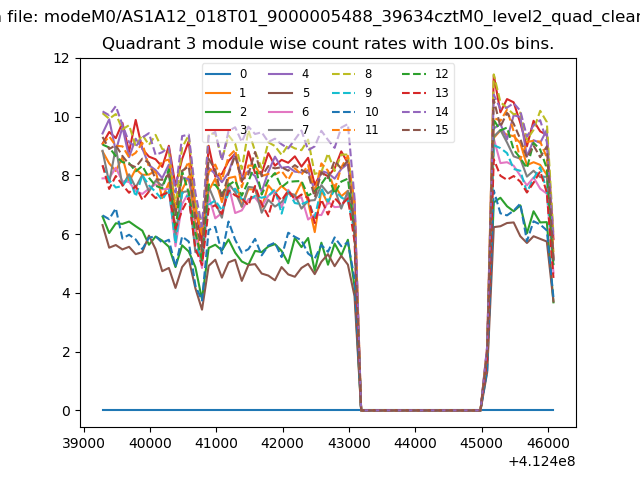
| Module-wise count rates for Quadrant A Data is divided into 100 sec bins |
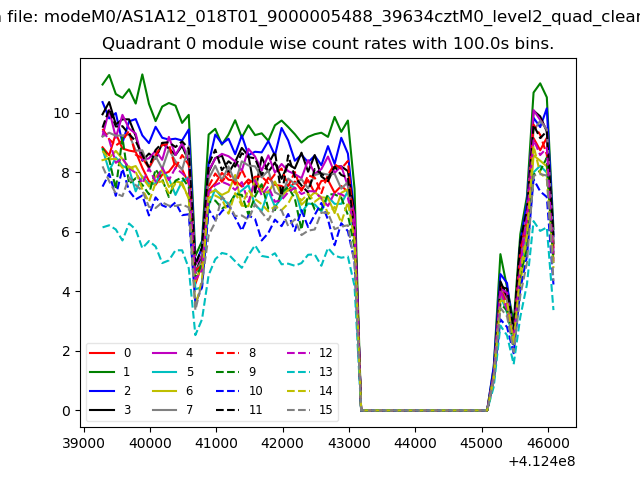 |
 |
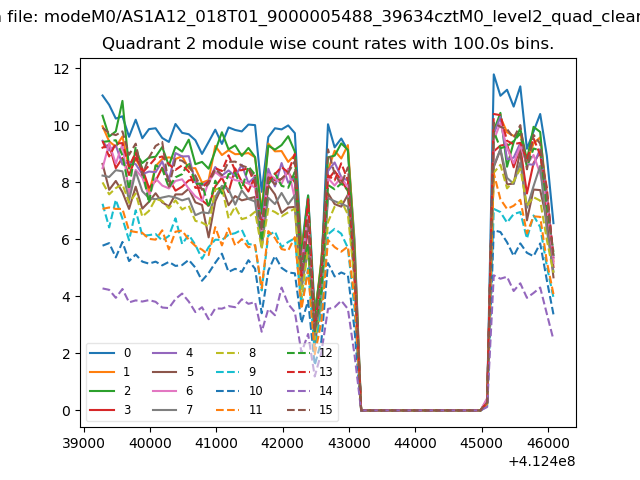
| Module-wise count rates for Quadrant B Data is divided into 100 sec bins |
 |
 |
| Module-wise count rates for Quadrant C Data is divided into 100 sec bins |
 |
 |
| Module-wise count rates for Quadrant D Data is divided into 100 sec bins |
 |
 |
| Parameter | Plot |
|---|---|
| CZT HV Monitor | 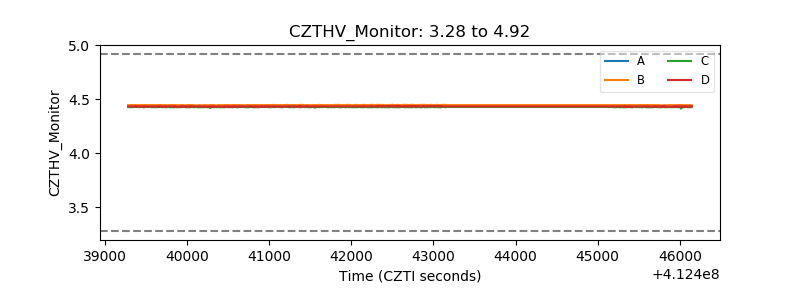 |
| D_VDD | 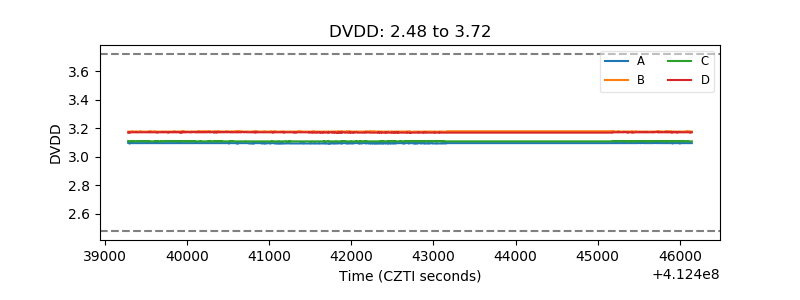 |
| Temperature 1 | 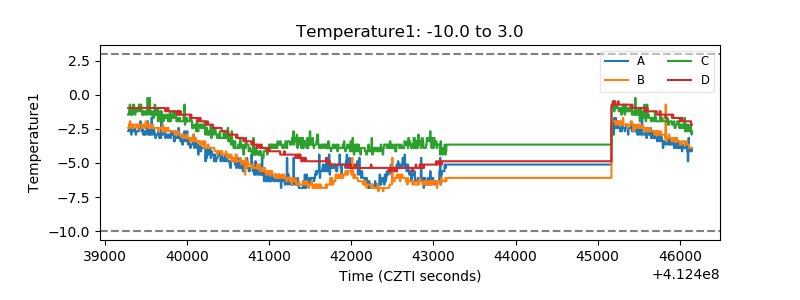 |
| Veto HV Monitor | 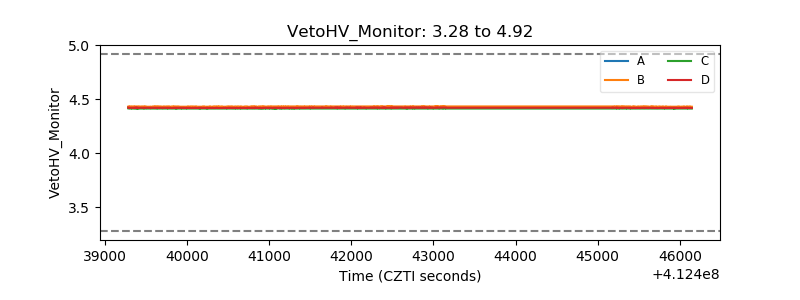 |
| Veto LLD | 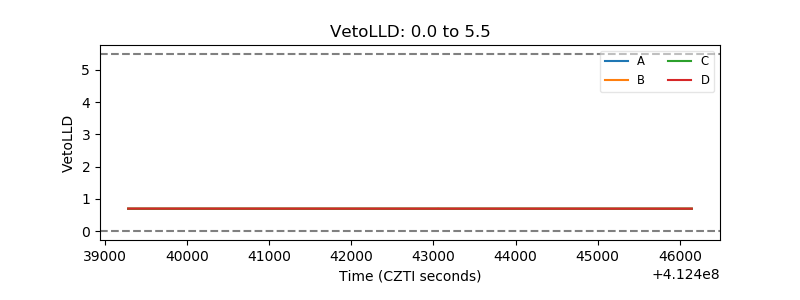 |
| Alpha Counter | 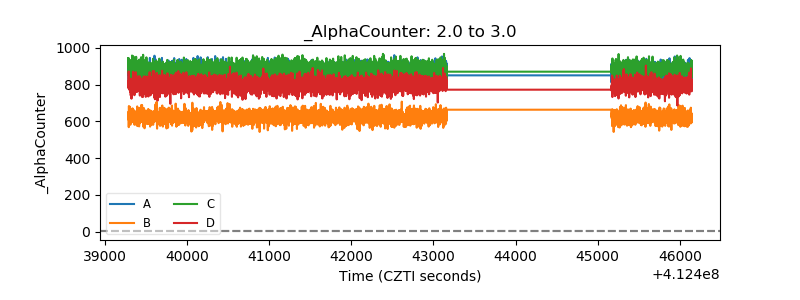 |
| _CPM_Rate | 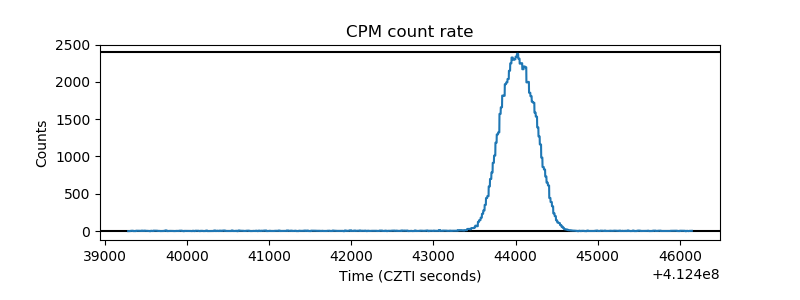 |
| CZT Counter | 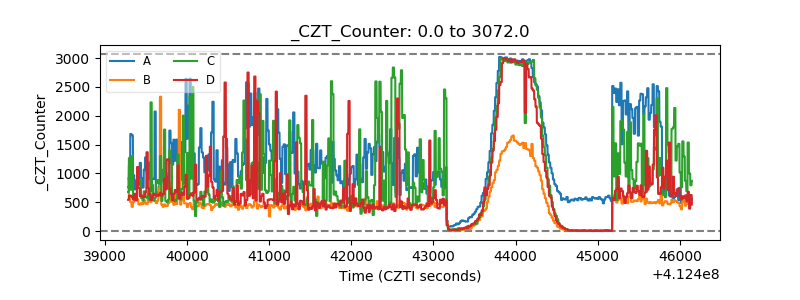 |
| +2.5 Volts monitor | 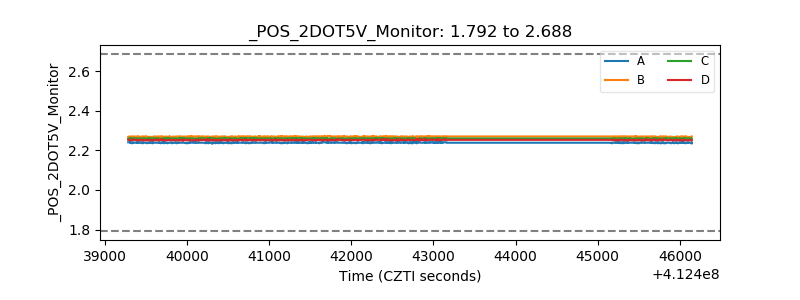 |
| +5 Volts monitor | 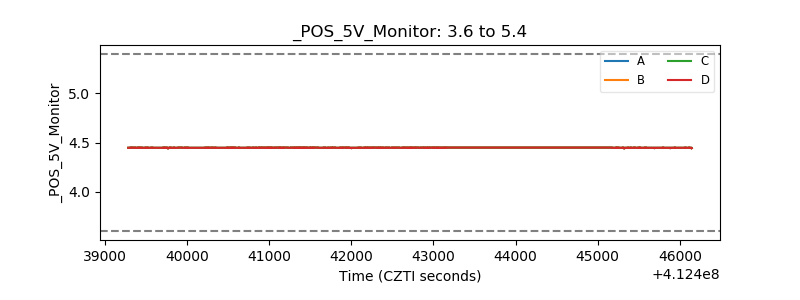 |
| _ROLL_ROT | 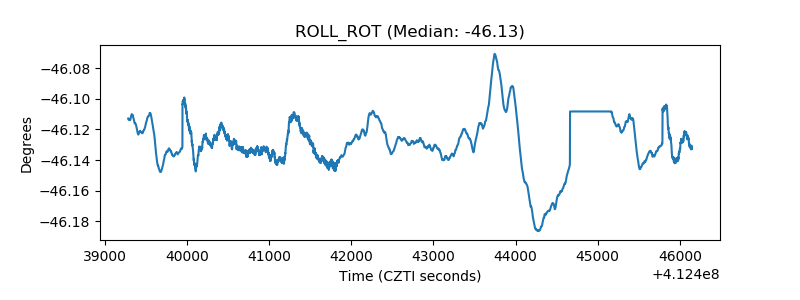 |
| _Roll_DEC | 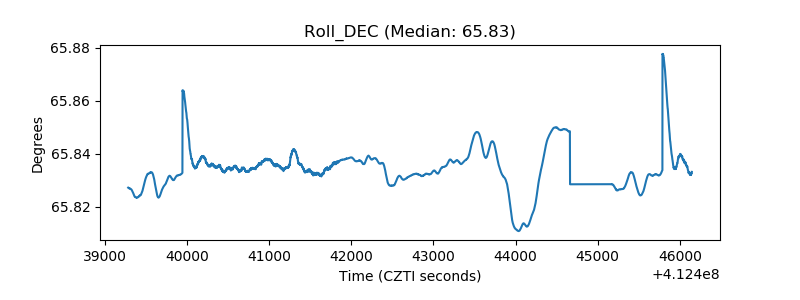 |
| _Roll_RA | 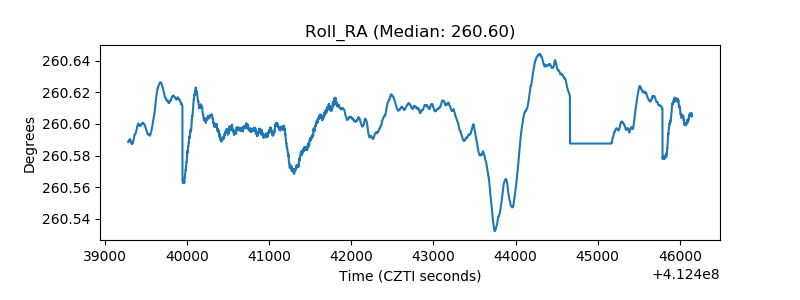 |
| Veto Counter | 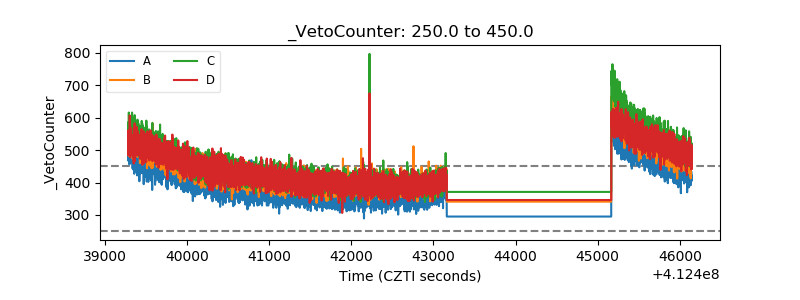 |