| Param | Original file | Final file |
|---|---|---|
| Filename | modeM0/AS1A12_018T01_9000005488_39635cztM0_level2.fits | modeM0/AS1A12_018T01_9000005488_39635cztM0_level2_quad_clean.evt |
| Size (bytes) | 518,722,560 | 89,893,440 |
| Size | 494.7 MB | 85.7 MB |
| Events in quadrant A | 4,544,241 | 587,217 |
| Events in quadrant B | 3,645,778 | 657,057 |
| Events in quadrant C | 6,708,612 | 565,099 |
| Events in quadrant D | 3,915,371 | 562,041 |
| Mode SS | |||
|---|---|---|---|
| Quadrant | BADHDUFLAG | Total packets | Discarded packets |
| A | 0 | 102 | 0 |
| B | 0 | 102 | 0 |
| C | 0 | 102 | 0 |
| D | 0 | 102 | 0 |
| Mode M0 | |||
|---|---|---|---|
| Quadrant | BADHDUFLAG | Total packets | Discarded packets |
| A | 0 | 16672 | 3 |
| B | 0 | 14025 | 2 |
| C | 0 | 23496 | 2 |
| D | 0 | 15129 | 2 |
| Mode M9 | |||
|---|---|---|---|
| Quadrant | BADHDUFLAG | Total packets | Discarded packets |
| A | 0 | 21 | 0 |
| B | 0 | 21 | 0 |
| C | 0 | 21 | 0 |
| D | 0 | 21 | 0 |
| Quadrant | Total seconds | Saturated seconds | Saturation percentage |
|---|---|---|---|
| A | 4999 | 592 | 11.842368% |
| B | 4999 | 149 | 2.980596% |
| C | 4999 | 848 | 16.963393% |
| D | 5000 | 355 | 7.100000% |
Noise dominated data is calculated using 1-second bins in cleaned event files. If a bin has >2000 counts, and if more than 50% of those come from <1% of pixels, then it is considered to be noise-dominated and hence unusable.
| Quadrant | # 1 sec bins | Bins with >0 counts | Bins with >2000 counts | High rate bins dominated by noise | Noise dominated (total time) | Noise dominated (detector-on time) | Marked lightcurve |
|---|---|---|---|---|---|---|---|
| A | 7091 | 5000 | 526 | 526 | 7.42% | 10.52% | 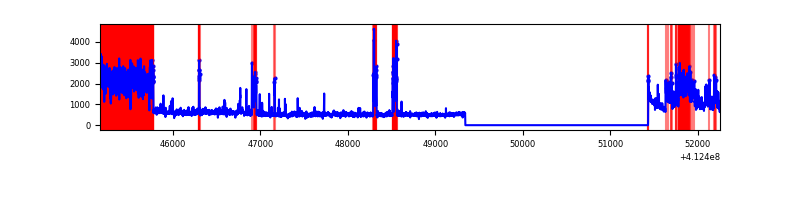 |
| B | 7091 | 5000 | 63 | 63 | 0.89% | 1.26% | 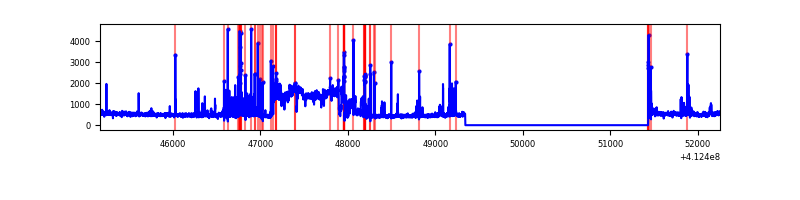 |
| C | 7091 | 5000 | 787 | 787 | 11.10% | 15.74% | 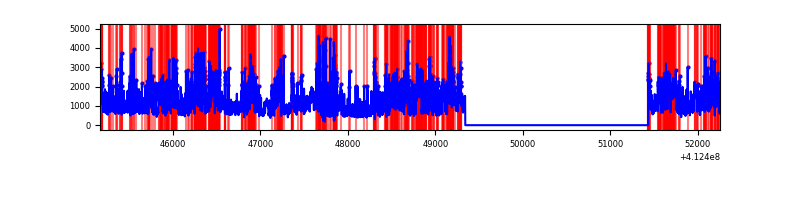 |
| D | 7092 | 5001 | 300 | 300 | 4.23% | 6.00% | 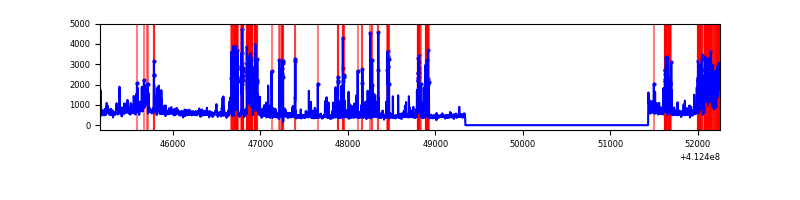 |
Top three noisy pixels from each quadrant. If the there are fewer than three noisy pixels in the level2.evt file, extra rows are filled as -1
| Pixel properties | Quadrant properties | ||||||
|---|---|---|---|---|---|---|---|
| Quadrant | DetID | PixID | Counts | Sigma | Mean | Median | Sigma |
| A | 15 | 222 | 1865255 | 16326.54 | 571 | 560 | 114.2 |
| A | 10 | 83 | 418769 | 3661.67 | 571 | 560 | 114.2 |
| A | 9 | 143 | 33484 | 288.27 | 571 | 560 | 114.2 |
| B | 5 | 172 | 1283066 | 11751.42 | 581 | 566 | 109.1 |
| B | 5 | 255 | 66202 | 601.42 | 581 | 566 | 109.1 |
| B | 12 | 111 | 12568 | 109.97 | 581 | 566 | 109.1 |
| C | 15 | 208 | 3653115 | 28909.4 | 551 | 555 | 126.3 |
| C | 9 | 187 | 649627 | 5137.3 | 551 | 555 | 126.3 |
| C | 15 | 214 | 199266 | 1572.76 | 551 | 555 | 126.3 |
| D | 13 | 249 | 1348188 | 9840.56 | 570 | 556 | 136.9 |
| D | 1 | 52 | 255755 | 1863.49 | 570 | 556 | 136.9 |
| D | 2 | 234 | 26420 | 188.86 | 570 | 556 | 136.9 |
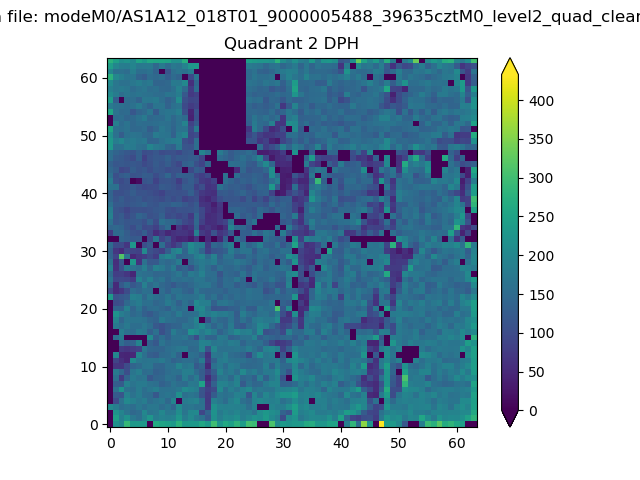
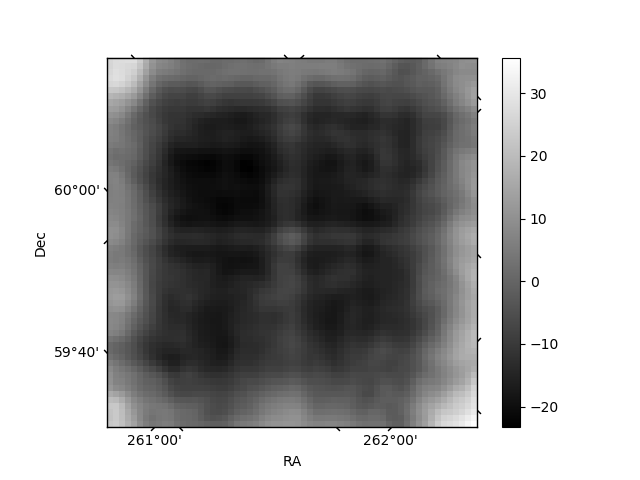
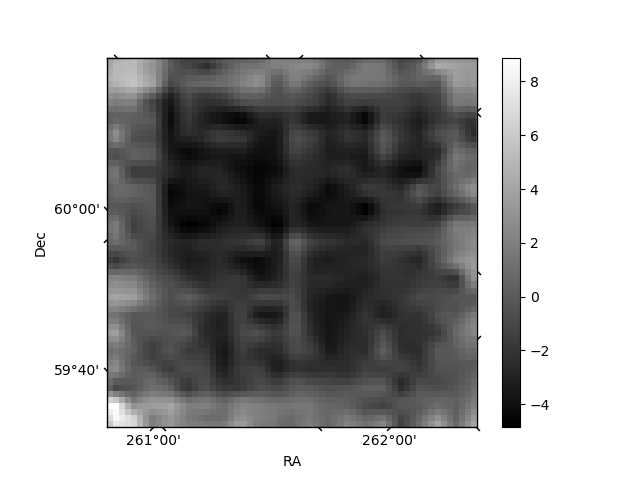
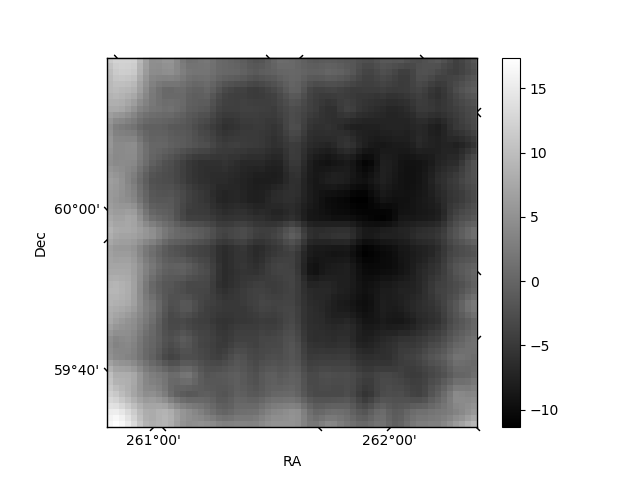
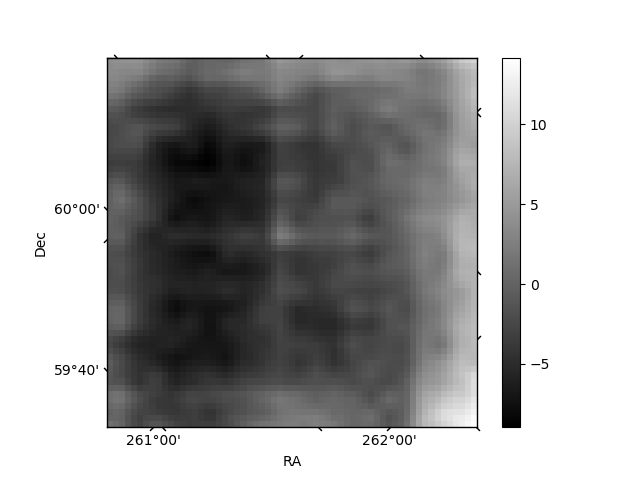
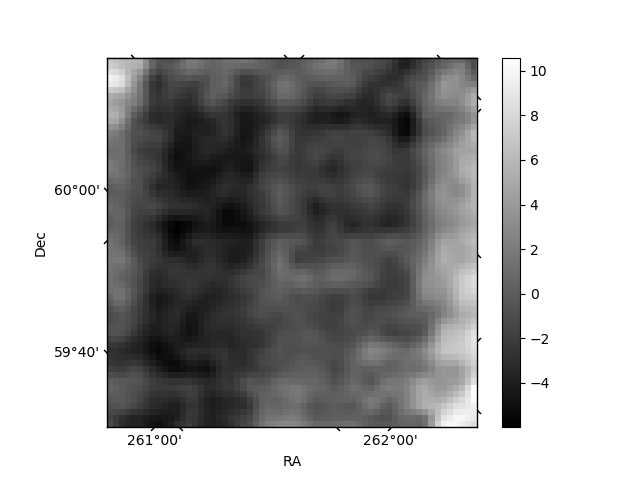
Histogram calculated using DETX and DETY for each event in the final _common_clean file
| Quadrant A | 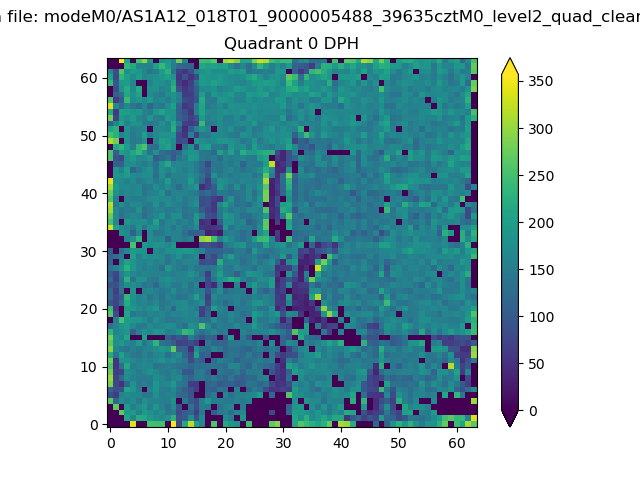 |
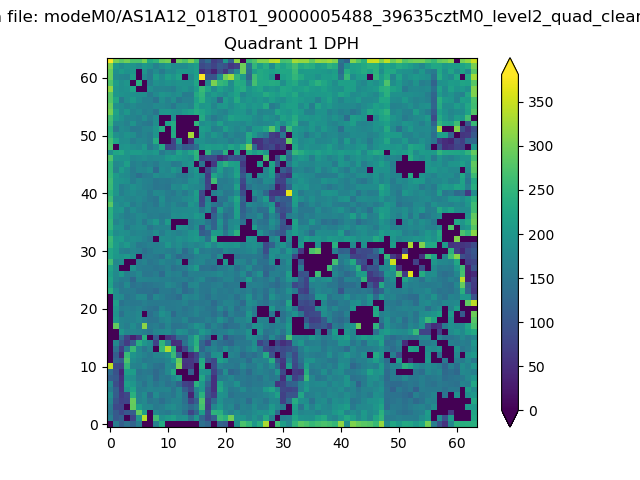 |
Quadrant B |
|---|---|---|---|
| Quadrant D | 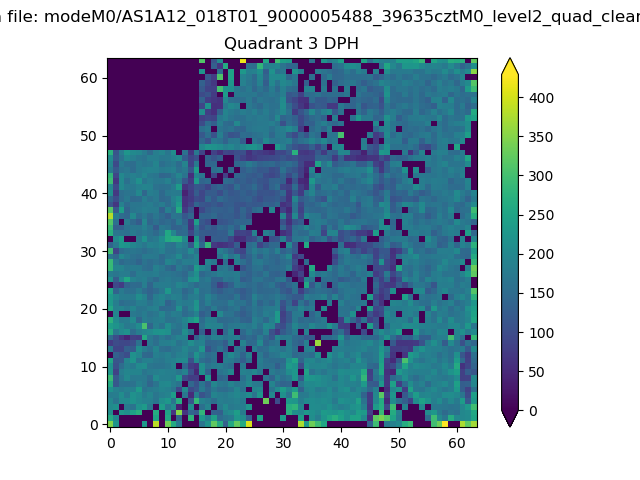 |
 |
Quadrant C |
| Plot type | Count rate plots | Images |
|---|---|---|
| Comparison with Poisson distribution Blue bars denote a histogram of data divided into 1 sec bins. Red curve is a Poisson curve with rate = median count rate of data. |
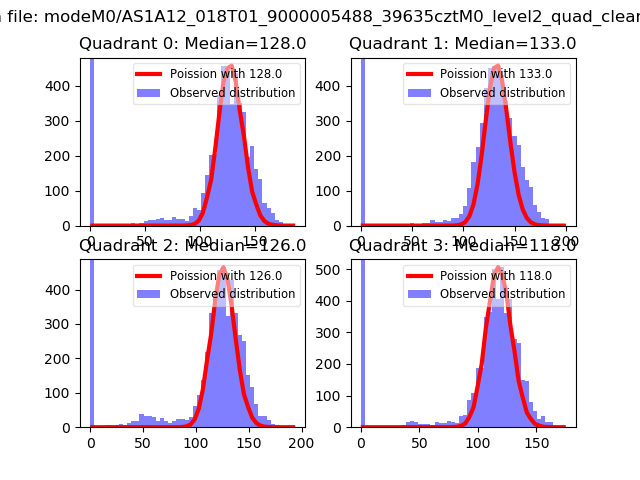 |
 |
| Quadrant-wise count rates Data is divided into 100 sec bins |
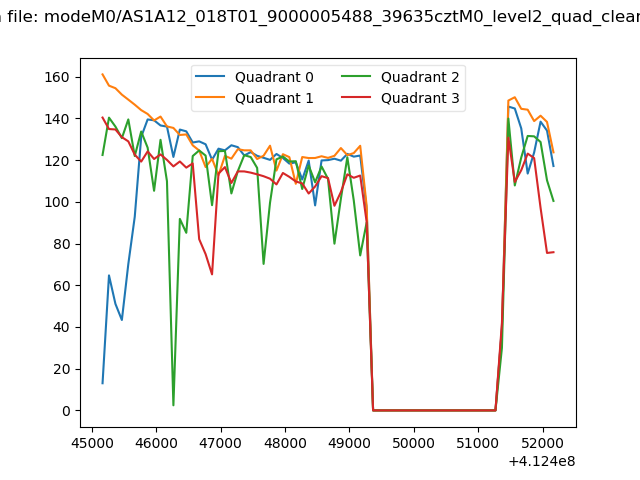 |
|
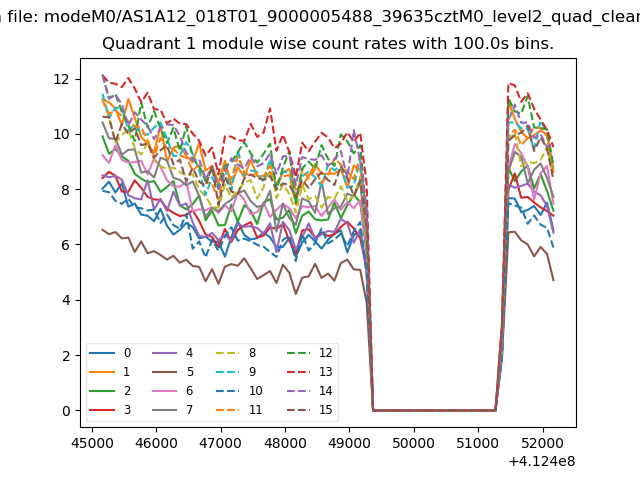
| Module-wise count rates for Quadrant A Data is divided into 100 sec bins |
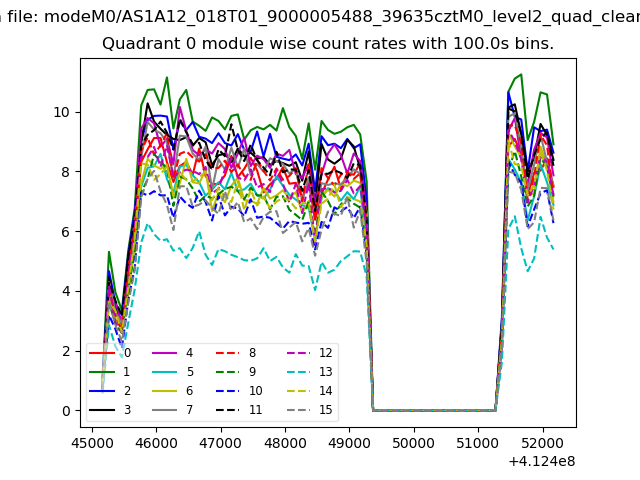 |
 |
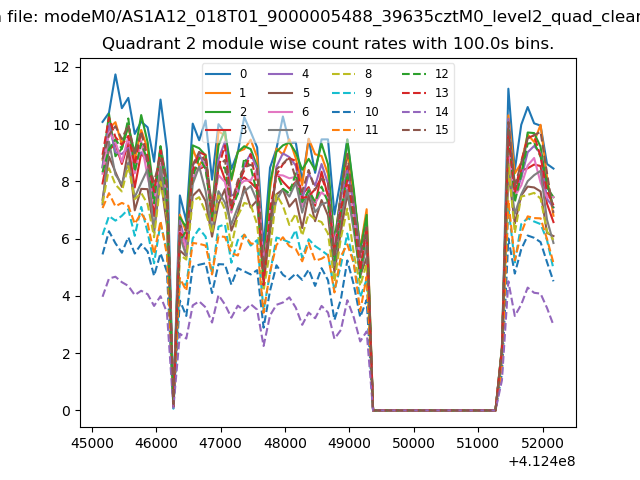
| Module-wise count rates for Quadrant B Data is divided into 100 sec bins |
 |
 |
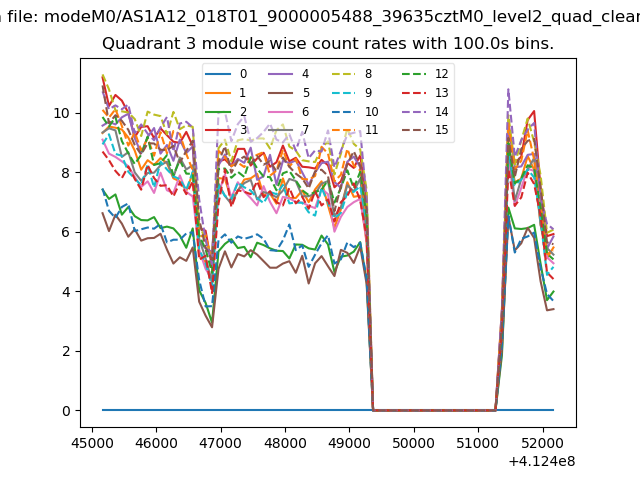
| Module-wise count rates for Quadrant C Data is divided into 100 sec bins |
 |
 |
| Module-wise count rates for Quadrant D Data is divided into 100 sec bins |
 |
 |
| Parameter | Plot |
|---|---|
| CZT HV Monitor | 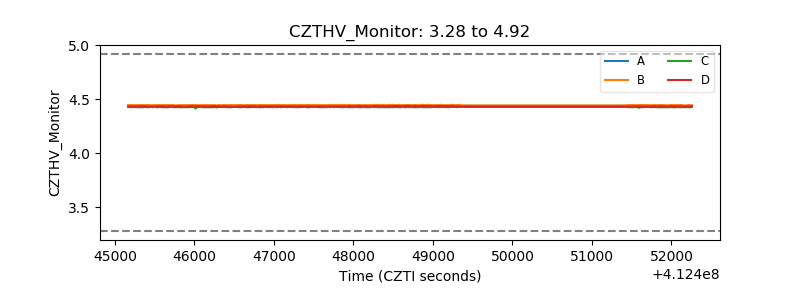 |
| D_VDD | 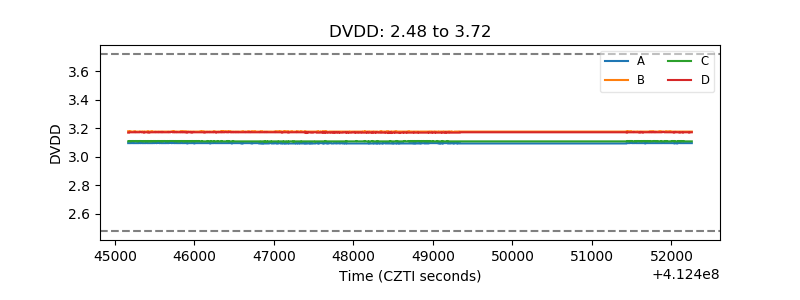 |
| Temperature 1 | 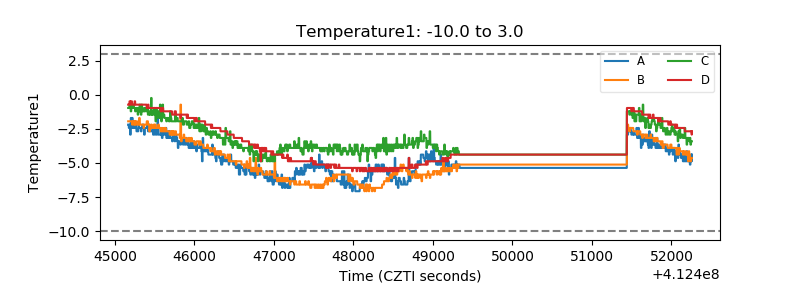 |
| Veto HV Monitor | 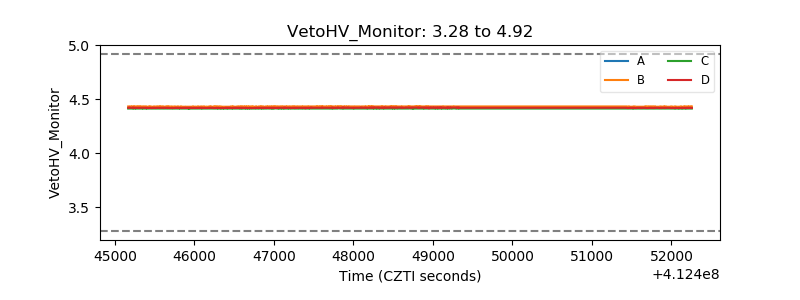 |
| Veto LLD | 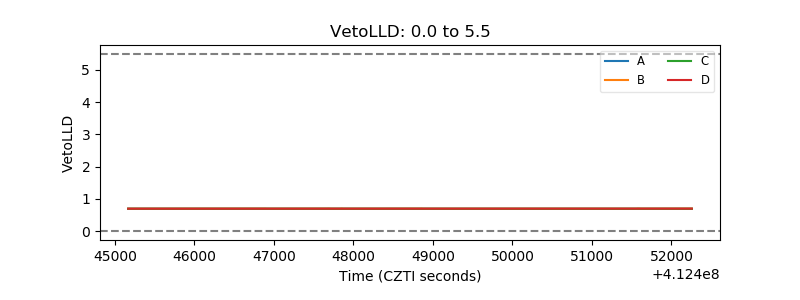 |
| Alpha Counter | 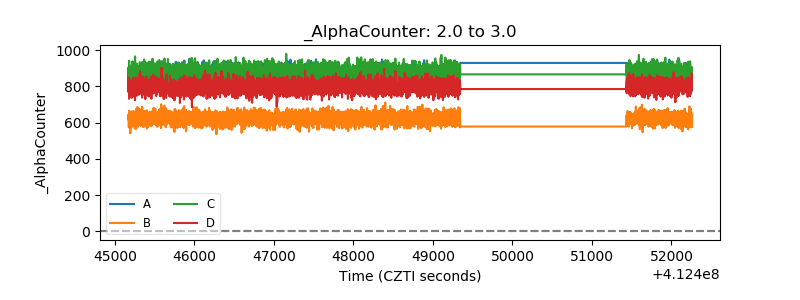 |
| _CPM_Rate | 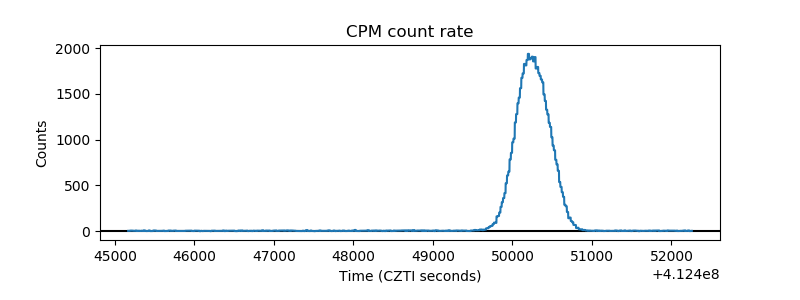 |
| CZT Counter | 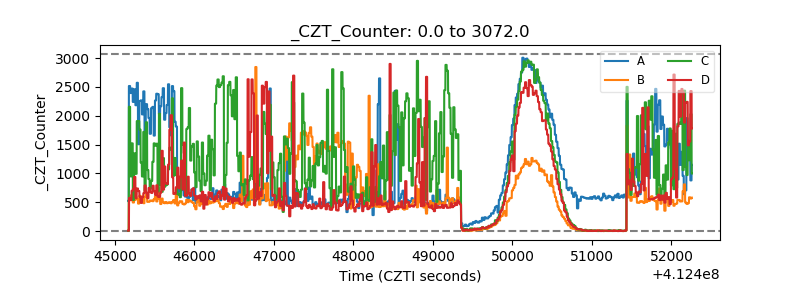 |
| +2.5 Volts monitor | 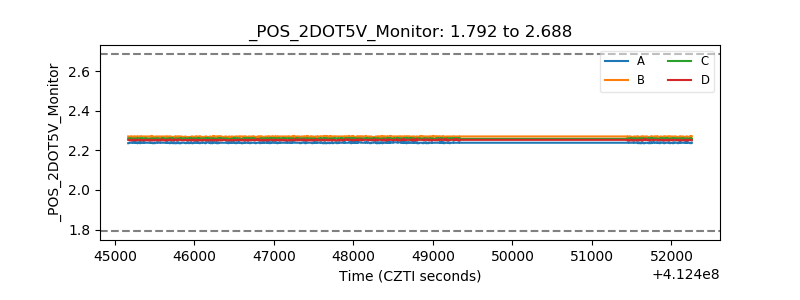 |
| +5 Volts monitor | 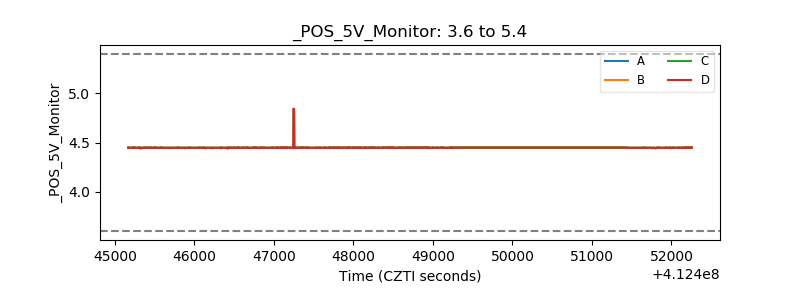 |
| _ROLL_ROT | 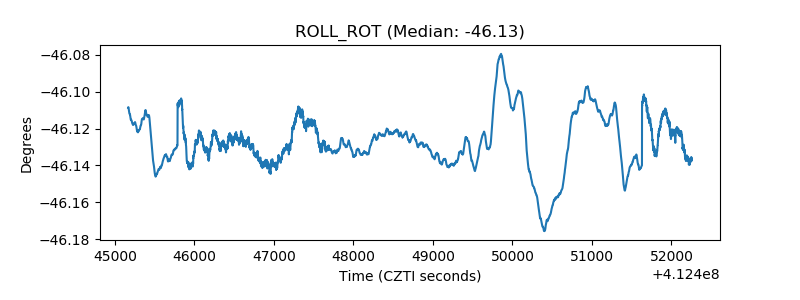 |
| _Roll_DEC | 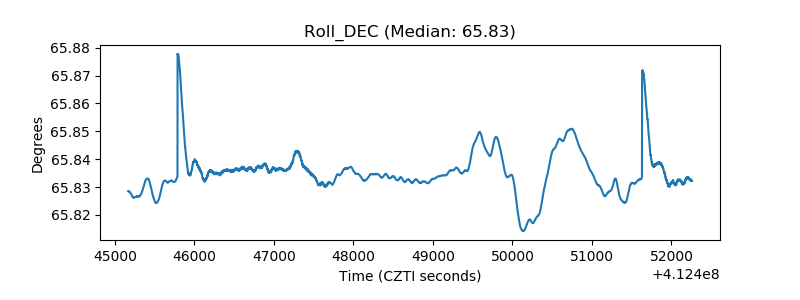 |
| _Roll_RA | 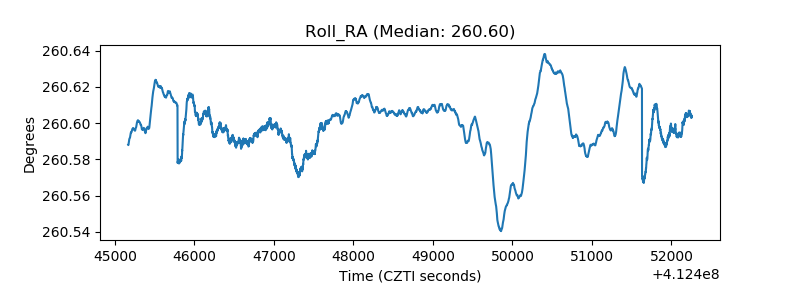 |
| Veto Counter | 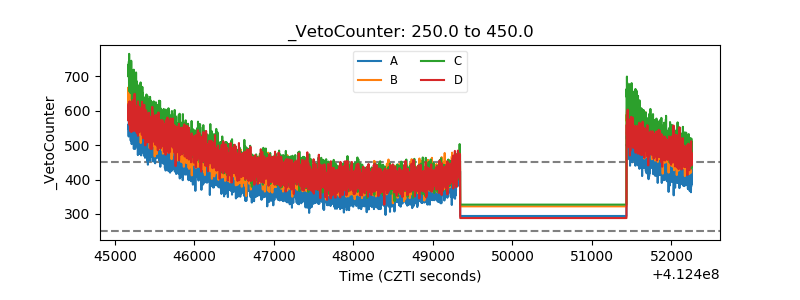 |