| Param | Original file | Final file |
|---|---|---|
| Filename | modeM0/AS1A12_018T01_9000005488_39636cztM0_level2.fits | modeM0/AS1A12_018T01_9000005488_39636cztM0_level2_quad_clean.evt |
| Size (bytes) | 457,237,440 | 87,696,000 |
| Size | 436.1 MB | 83.6 MB |
| Events in quadrant A | 4,236,632 | 608,944 |
| Events in quadrant B | 2,782,950 | 626,179 |
| Events in quadrant C | 6,318,930 | 531,229 |
| Events in quadrant D | 3,205,299 | 544,106 |
| Mode SS | |||
|---|---|---|---|
| Quadrant | BADHDUFLAG | Total packets | Discarded packets |
| A | 0 | 100 | 0 |
| B | 0 | 100 | 0 |
| C | 0 | 100 | 0 |
| D | 0 | 100 | 0 |
| Mode M0 | |||
|---|---|---|---|
| Quadrant | BADHDUFLAG | Total packets | Discarded packets |
| A | 0 | 15966 | 3 |
| B | 0 | 11517 | 2 |
| C | 0 | 22196 | 2 |
| D | 0 | 13010 | 2 |
| Mode M9 | |||
|---|---|---|---|
| Quadrant | BADHDUFLAG | Total packets | Discarded packets |
| A | 0 | 27 | 0 |
| B | 0 | 27 | 0 |
| C | 0 | 27 | 0 |
| D | 0 | 28 | 0 |
| Quadrant | Total seconds | Saturated seconds | Saturation percentage |
|---|---|---|---|
| A | 4922 | 119 | 2.417716% |
| B | 4922 | 76 | 1.544088% |
| C | 4922 | 839 | 17.045916% |
| D | 4922 | 217 | 4.408777% |
Noise dominated data is calculated using 1-second bins in cleaned event files. If a bin has >2000 counts, and if more than 50% of those come from <1% of pixels, then it is considered to be noise-dominated and hence unusable.
| Quadrant | # 1 sec bins | Bins with >0 counts | Bins with >2000 counts | High rate bins dominated by noise | Noise dominated (total time) | Noise dominated (detector-on time) | Marked lightcurve |
|---|---|---|---|---|---|---|---|
| A | 7045 | 4923 | 110 | 110 | 1.56% | 2.23% | 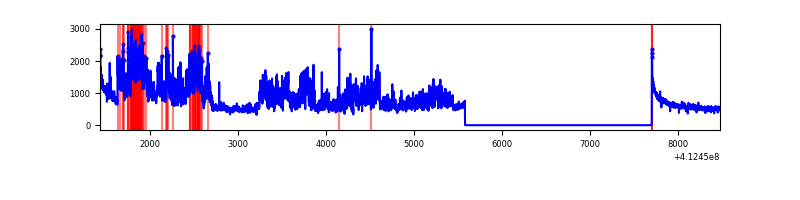 |
| B | 7045 | 4923 | 50 | 50 | 0.71% | 1.02% | 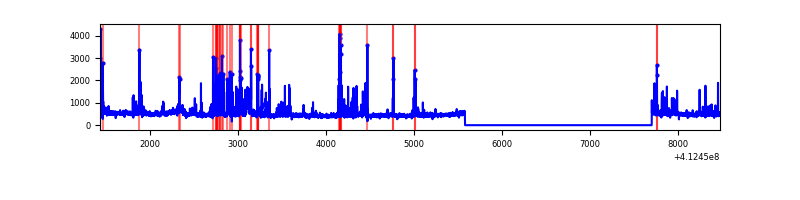 |
| C | 7045 | 4923 | 835 | 835 | 11.85% | 16.96% | 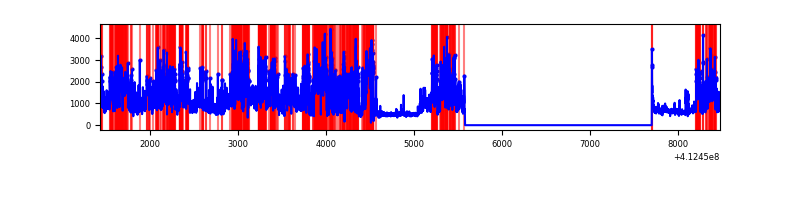 |
| D | 7045 | 4923 | 182 | 182 | 2.58% | 3.70% | 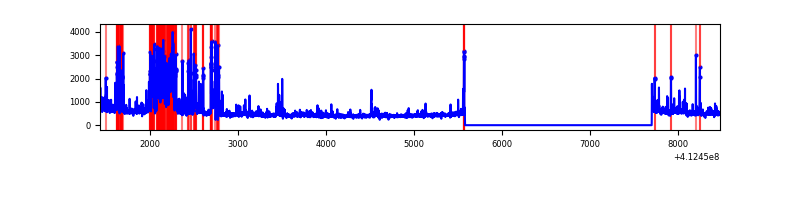 |
Top three noisy pixels from each quadrant. If the there are fewer than three noisy pixels in the level2.evt file, extra rows are filled as -1
| Pixel properties | Quadrant properties | ||||||
|---|---|---|---|---|---|---|---|
| Quadrant | DetID | PixID | Counts | Sigma | Mean | Median | Sigma |
| A | 15 | 222 | 1643215 | 14736.72 | 555 | 544 | 111.5 |
| A | 10 | 83 | 434418 | 3892.37 | 555 | 544 | 111.5 |
| A | 13 | 254 | 6693 | 55.16 | 555 | 544 | 111.5 |
| B | 5 | 172 | 279405 | 2677.08 | 555 | 540 | 104.2 |
| B | 5 | 255 | 266617 | 2554.31 | 555 | 540 | 104.2 |
| B | 4 | 170 | 20349 | 190.16 | 555 | 540 | 104.2 |
| C | 15 | 208 | 2874028 | 23678.53 | 526 | 530 | 121.4 |
| C | 9 | 187 | 1150181 | 9473.49 | 526 | 530 | 121.4 |
| C | 15 | 214 | 197953 | 1626.83 | 526 | 530 | 121.4 |
| D | 13 | 249 | 765766 | 5737.72 | 548 | 533 | 133.4 |
| D | 1 | 52 | 146921 | 1097.62 | 548 | 533 | 133.4 |
| D | 13 | 171 | 58617 | 435.51 | 548 | 533 | 133.4 |
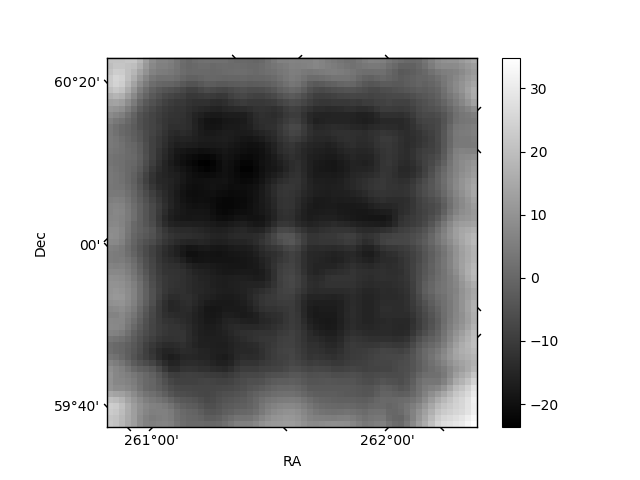
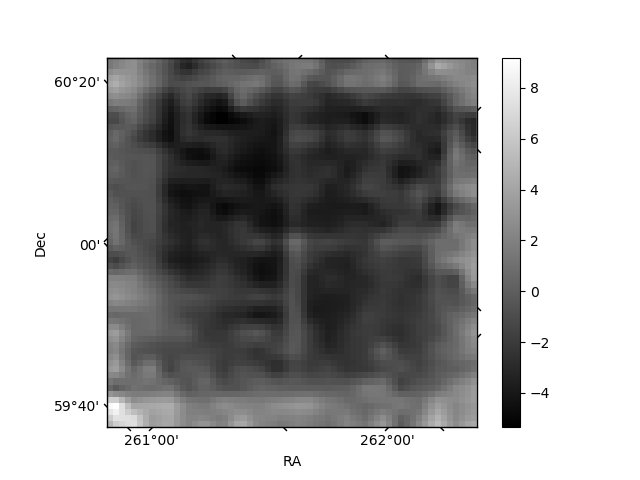
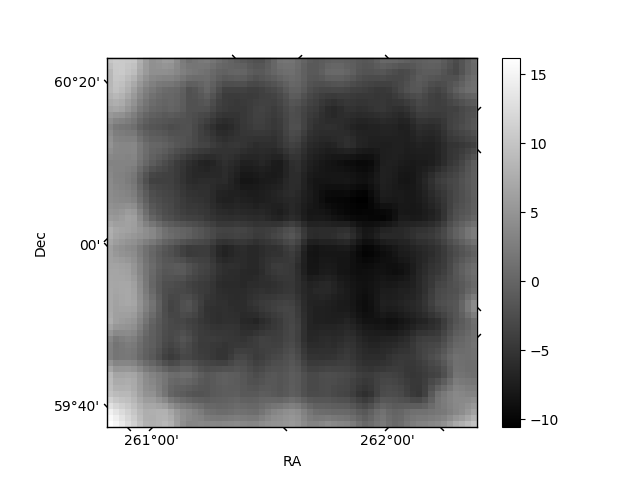
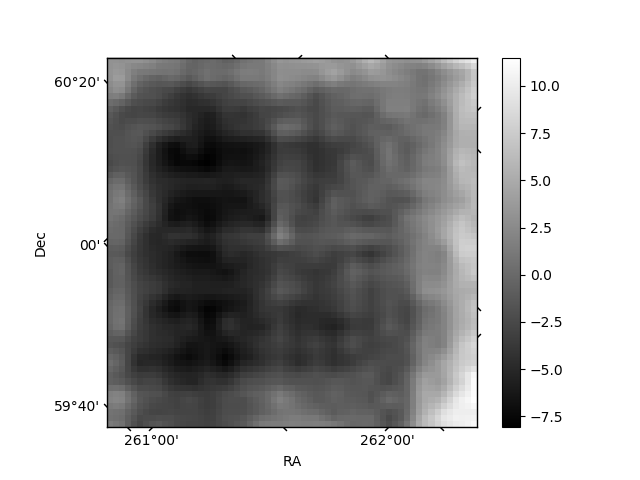
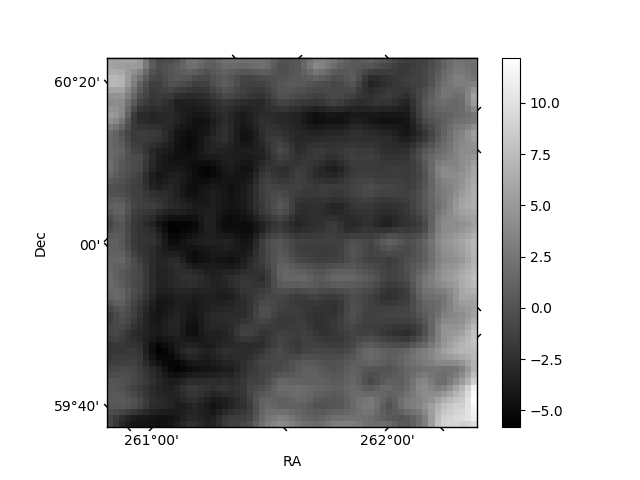
Histogram calculated using DETX and DETY for each event in the final _common_clean file
| Quadrant A | 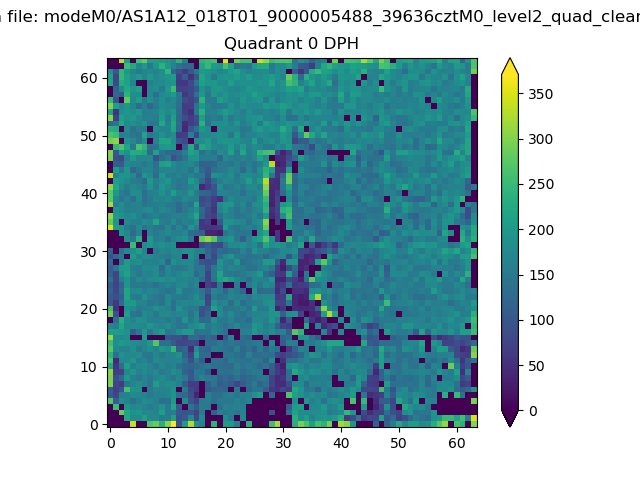 |
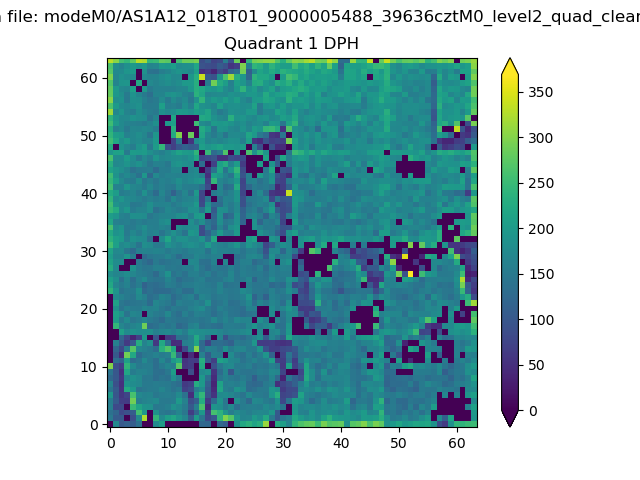 |
Quadrant B |
|---|---|---|---|
| Quadrant D | 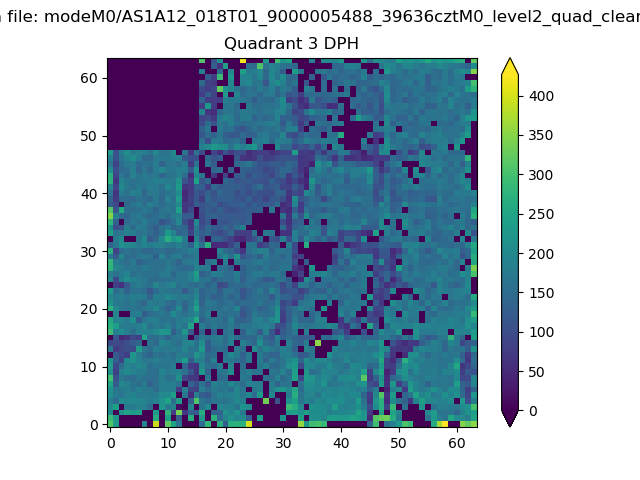 |
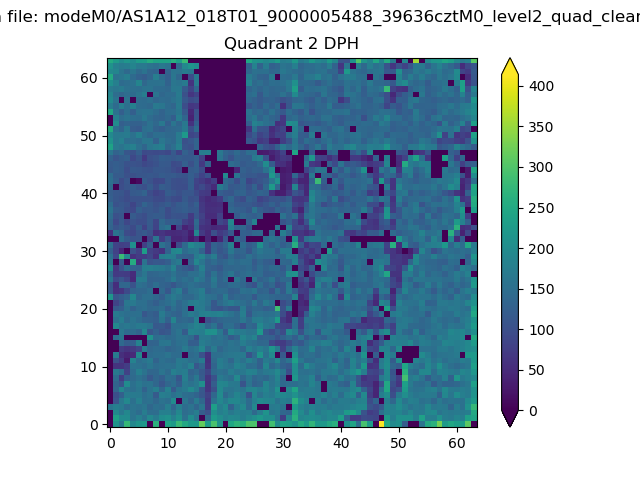 |
Quadrant C |
| Plot type | Count rate plots | Images |
|---|---|---|
| Comparison with Poisson distribution Blue bars denote a histogram of data divided into 1 sec bins. Red curve is a Poisson curve with rate = median count rate of data. |
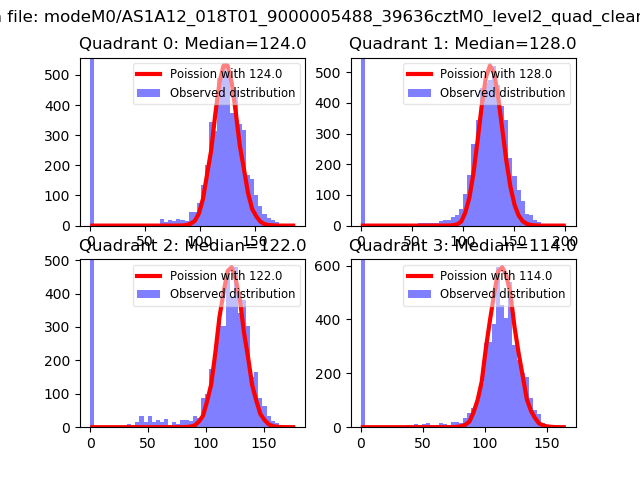 |
 |
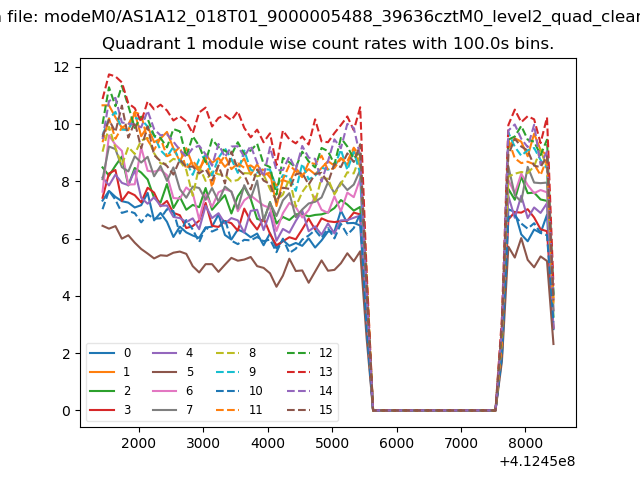
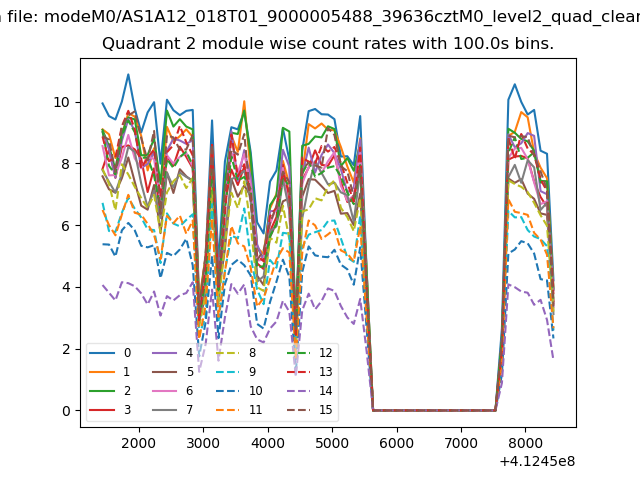
| Quadrant-wise count rates Data is divided into 100 sec bins |
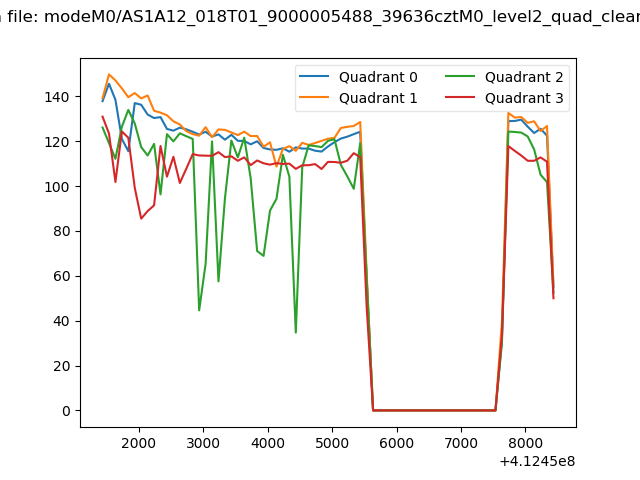 |
|
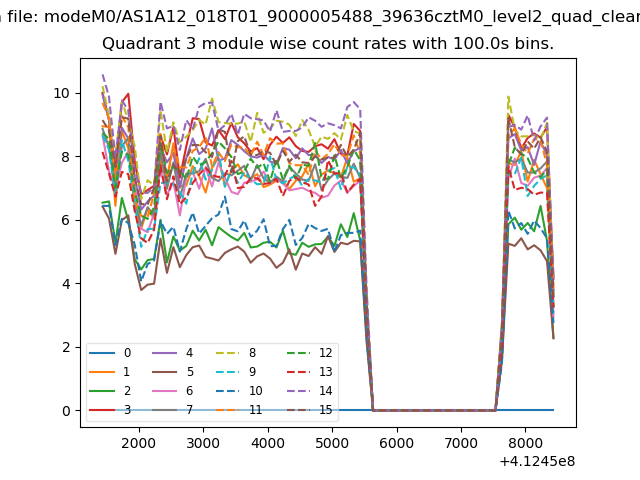
| Module-wise count rates for Quadrant A Data is divided into 100 sec bins |
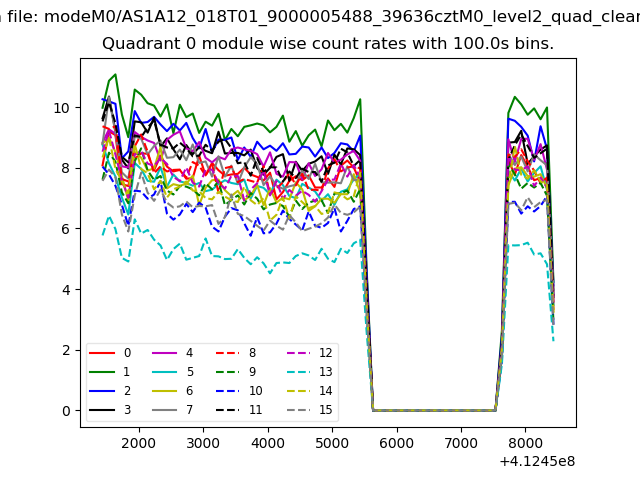 |
 |
| Module-wise count rates for Quadrant B Data is divided into 100 sec bins |
 |
 |
| Module-wise count rates for Quadrant C Data is divided into 100 sec bins |
 |
 |
| Module-wise count rates for Quadrant D Data is divided into 100 sec bins |
 |
 |
| Parameter | Plot |
|---|---|
| CZT HV Monitor | 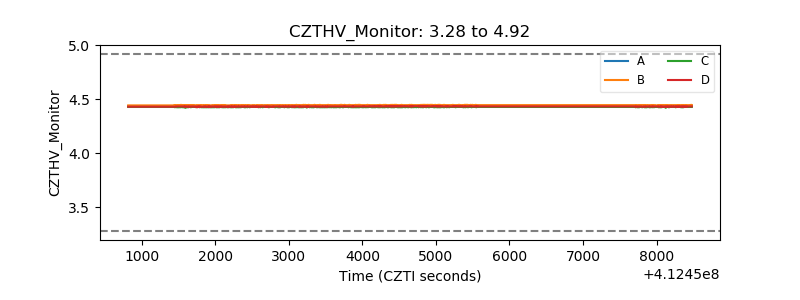 |
| D_VDD | 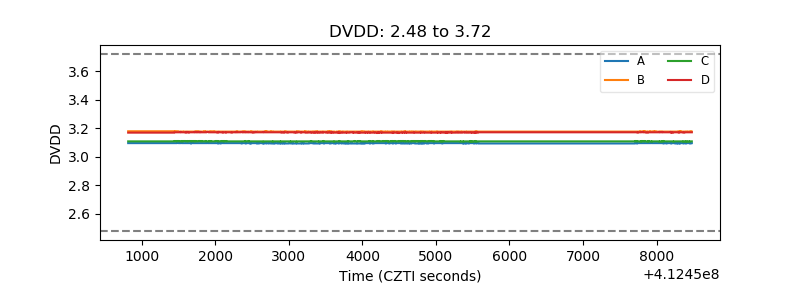 |
| Temperature 1 | 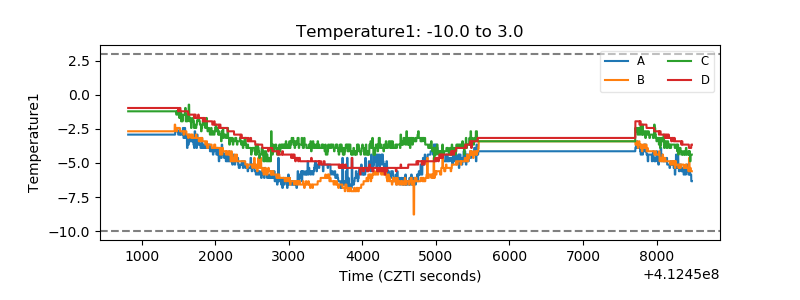 |
| Veto HV Monitor | 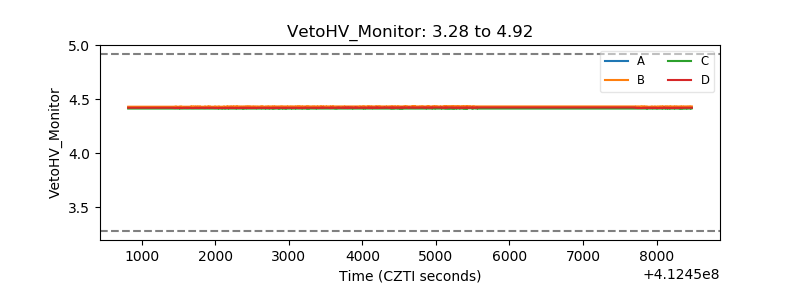 |
| Veto LLD | 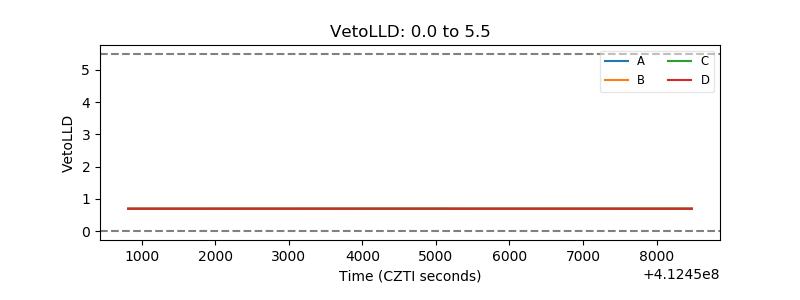 |
| Alpha Counter | 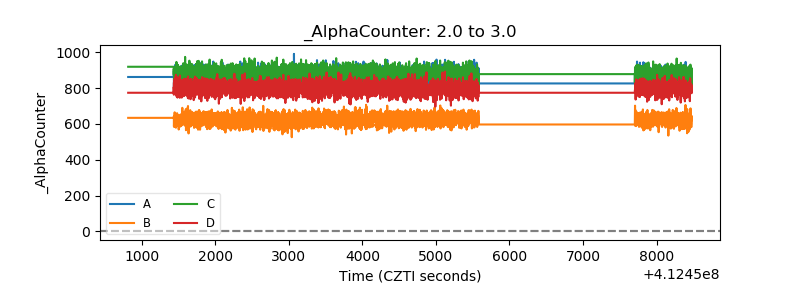 |
| _CPM_Rate |  |
| CZT Counter | 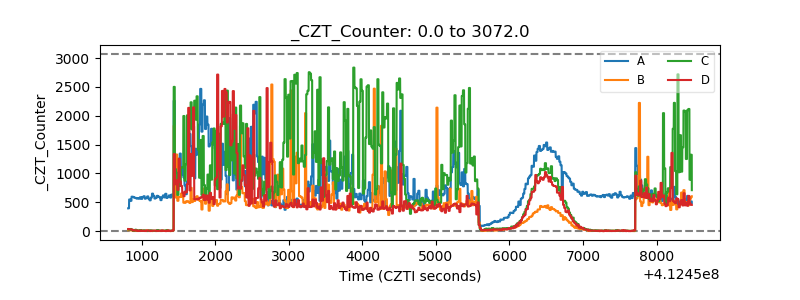 |
| +2.5 Volts monitor | 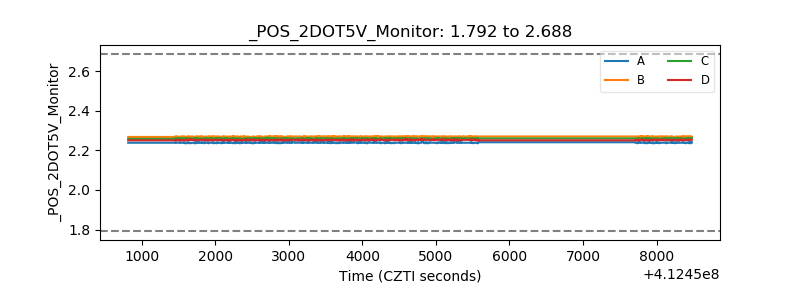 |
| +5 Volts monitor | 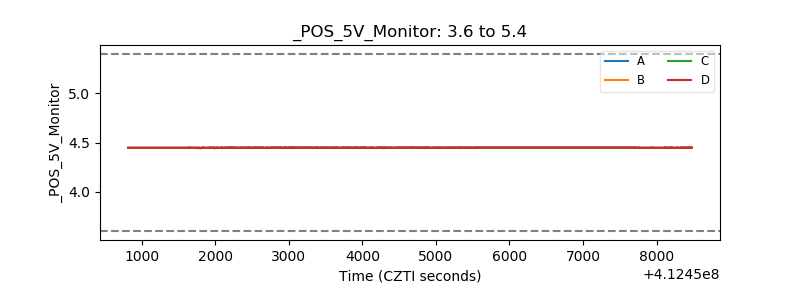 |
| _ROLL_ROT | 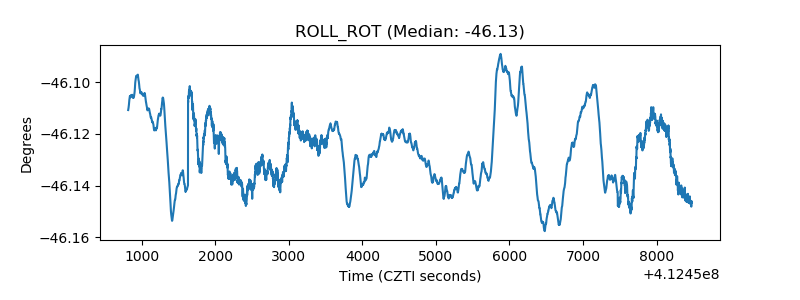 |
| _Roll_DEC | 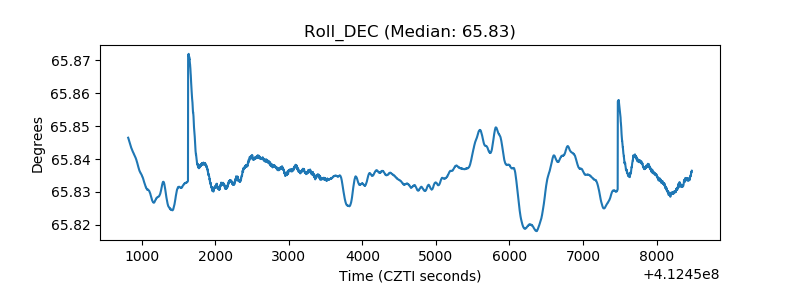 |
| _Roll_RA | 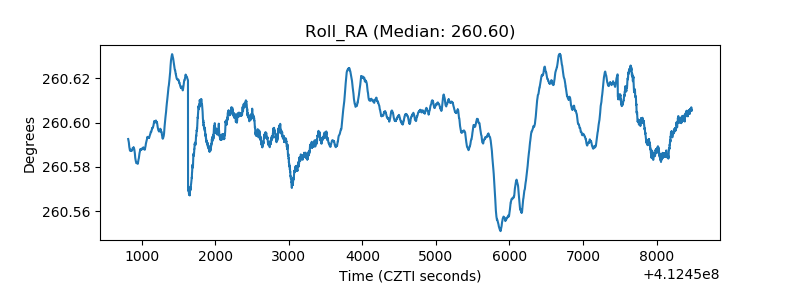 |
| Veto Counter | 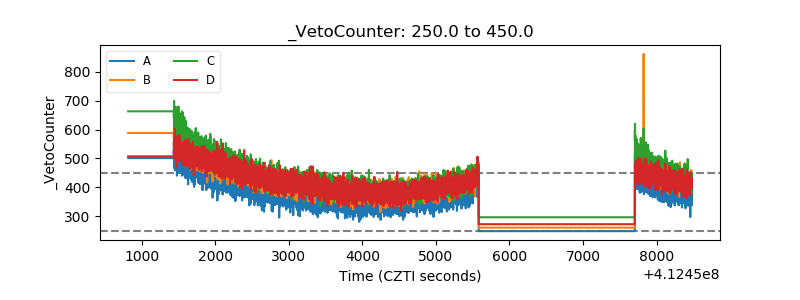 |